
Power BI Blog: Smart Narratives Now Generally Available
3 June 2021
Welcome back to this week’s edition of the Power BI blog series. This week, we look at Smart Narratives, which are now Generally Available in Power BI Desktop.
The latest Power BI Desktop update sees both Smart Narratives and Anomaly Detection now become Generally Available. We have discussed Anomaly Detection before, so let’s concentrate on Smart Narratives here.
Frequently, users will use PowerPoint, text boxes, interactive headers or custom visuals to add narrative to their data. All these options either lack interactive data, interactive and customisable text or useful automatic insights. The Smart narrative visualisation helps you quickly summarise visuals and reports by providing relevant out-of-the-box insights in a customisable fashion.
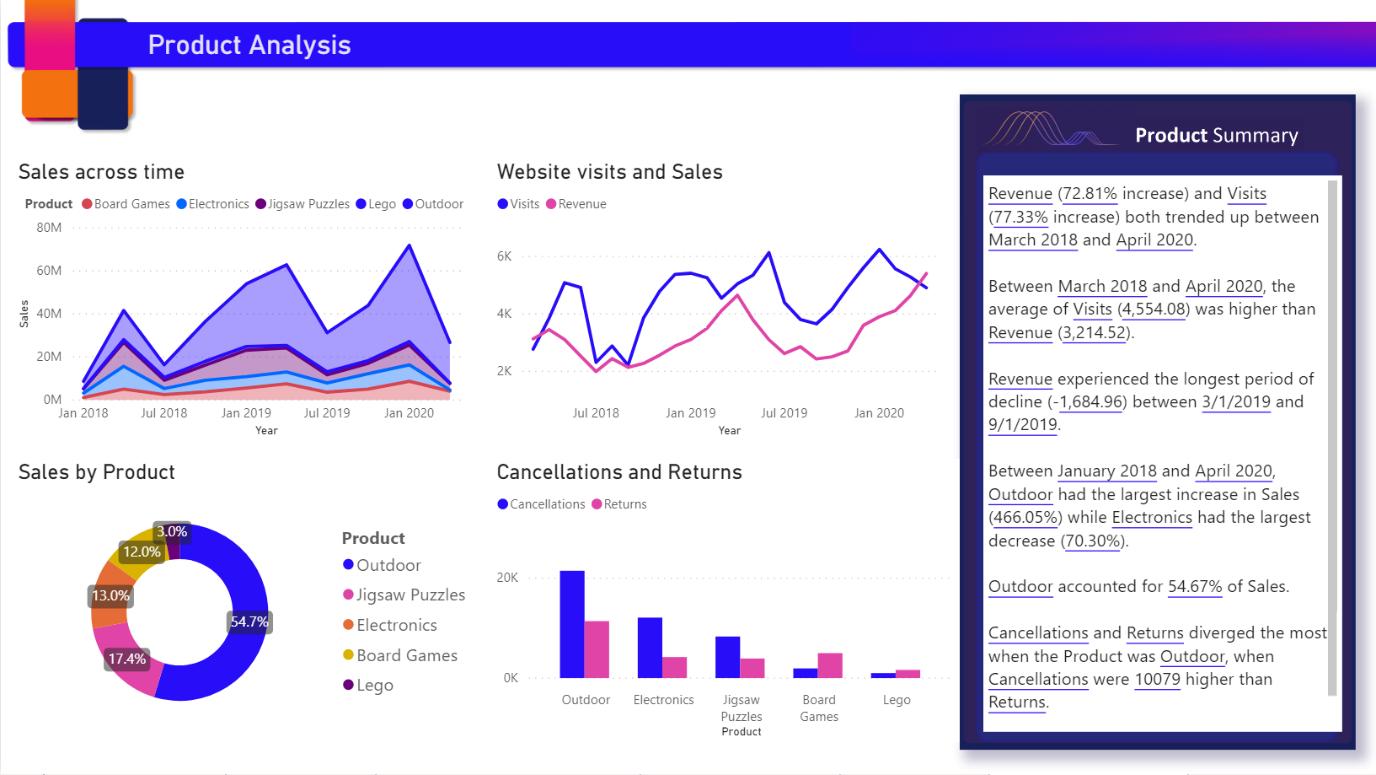
Using this feature creators can add narratives to their report to address key takeaways, point out trends, and edit the language and format it to fit a specific audience. Instead of pasting a screenshot of their report in PowerPoint with key takeaways added, you may now add narratives to the report that are updated with every refresh. End-users may use the narratives to understand their data, get to the key points faster and explain the data to others.
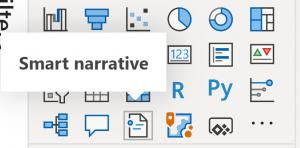
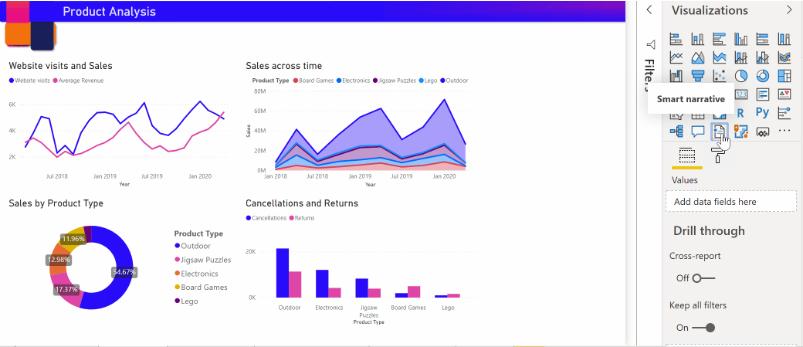
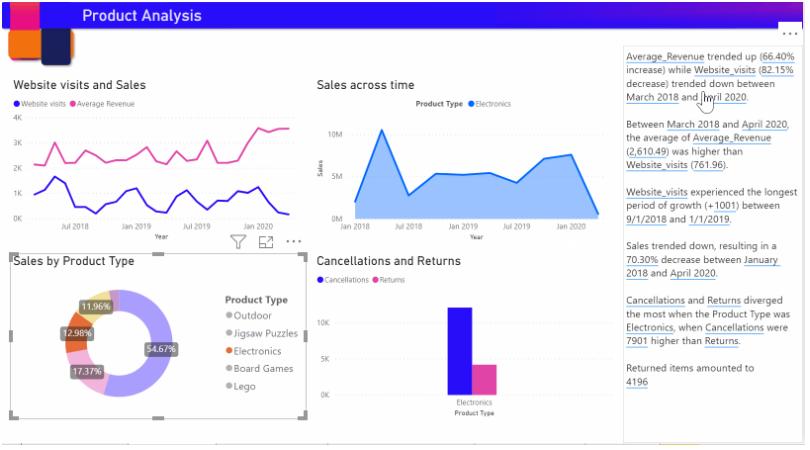
Clicking on the new smart narratives icon in the Visualization pane creates a narrative based upon all the visuals on the page.
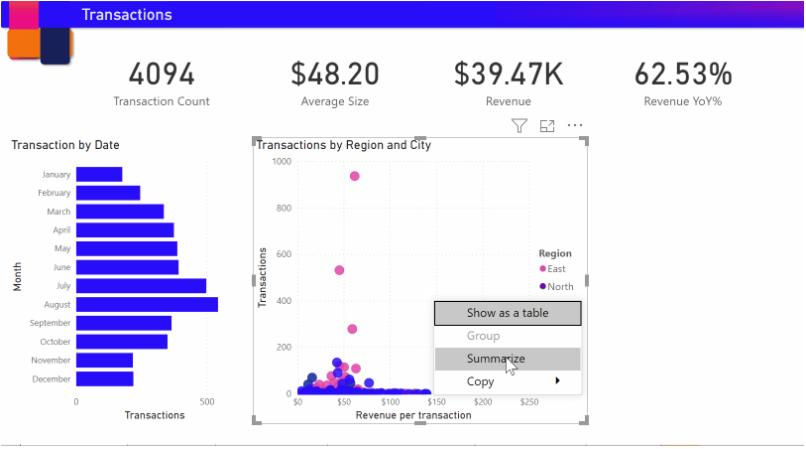
You can also right click a visual and select ‘summarize’. This will generate an automatic summary of that visualisation. For example, Power BI analyses the scatter chart visual showing the various transactions and shows which city / region has the highest revenue per transaction and highest number of transactions:
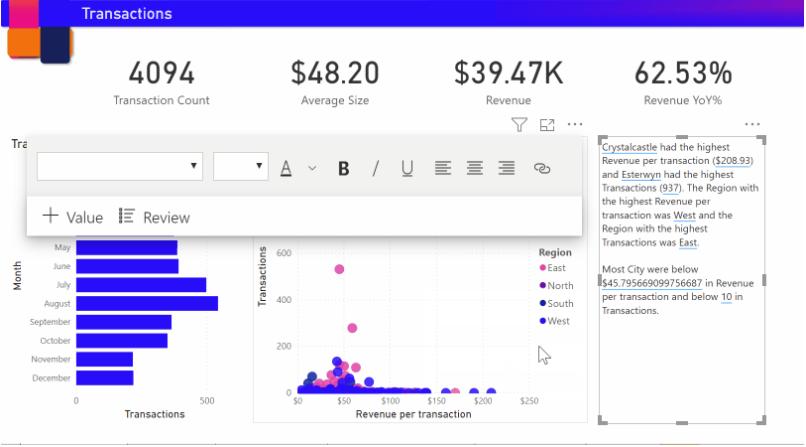
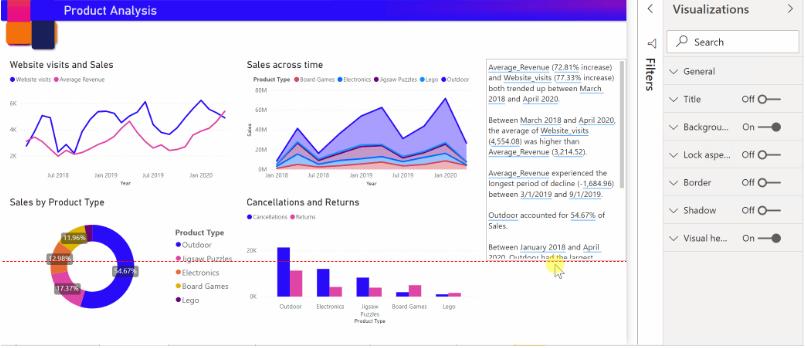
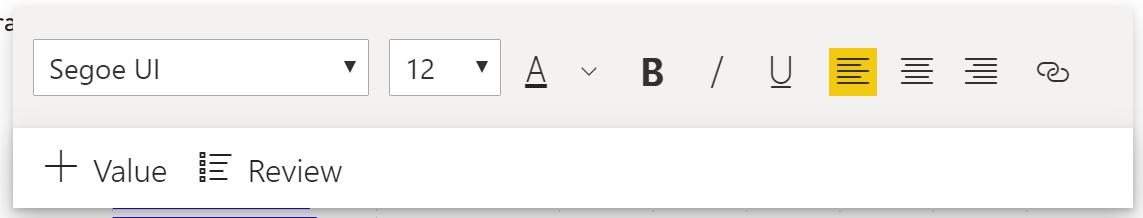
The summary is highly customisable, where you can add new text, or edit the existing text using the same controls available in the regular text box.
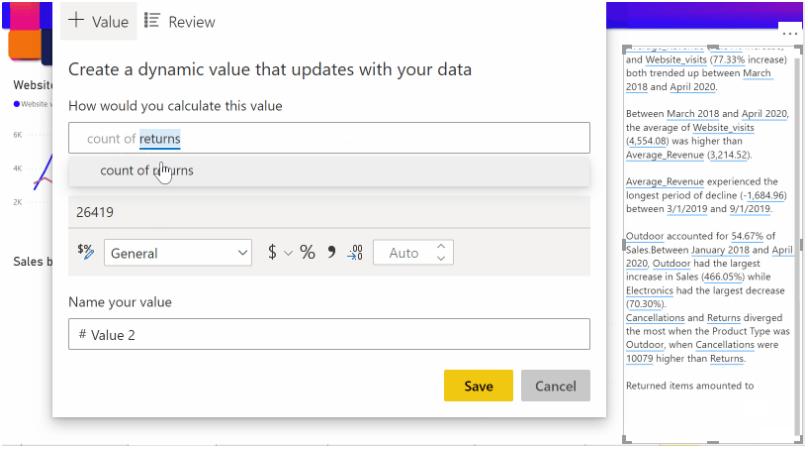
You can also customise the summary by adding dynamic values. You can map text to existing fields and measures or use natural language to define new measure to map to text.
The summary is dynamic and automatically updates the generated text and dynamic values when you cross filter.
Our clients have been crying out for something like this for years. This could be quite amazing.
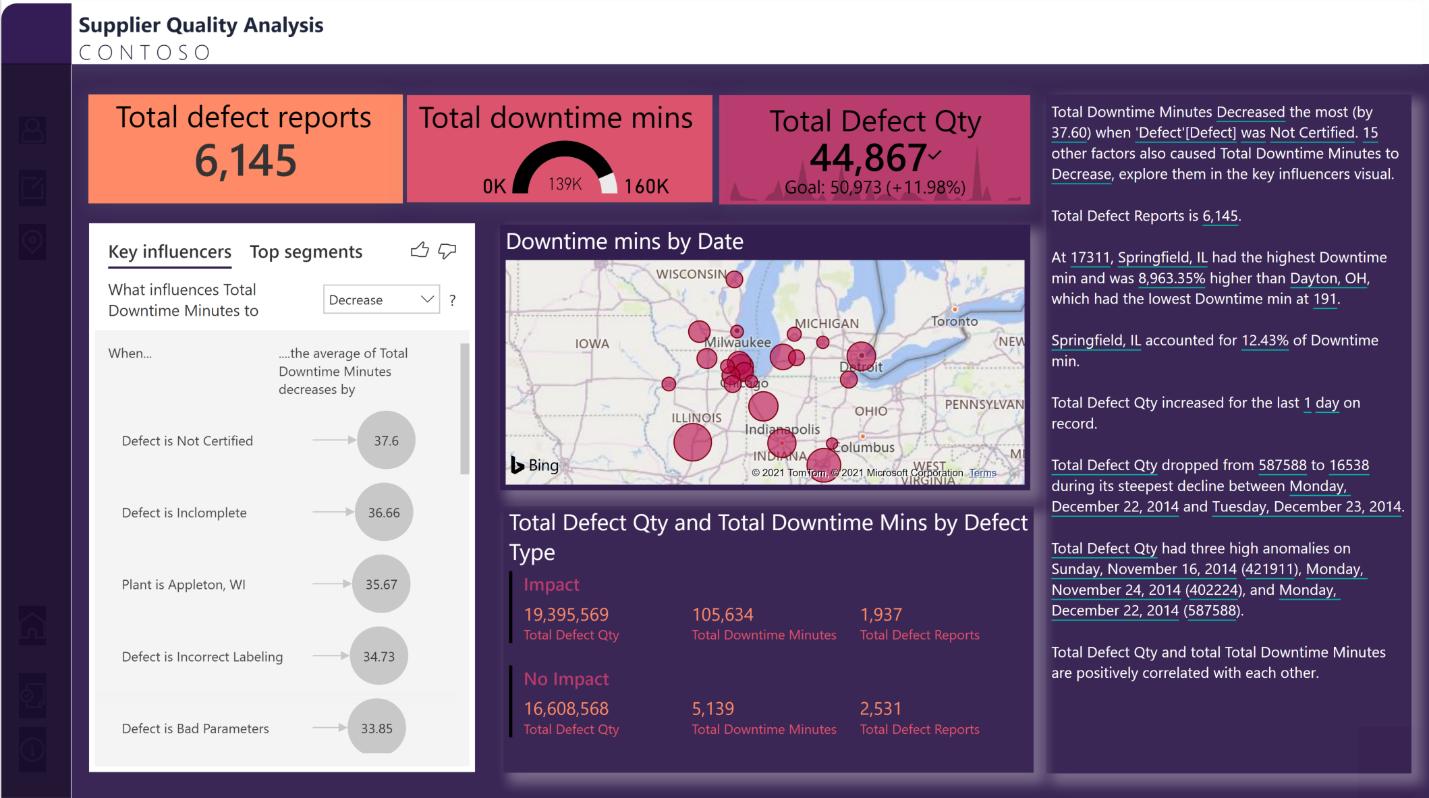
Further, the Generally Available version of Smart Narratives now supports summarisation of more visuals such as Maps, KPI, Gauge, Card, Multi Card, Key Influencers and localisation for no less than 43 languages.
In the meantime, please remember we offer training in Power BI which you can find out more about here. If you wish to catch up on past articles, you can find all of our past Power BI blogs here.