
Free Three Way Integrated Financial Model (Excel)
26 May 2020
We know that everyone all over the world has been going through a fairly tough time with isolation and social distancing. We know how important it is to maintain these measures in order to keep everyone safe from the coronavirus.
With isolation laws in place, many businesses have had to go through some form of restructuring, be it selling products at a different stage of production or changing the entire operation of the company. Cash flows have suffered too, as everyone has tightened their proverbial belts. These changes require analysis of the company’s financial statements, both actual and forecast, before making any decisions. To help our readers, we have decided to give out a free copy of a three-way integrated financial model in Excel.
You can find a copy of the file here.
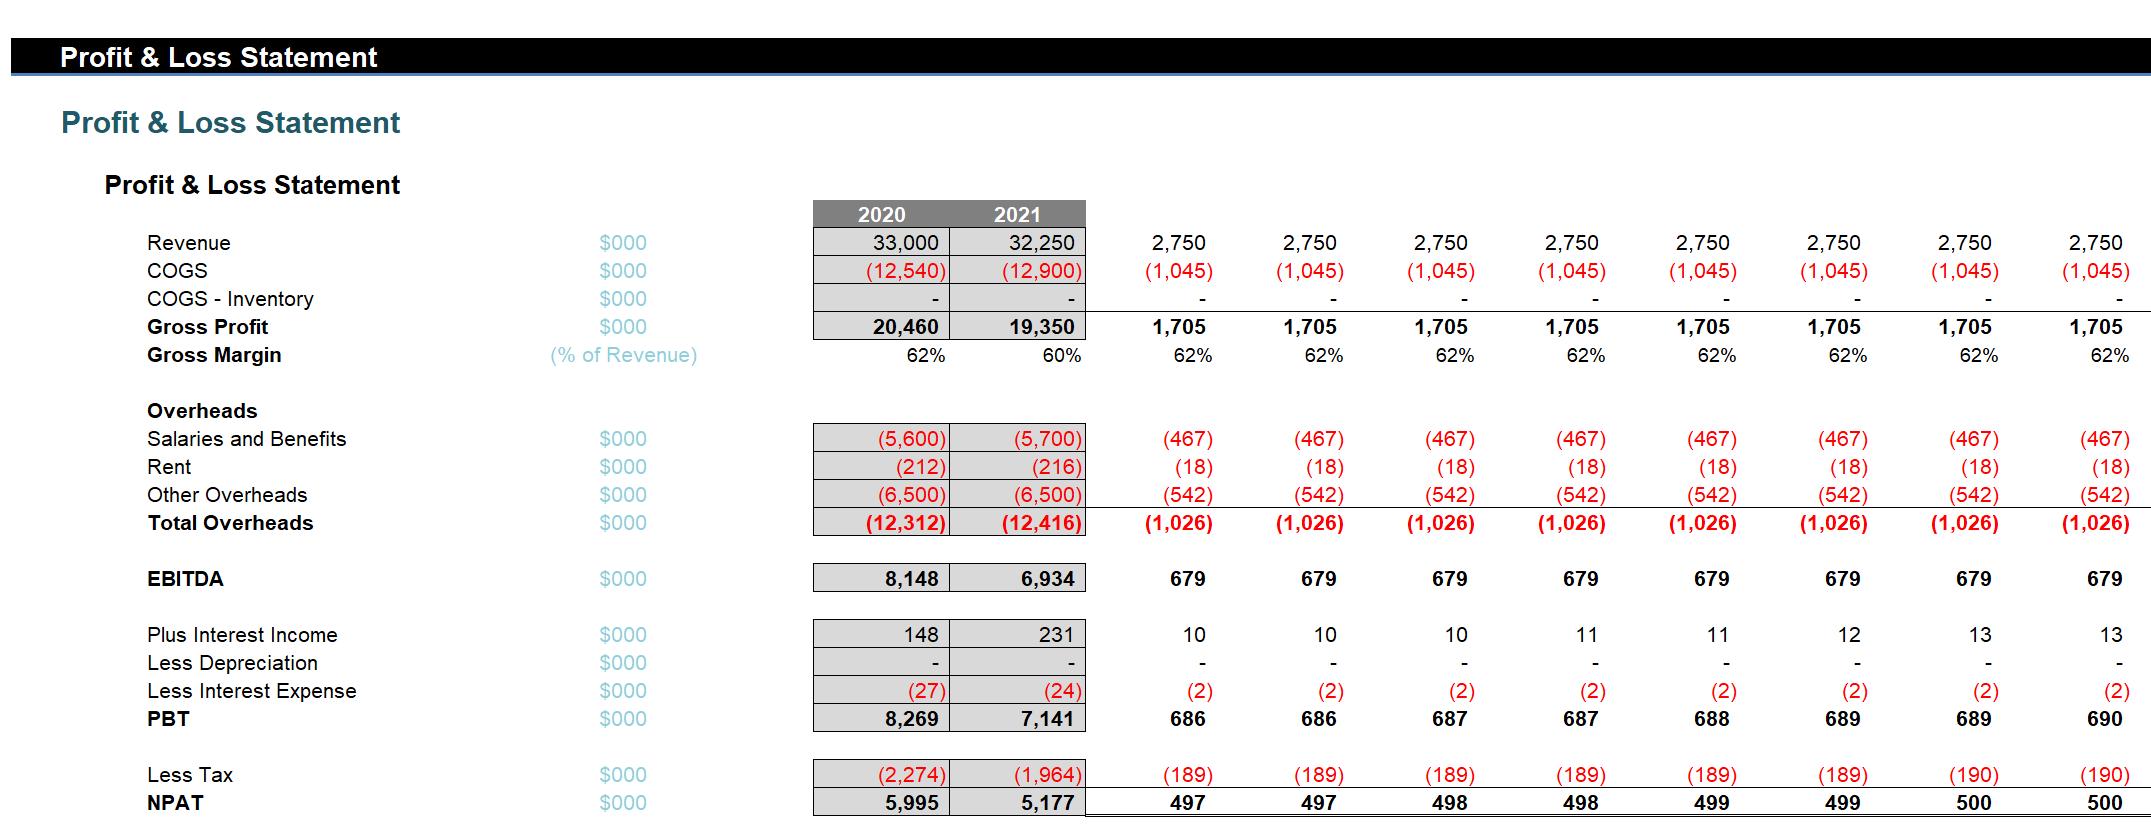
Hopefully, you will find this file useful. Please note that it is a simple three-way integrated financial model, it contains generic input assumptions that applies to many businesses, but it’s not perfect and it is simplistic. Our normal models are more sophisticated, but you get the general idea.
We hope this will be beneficial: a user will have to add inputs and possibly adapt the model further before it should be used in a business, but it’s better than a blank Excel worksheet. And please remember, we do not warrant that the model is free from mathematical error and / or accounting accuracy, so caveat emptor!
But there’s more.
Apart from three-way integrated financial models in Excel, we are also proud to announce that we will be offering a new service where we will build the same three-way integrated financial models in Power BI. We know some of our competitors are offering similar products, but we believe we are the only company to offer to construct the financials completely in Power BI, rather than import the statements from elsewhere (obviously, we still need to bring the source data in!).
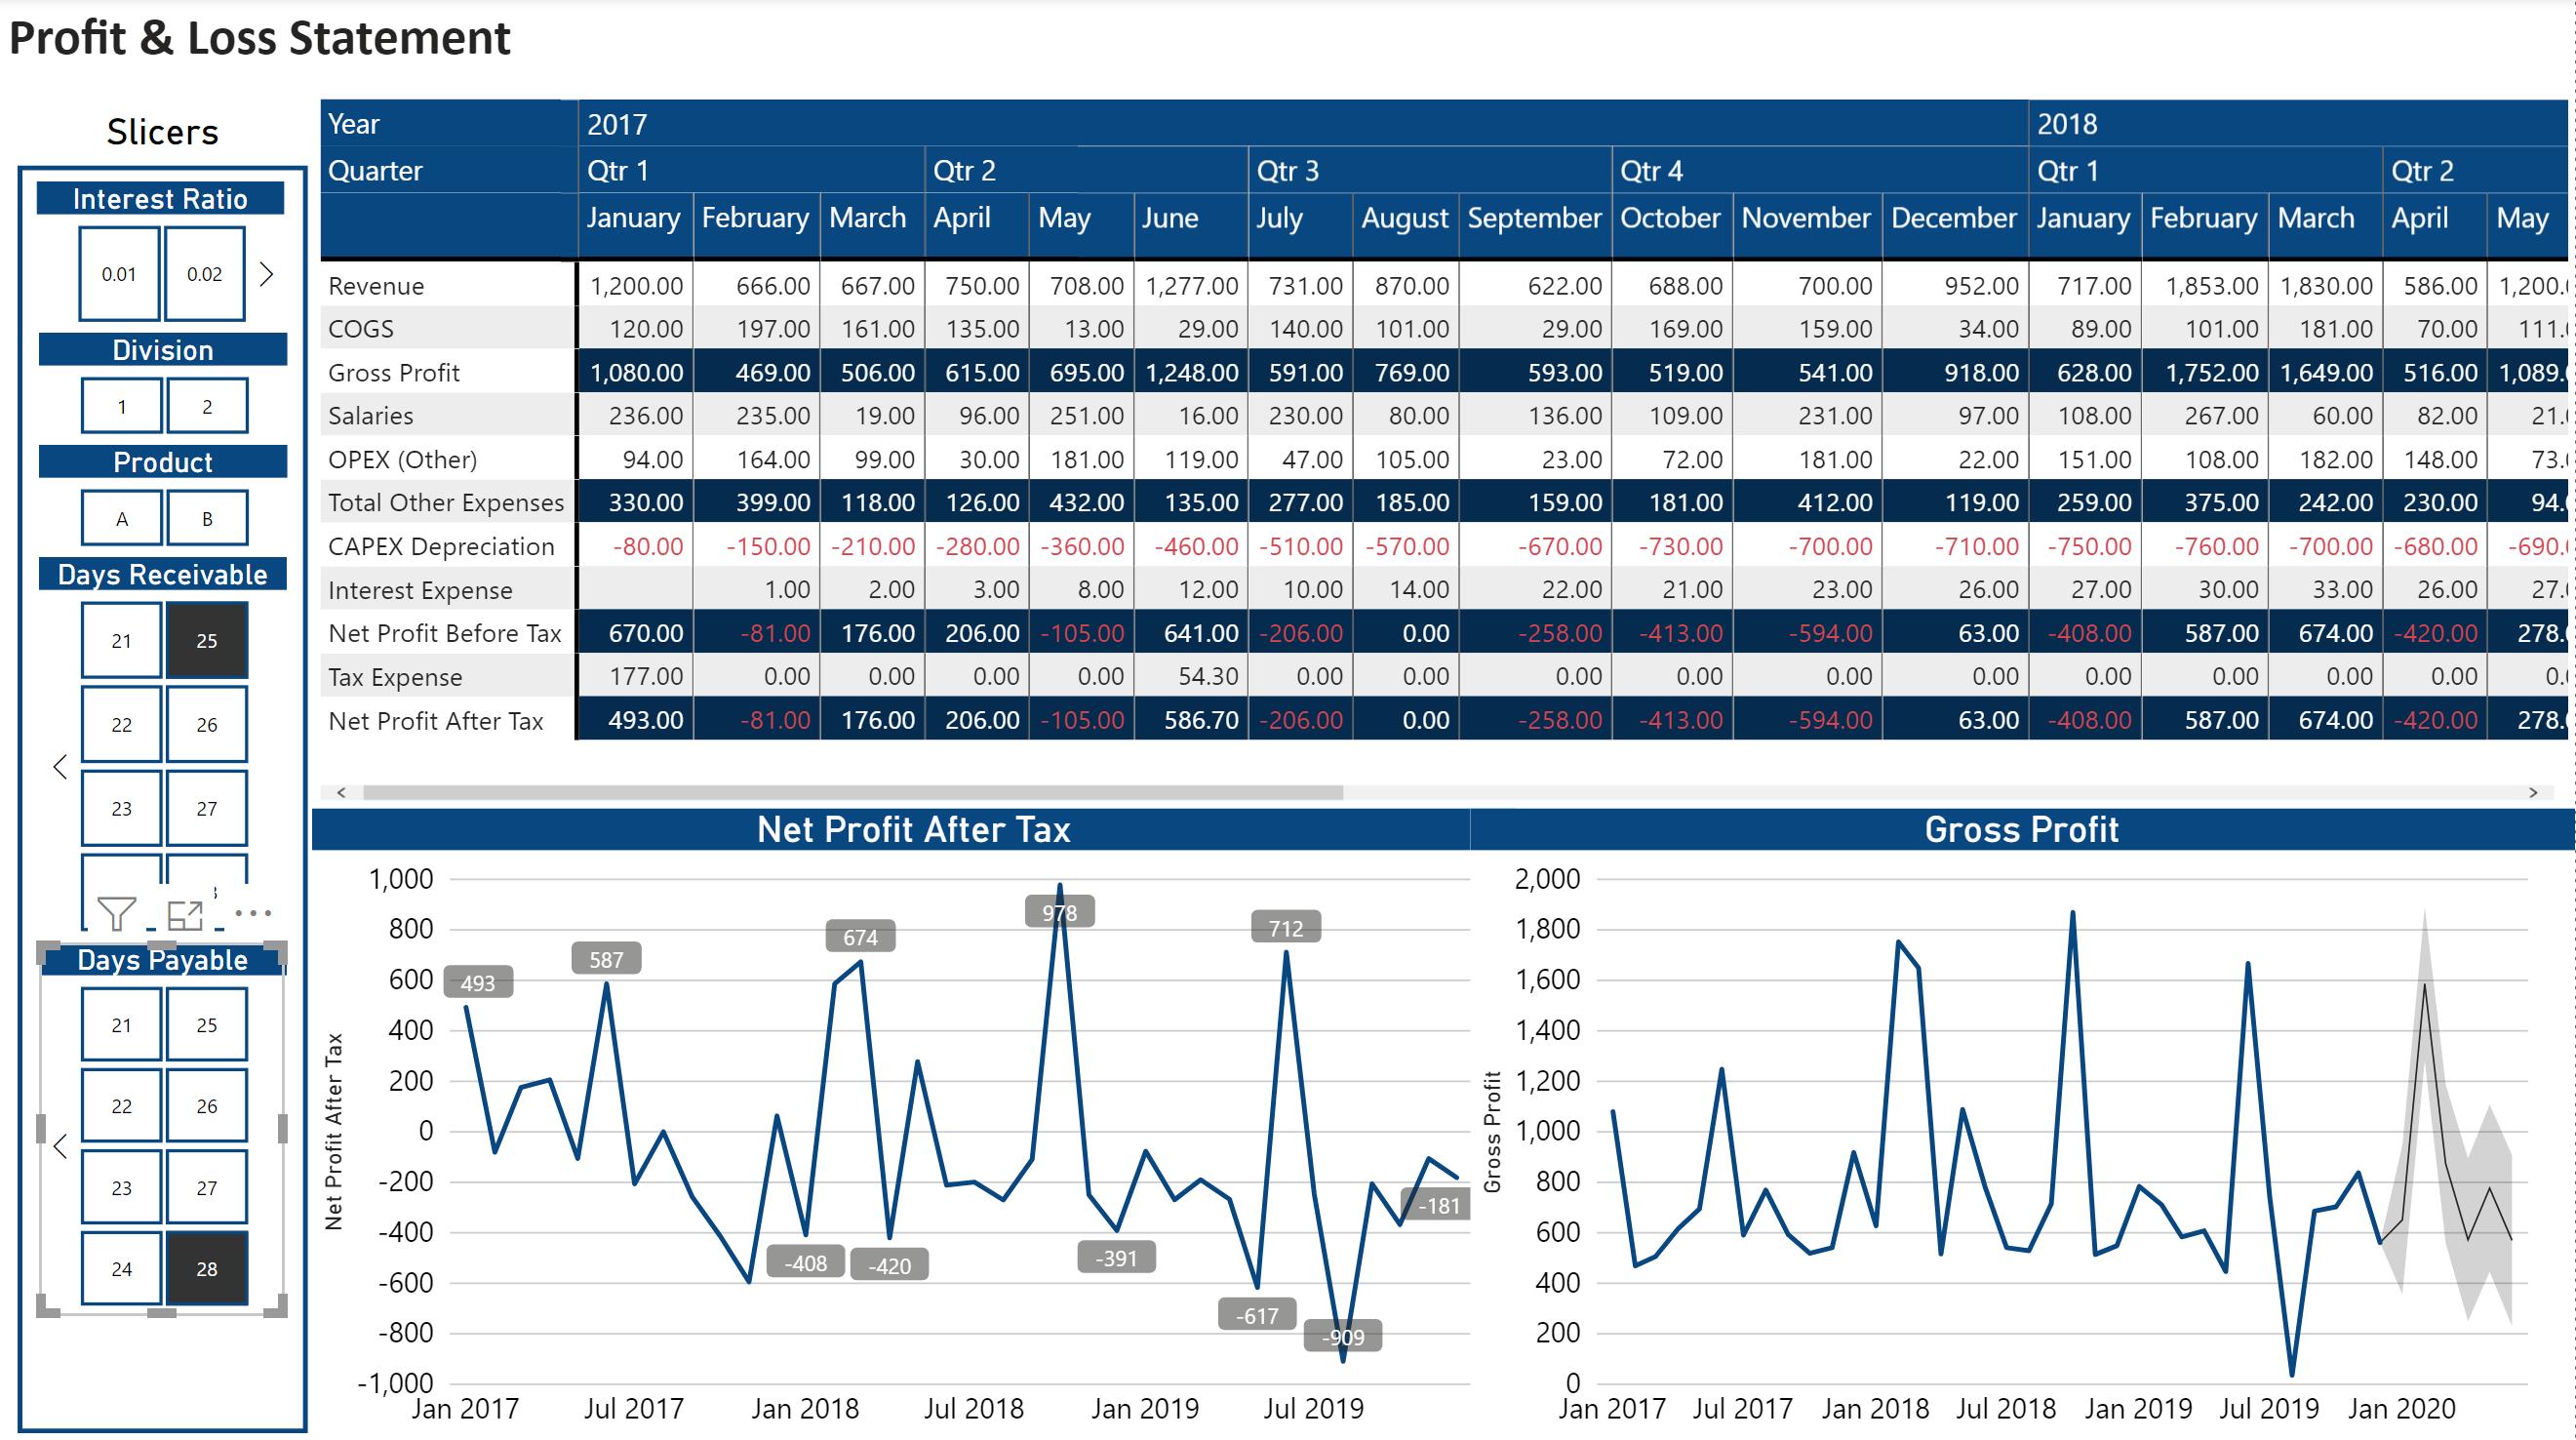
Building such models in Power BI offers greater flexibility for end users. With a reporting dashboard created in Power BI, depending on the complexity of the data, end users will be able to slice and dice the data at any level in any way they want. They will also be able to flex certain inputs and see live dynamic changes to their bottom line when variables are altered.
If you are interested in learning more, please reach out to us at contact@sumproduct.com. Don’t forget, if you want to know how to model three-way integrated statements for yourself, we also offer online training and >virtual training courses.