
Python in Excel in Preview
14 September 2023
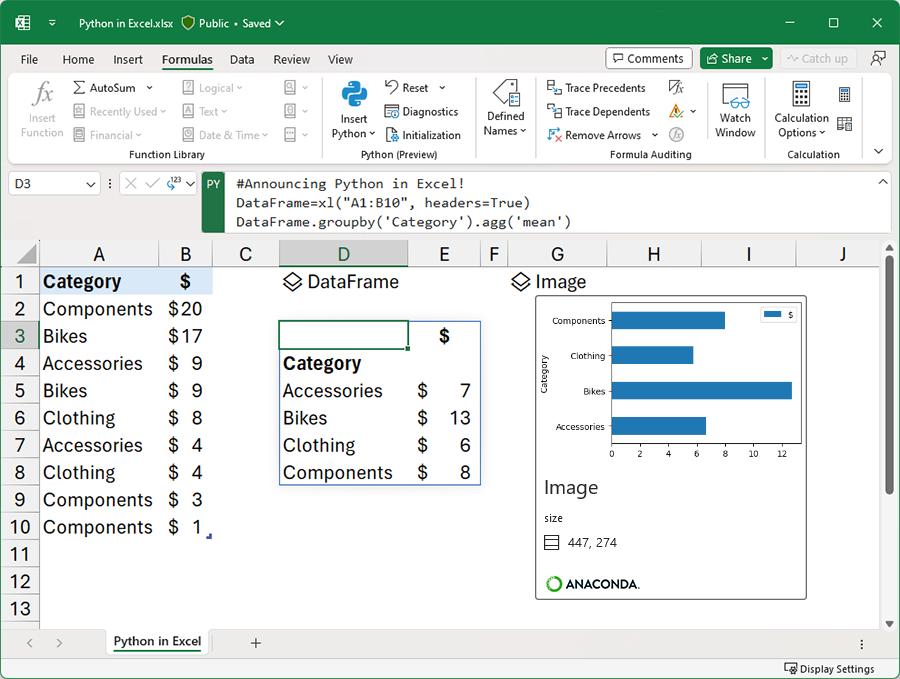
We have recently seen “a significant evolution” in the analytical capabilities available within Excel with the release of a Public Preview of Python in Excel. Python in Excel makes it possible to natively combine the programming language Python and Excel analytics within the same workbook - with no setup required. With Python in Excel, you can type Python directly into a cell, the Python calculations run in the Microsoft Cloud, and your results are returned to the worksheet, including plots and visualisations.
Python in Excel is rolling out to Public Preview for those in the Microsoft 365 Insiders program, using the Beta Channel in Excel for Windows.
Given there are several languages out there that analysts use (e.g. R, SQL to name but two), it is not unreasonable to consider why is Python the first cab off the rank? There are several reasons mentioned by the Microsoft team, which we summarise below. These are detailed below.
Built for analysts
Every day, millions of users around the world rely on familiar Excel tools such as formulas, charts and PivotTables to analyse and understand their data. As of this update, Python in Excel will also be natively integrated directly into the Excel grid. To get started simply use the new PY function which allows you to input Python code directly into Excel cells.
Excel users now have access to powerful analytics via Python for visualisations, cleaning data, machine learning, predictive analytics, and more. Users may now create end to end solutions that seamlessly combine Excel and Python all within Excel. Using Excel’s built-in connectors and Power Query, users can easily bring external data into Python in Excel workflows. Python in Excel is compatible with the tools users know well, such as formulae, PivotTables and Excel charts.
To get Python in Excel, we need to have a specific version of Excel for Windows. We need to join the Microsoft 356 Insider program and choose the Beta Channel. Even then, the rollout may not be complete, so some patience may be required!
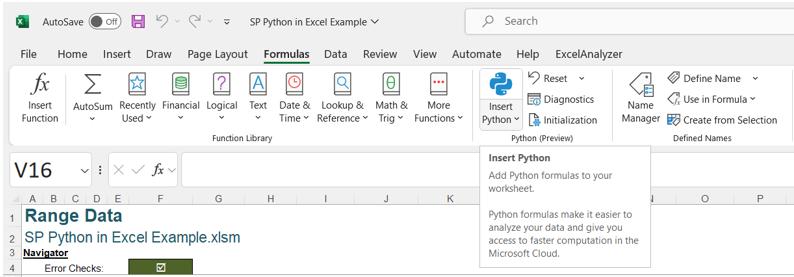
If we have the latest Insider build of Excel, there are a couple of ways to choose to try the Python in Excel preview. We can open a workbook and go to the Formulas bar, where we have the option to ‘Insert Python’:
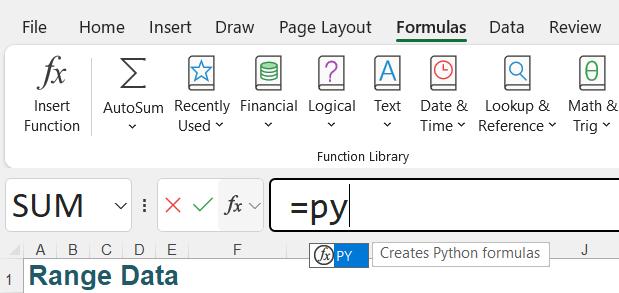
Another way is to enter
=PY
into an Excel cell. The intellisense then allows us to choose PY using TAB:
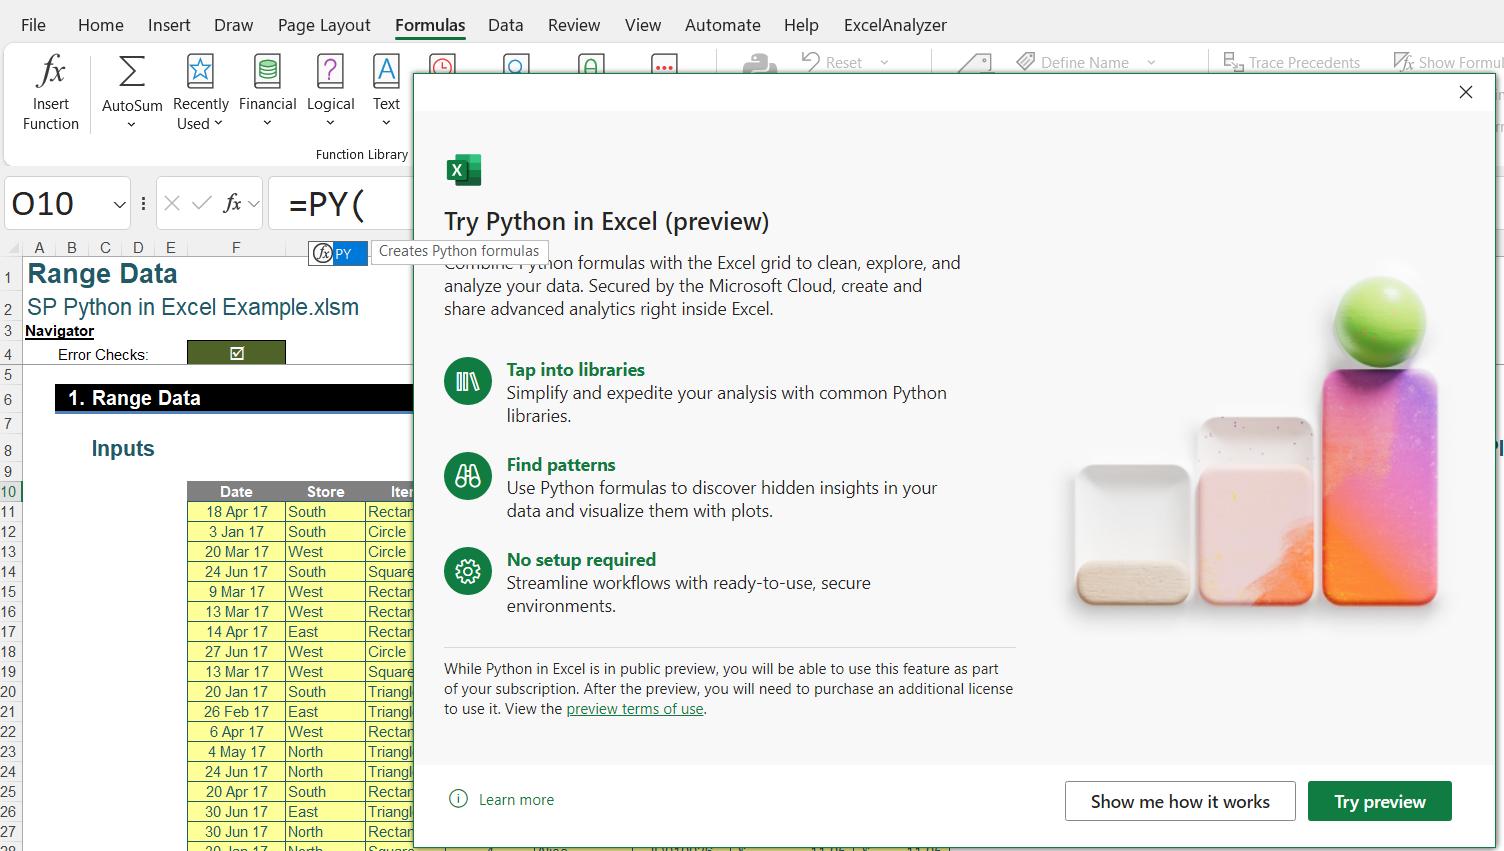
When we choose the excel function PY, we have the option to enable the preview:
Having activated the preview, let’s have a look at what we can do with some sample data. Do note that the features described in this article may be subject to change as Microsoft responds to feedback during the review period.
Python can use several data sources in Excel. Let’s start with a range of data:
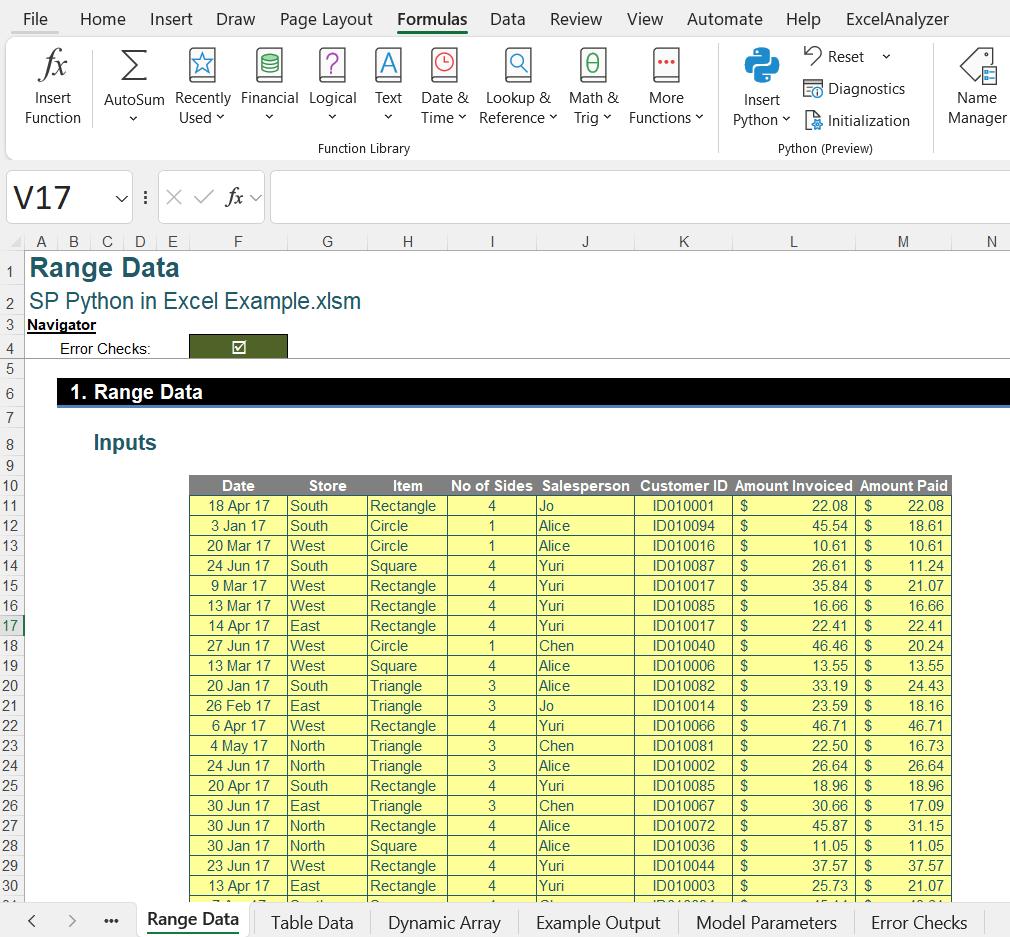
Accessing the Python Formula bar is similar to the preview activation described above. One way is to type ‘=PY’ in the Formula bar and then press TAB, the shortcut for this is CTRL + ALT + SHIFT + P. The Formula bar then has a green PY icon:
Another way to access Python programming is to use the icon on the Formulas tab:
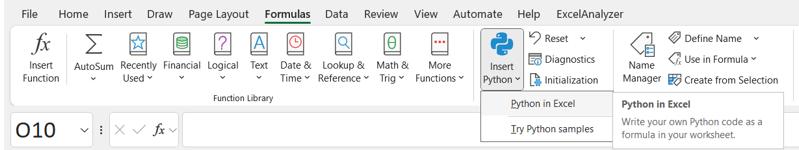
Choosing ‘Python in Excel’ or clicking on the ‘Insert Python’ icon will allow us to type Python code in the Formula bar.
Of course, there is no point entering unconnected Python commands, the point of using Python in Excel is to analyse the data we have in Excel. To that end, there is a Python function that we will need to be familiar with:
xl(“source”, headers = True/False)
(For those familiar with Python, this may be reminiscent of the Pandas module function read_excel(), though the syntax here is different since Python is embedded into Excel. In fact pandas.read_excel will not work in Python for Excel, as xl() is more secure.)
The source can be a range, Excel Table, Power Query table, defined name or dynamic array, with or without headers. The output is read into a DataFrame object. We need to specify a variable to assign to the DataFrame object, therefore the syntax we use is:
x=xl(“source”, headers = True/False)
where x is the variable. There are some rules for Python variable names, they:
- are case sensitive
- only contain letters, numbers, and underscores (_)
- must begin with a letter or an underscore, never a number
- must not be the same as a keyword in Python, e.g. ‘True’.
Since our variable will represent a DataFrame, we will begin out variable name with ‘df’.
When we enter a Python formula to read a data range, we notice that pressing ENTER does not complete the command; we are taken to the next line of Python code. In order to complete a Python formula, we need to use CTRL + ENTER. We can also use the green tick to complete the code.
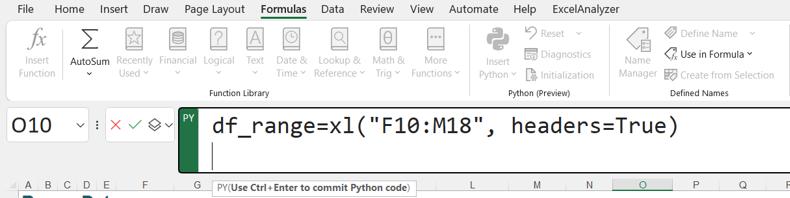
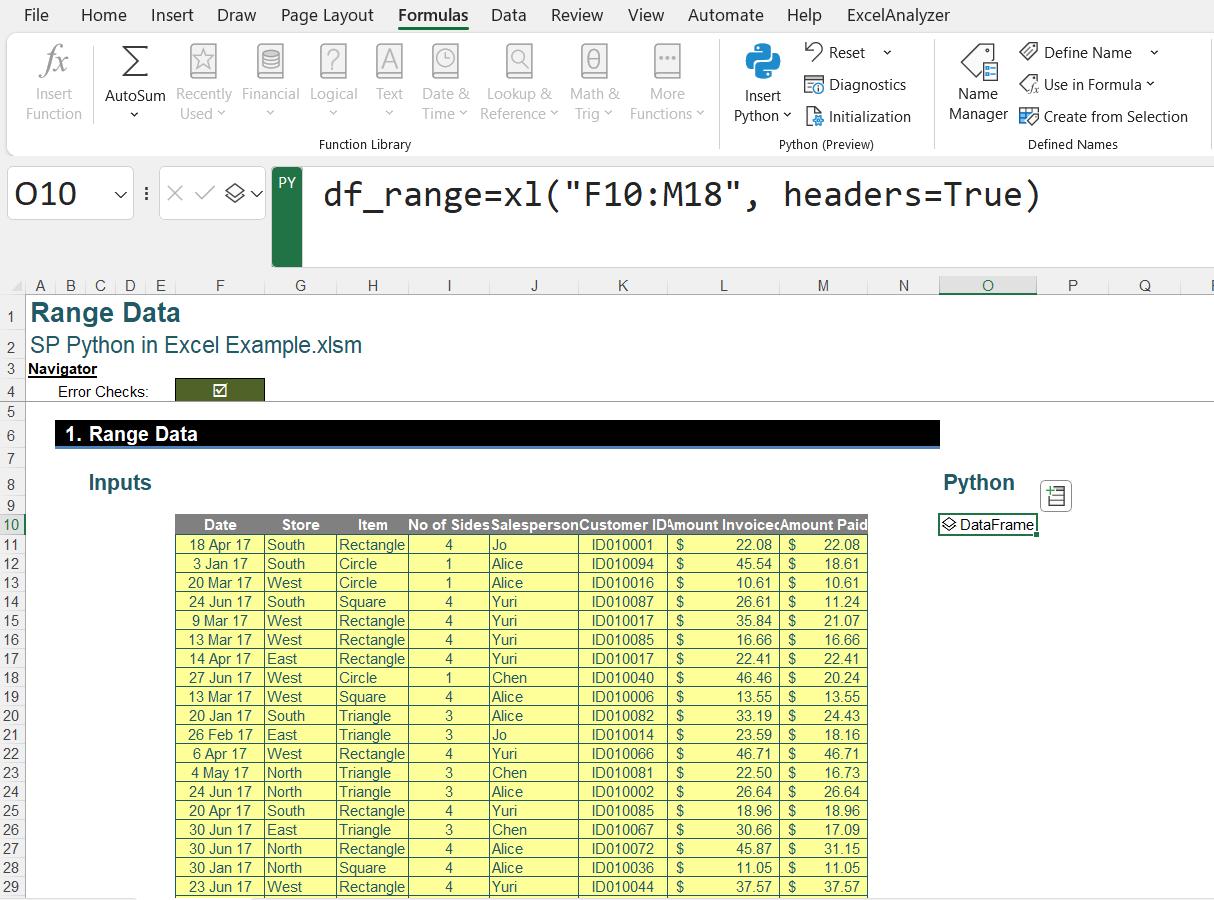
The formula we have used is:
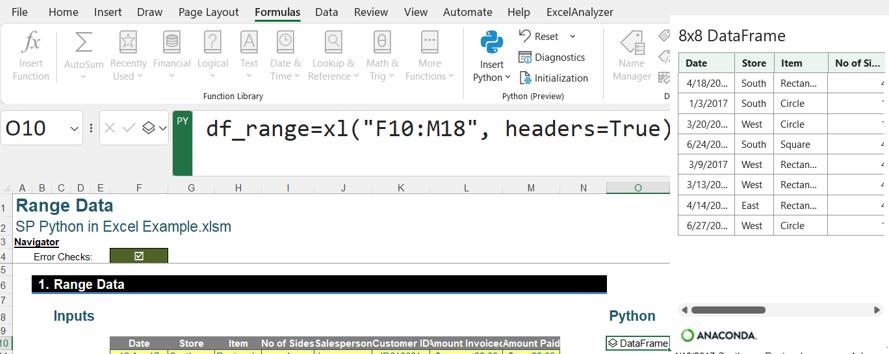
df_range=xl(“F10:M18”, headers=True)
This extracts the data in F10:M18into a DataFrame which we can identify with df_range. Note that for all the examples using speech marks (“”), we must use the straight speech marks in Python. Care should be taken when copying code from fonts using curly speech marks – like here!!
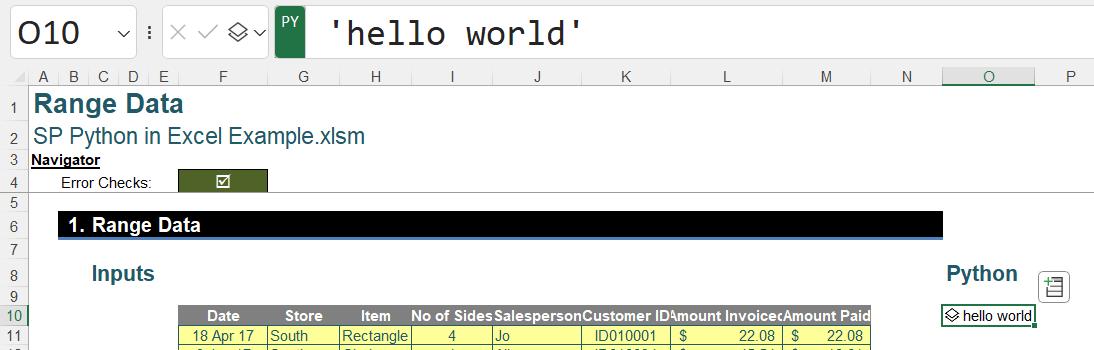
To view the Excel data, we use the dropdown menu to the left of the Python Formula bar:
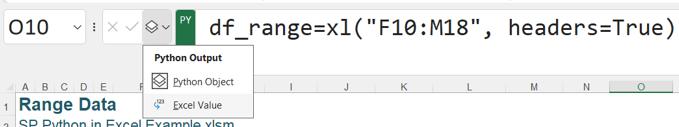
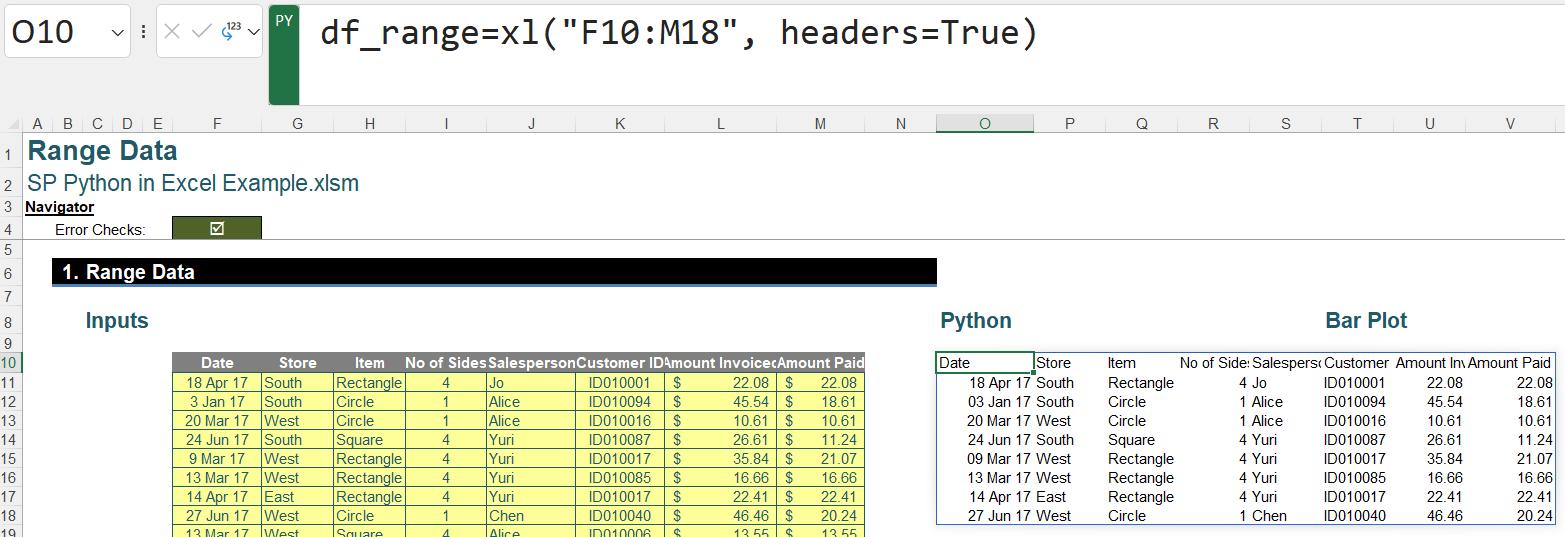
This will then spill the data in the cell. To toggle between these outputs, we can use CTRL+ ALT + SHIFT + M.
Another way to see the Excel data is to click on the cell to access the ‘Insert Data’ icon:
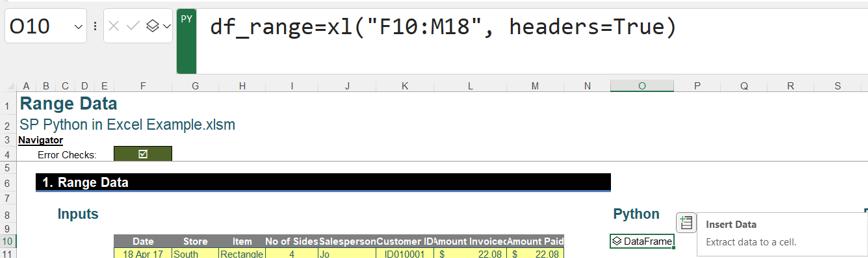
Clicking on the ‘Insert Data’ icon gives us more options:
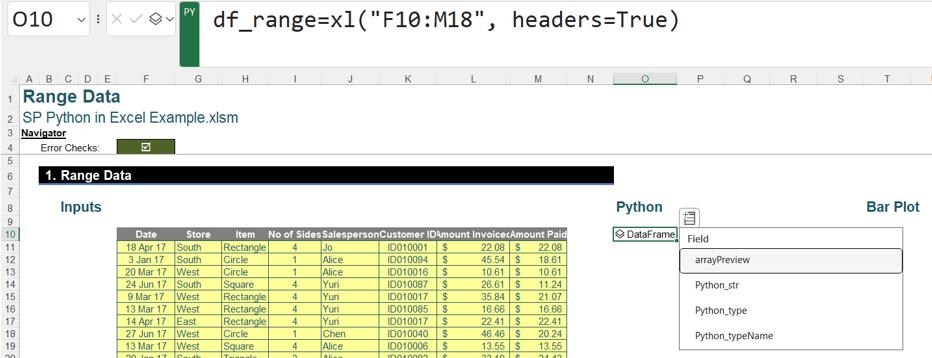
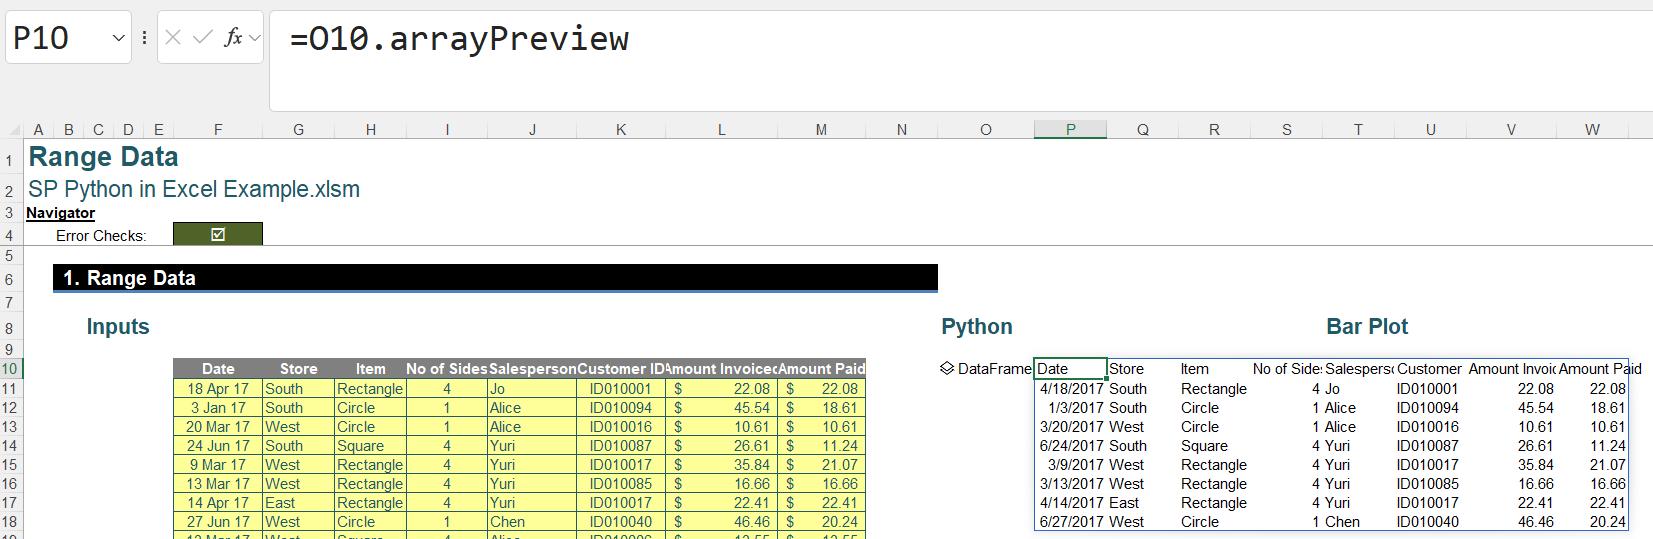
Choosing arrayPreview allows us to insert a preview of the Excel data in the workbook:
If we want to see a temporary preview of the Python DataFrame, we can click on the card icon:
When Python in Excel was first introduced, Python code could only refer to sources to the left or above the DataFrame cell. At the time of writing, no errors occurred for sources to the right or below the DataFrame so this appears to have been resolved.
Python can also read data from an Excel Table:
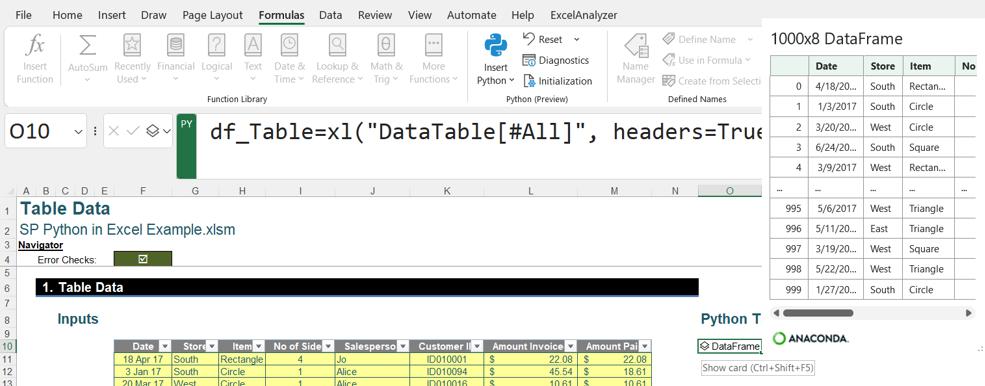
Where the Python formula is:
df_Table=xl(“DataTable[#All]”, headers=True)
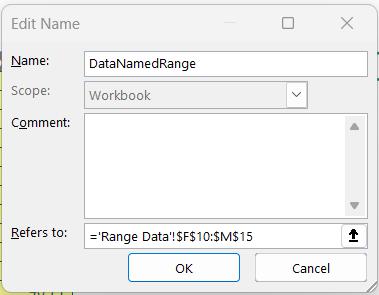
We can read the data from a named range:
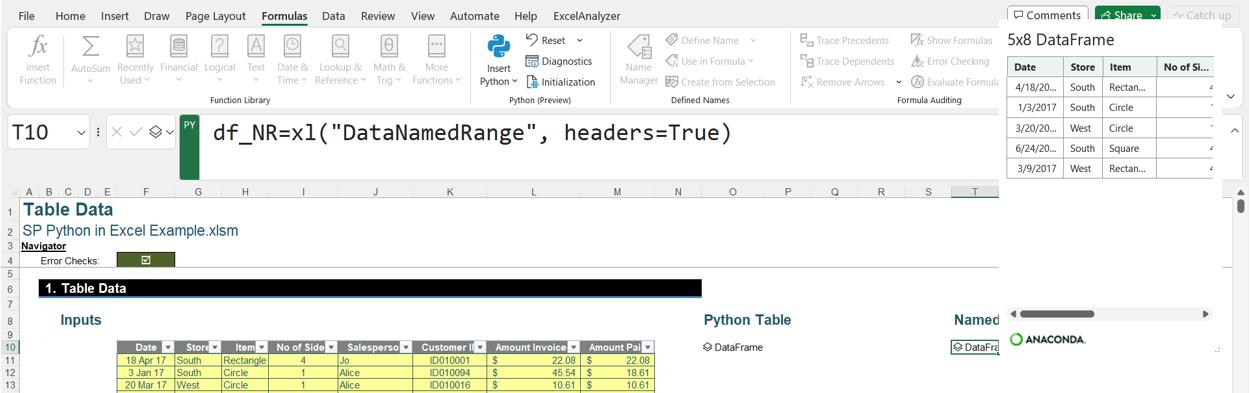
Using the Python formula:
df_NR=xl(“DataNamedRange”, headers=True)
Where our named range is DataNamedRange:
Here, we are using a dynamic array as our source:
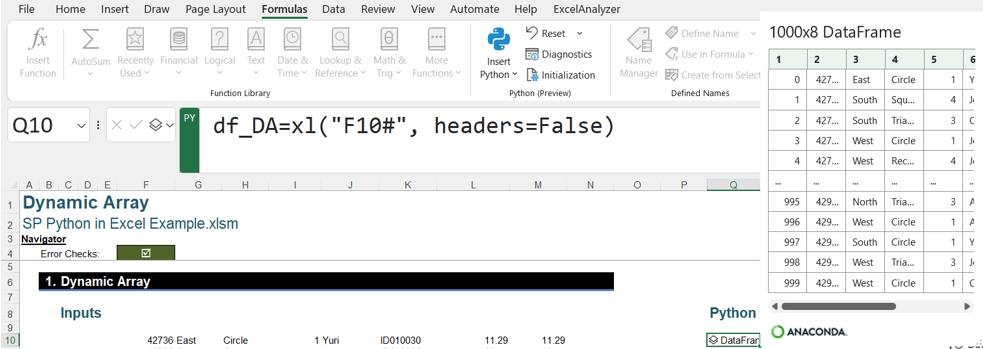
The Python formula here is:
df_DA=xl(“F10#”, headers=False)
Finally, we can use Power Query as the source:
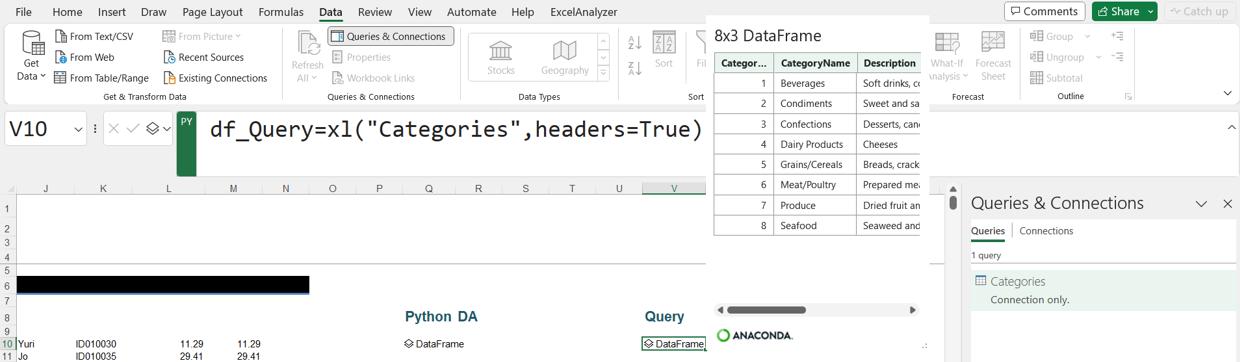
The Python formula here is:
df_Query=xl("Categories",headers=True)
Using queries is the recommended method for accessing external data sources for Python.
We can also reference other Python DataFrames either by using the DataFrame name or the cell location. Here we have used df_Table as the source, and our new DataFrame, df_Item, includes the Item column. Note that since there is only one column, we create a special DataFrame called a Series.
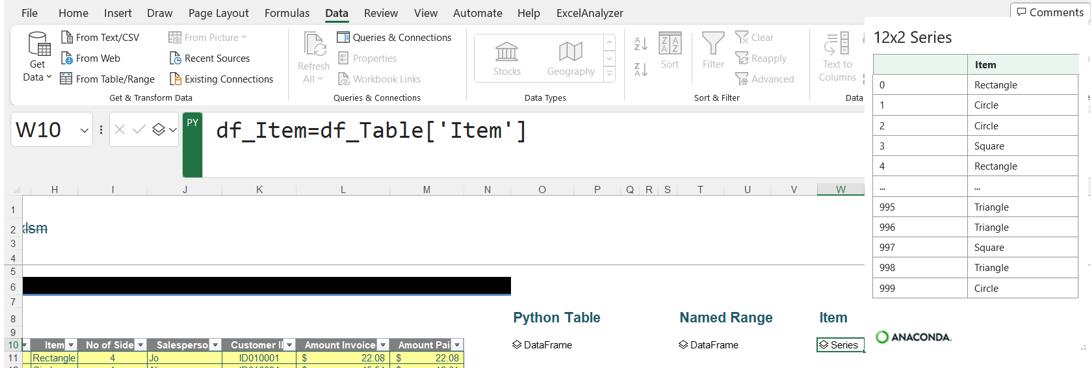
The formula is:
df_Item=df_Table[‘Item’]
or
df_Item=xl(“O10”)[‘Item’]
Note that Python formulas recalculate automatically in row major order when a value used in a Python formula is changed. This means across row 1 from Ato XFD, and then row 2 and so on. If this automation becomes a problem, then it can be controlled from the ‘Calculation Options’ settings in the Formulas tab:
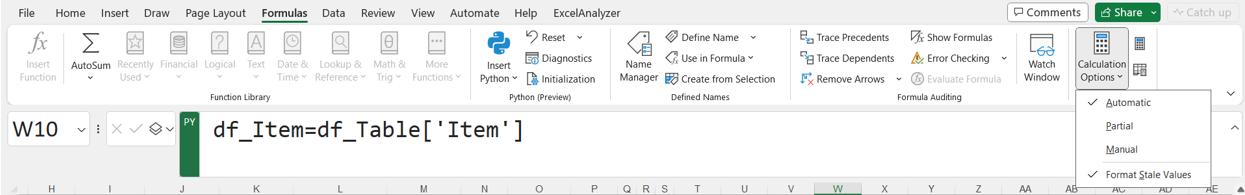
Choosing Partial will currently suspend the automatic calculations for Python and Data Tables.
There are three [3] ways to manually recalculate Python when we have set our workbook to Partial or Manual:
- Use the keyboard shortcut F9
- Go to ‘Calculate Now’ on the Formulas tab
- Go to a cell with a stale value (which can be activated using ‘Format Stale Values’), displayed with strikethrough formatting, and select the error symbol next to that cell. Then select ‘Calculate Now’, as in the previous point.
Of course, we will want to do more than perform simple Python commands on our data. We would need to write a lot of code to develop complex programs. A far more practical way to gain access to useful programs is to import libraries and modules. At the time of writing, since Python in Excel uses Anaconda Distribution for Python, the libraries available are those supported by Anaconda. These include pandas and matplotlib. The Python syntax to install a library is as follows:
import LibraryName as YourName
where LibraryName is the name that Python recognises, and YourName is the name you wish to use to refer to the library.
For example, we may import the pandas and the matplotlib libraries:
import pandas as pand
import matplotlib as mpl
We can include these in the same command. Note that we often only want to include the pyplot module of matplotlib, so we could use:
import pandas as pand
import matplotlib.pyplot as mpl
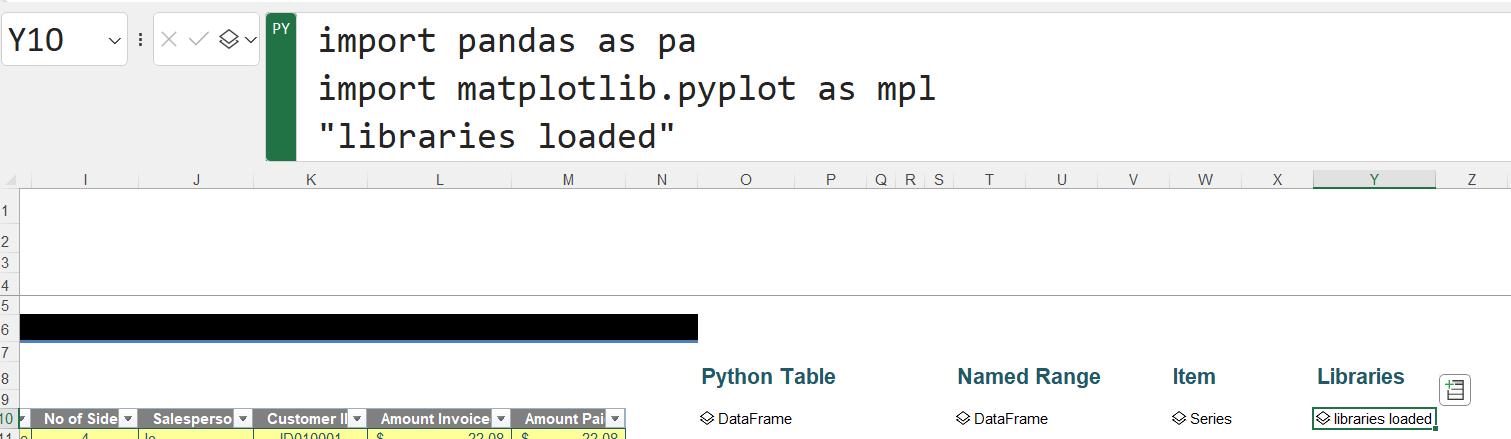
Run like the code above, the cell that the command is run from will be left blank; if we want to see that the libraries have loaded, we can add a line:
import pandas as pa
import matplotlib.pyplot as mpl
“libraries loaded”
The text ‘libraries loaded’ will then appear in the cell:
Having imported the libraries, let’s use them. Pandas will allow us to use the function:
DataFrameName.describe()
to analyse the contents of the DataFrame identified by DataFrameName. As we could for referencing a DataFrame in a second DataFrame, we can either use the name or the cell reference containing the DataFrame.
Here, we are on the Range Data sheet, and we are analysing the DataFrame df_range:
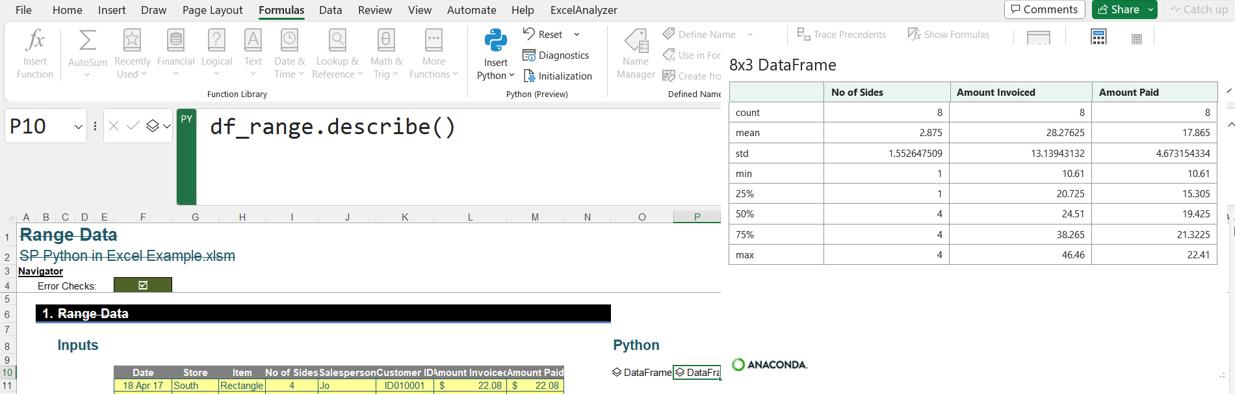
We have used the formula:
df_range.describe()
However, we could have used the formula:
xl(“O10”).describe()
since the cell O10 contains the DataFrame df_range.
Moving on to the functionality available in matplotlib (which we have given the name mpl), we can create a Python chart.
The Python syntax to create a bar plot is :
mpl.bar(df_range[‘Store’], df_range[‘Amount Paid’])
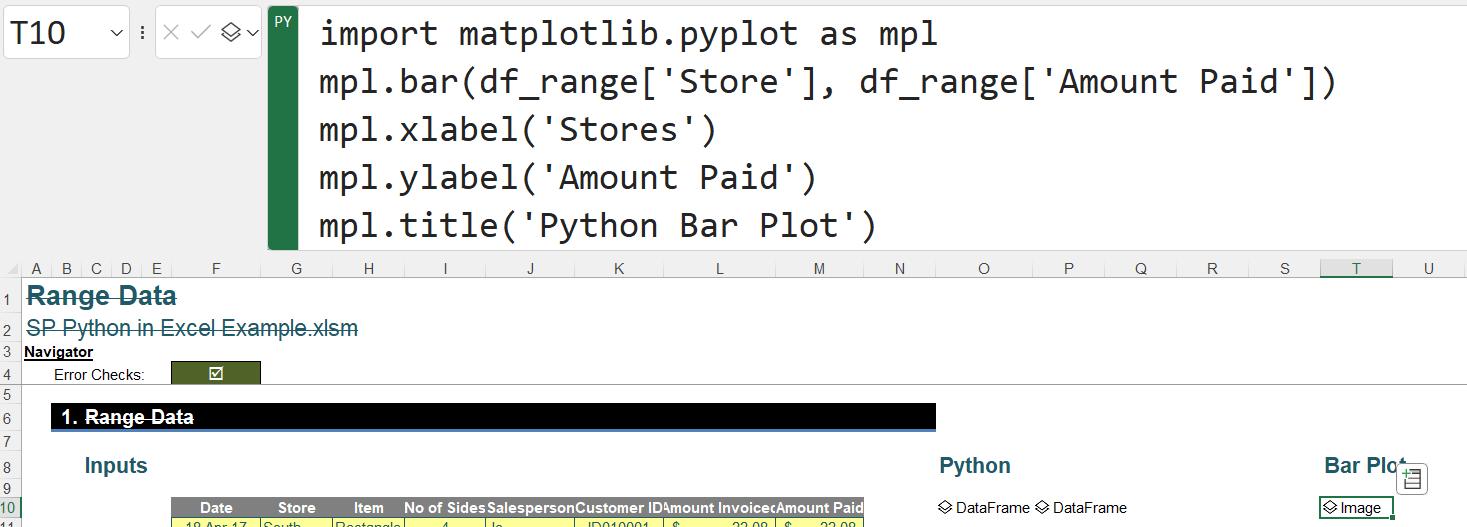
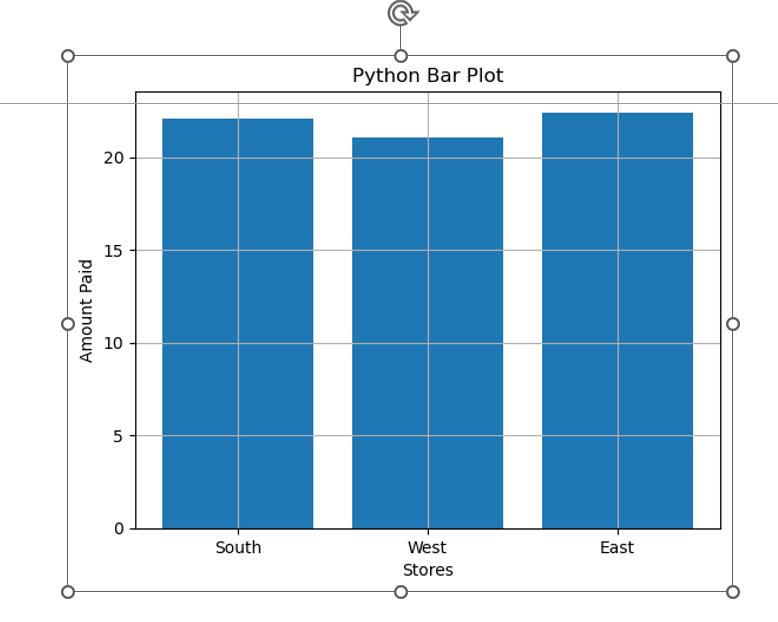
We can then add labels for the axes, a title for the bar plot and include grid lines if we wish, so we can extend the Python code to:
mpl.bar(df_range[‘Store’], df_range[‘Amount Paid’])
mpl.xlabel(‘Stores’)
mpl.ylabel(‘Amount Paid’)
mpl.title(‘Python Bar Plot ’)
mpl.grid(True)
This creates the bar plot in one cell. Instead of a DataFrame, we have an Image object:
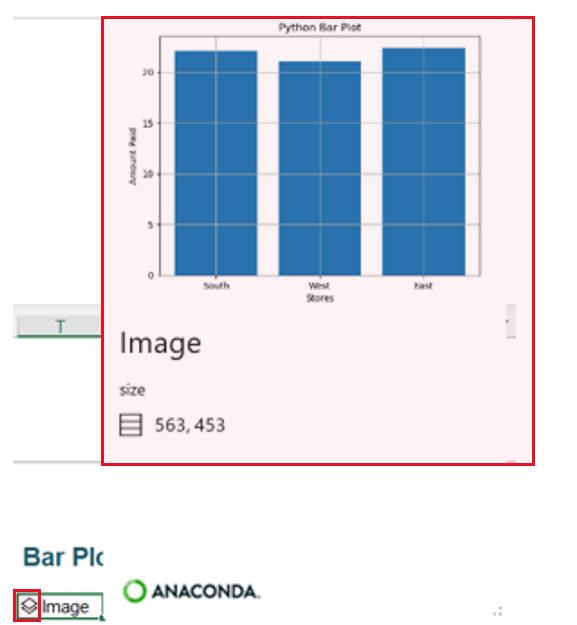
We can view a preview of the Bar plot by clicking on the card icon.
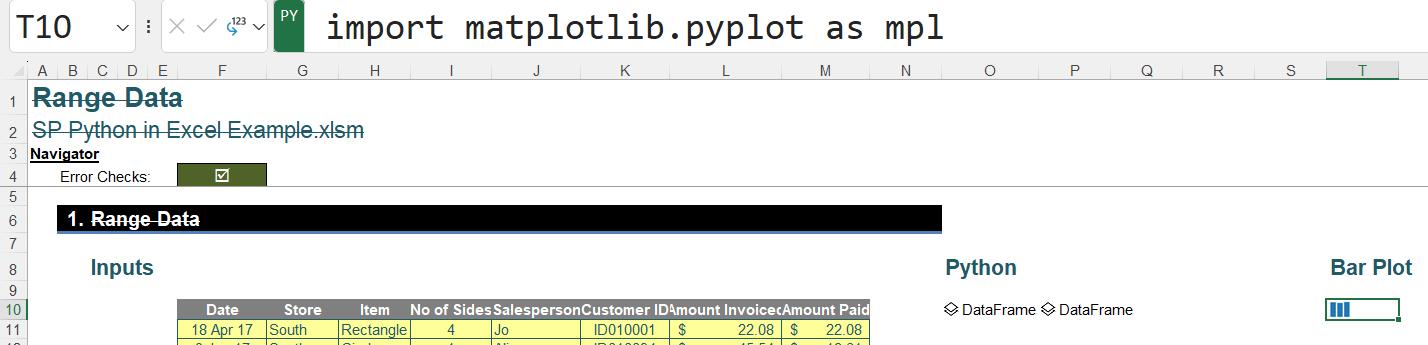
To see the bar plot in the workbook, we can toggle between the Python and Excel output as we did for the DataFrames:
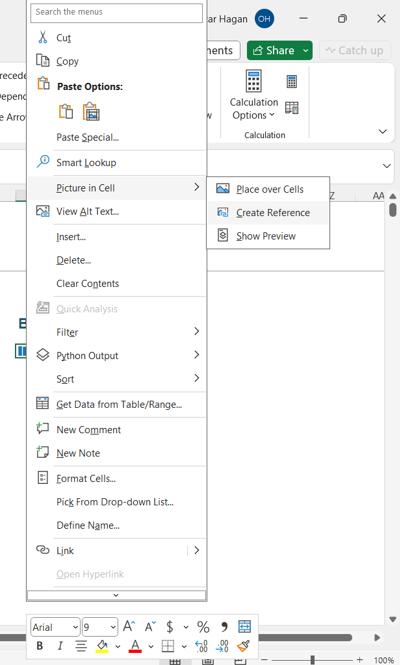
Since we can’t see any detail in a single cell, we could show the chart in merged cells. However, another way to enlarge the image, is by right-clicking on the image, and then selecting the ‘Create Reference’ from the ‘Picture in Cell’ dropdown :
This creates a floating image object. We can select and drag the image to move it to a new position in our worksheet, and then drag the nodes at the corners and sides of the image to resize.
As we are getting to grips with the Python syntax, we may make mistakes, like this one:
df_range.description()
This will return a new error: #PYTHON!
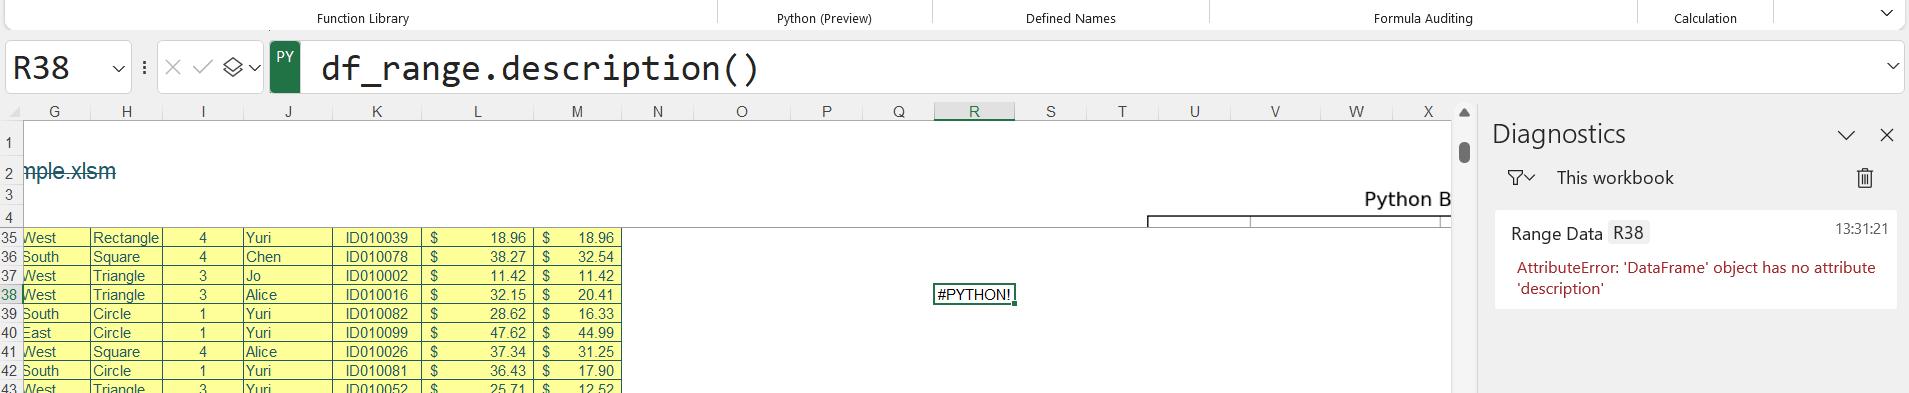
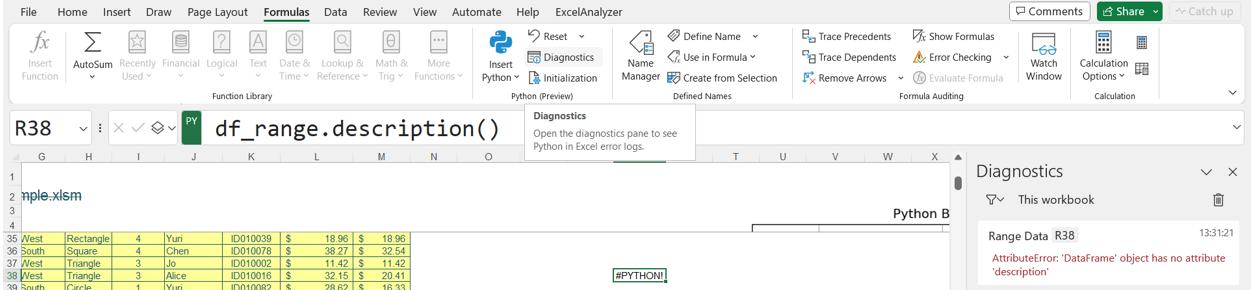
Note that the diagnostics task pane automatically opens if the #PYTHON! error is returned. If we want to open this manually at any time, we can go to a Python cell in the worksheet, open the context menu by right-clicking, and then select ‘Diagnostics’.
These are some of the other common errors that we may encounter:
- #BLOCKED! This can occur if Python in Excel is not available for the user opening a workbook containing Python formulae
- #BUSY! This means Python calculations are running in the Microsoft Cloud. If the #BUSY! error displays for longer a minute, Microsoft recommend resetting the Python runtime. To do this, on the Formulas tab, we select Python and then ‘Reset runtime’ (keyboard shortcut CTRL+ALT+SHIFT+F9)
- #CALC! This will be encountered if we try to run a calculation with more than 100 MB of data
- #CONNECT! This indicates an issue with the communications with the cloud. Follow the same procedure as for the #BUSY! Error
- #SPILL! As for dynamic arrays, this when a cell in the Python output range (when expressed as an Excel value) already contains data
- #UNKNOWN! The #UNKNOWN! error in a Python cell means that the user opening the workbook does not have Python in Excel enabled.
Since Python in Excel is currently only in preview, we can expect to see some changes to the way it behaves. There are, however, some limitations that we should consider.
- Python in Excel runs in the cloud. We can only use Python in Excel when we are connected to the web, as it will not run locally. In addition to potential connection issues, this also means that the data sources are also being sent to the cloud, which is potentially a security risk. This may not be an acceptable risk for all companies
- Python in Excel is free whilst in preview, but according to Microsoft: “While in Preview, Python in Excel will be included with your Microsoft 365 subscription. After the Preview, some functionality will be restricted without a paid license. More details will be available before General Availability”
- Not all Python functionality is accessible. Only libraries supported by Anaconda are available, and Python animated charts are not supported.
In summary, this is an exciting development in Excel, allowing swift and extensive analysis of data. Python is widely used, and since it is open source, we can use and create new packages that add functionality. Python includes advanced charts with excellent graphics which will make telling the story of our data that much easier.