
Charts and Dashboards: Marking Milestones - Part 1
2 July 2021
Welcome back to our Charts and Dashboards blog series. This week, I look at how to plot milestones on a timeline.
John, my favourite imaginary salesperson, has a list of tasks to complete to secure a new contract.
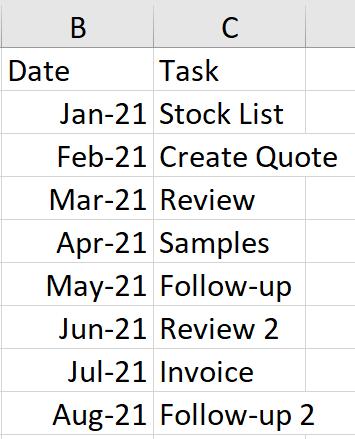
To make it clearer to follow, I am going to create this in milestones on a timeline. I am going to complete this in two blogs. This week I will arrange all my data, and next week I will complete the formatting.
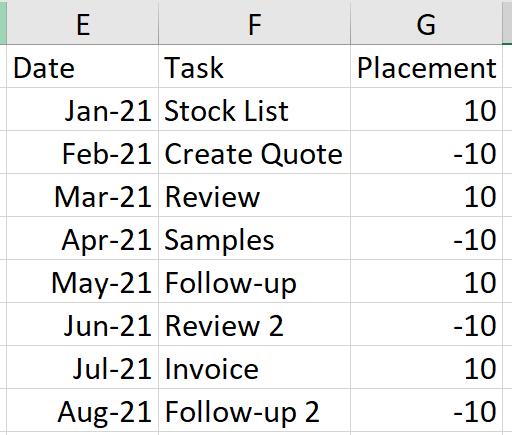
I copy the original data and add a Placement column which will determine if the milestone appears above or below my timeline.
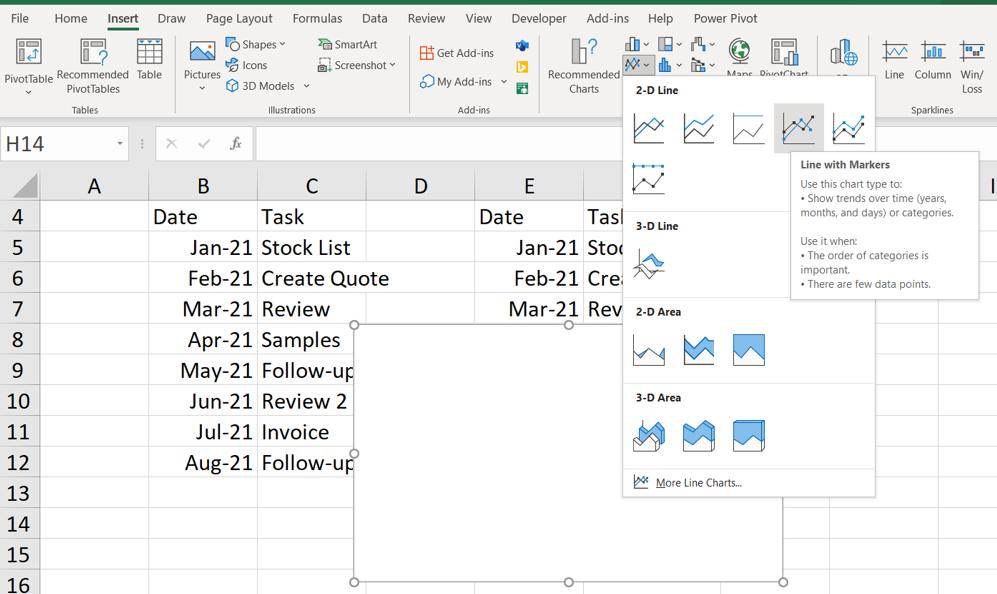
I am going to start by inserting a chart, but I make sure that I am not selecting any data, as I want to be in complete control of what appears in the chart. On the Insert tab, I choose to insert a ‘Line with Markers’ chart.
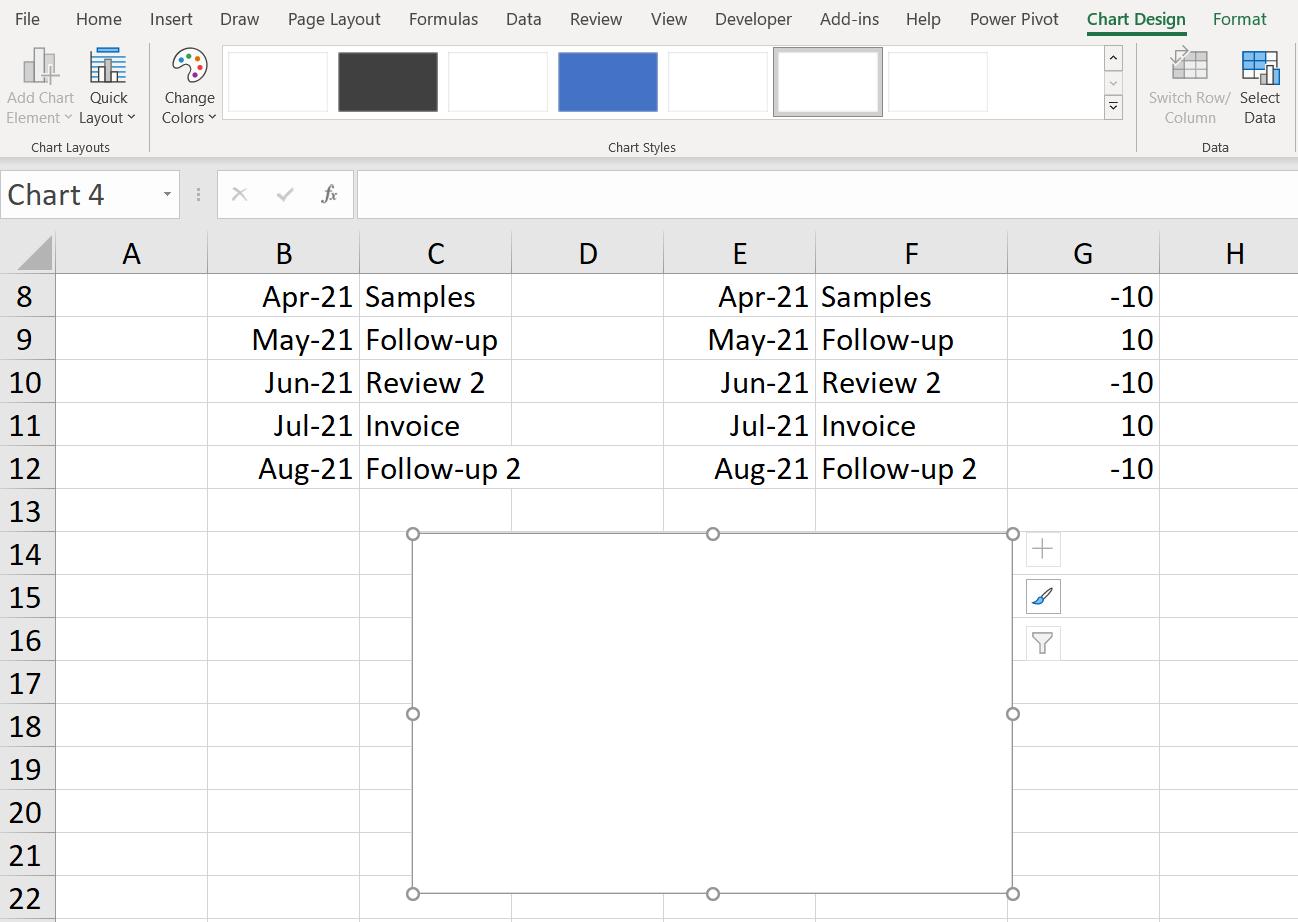
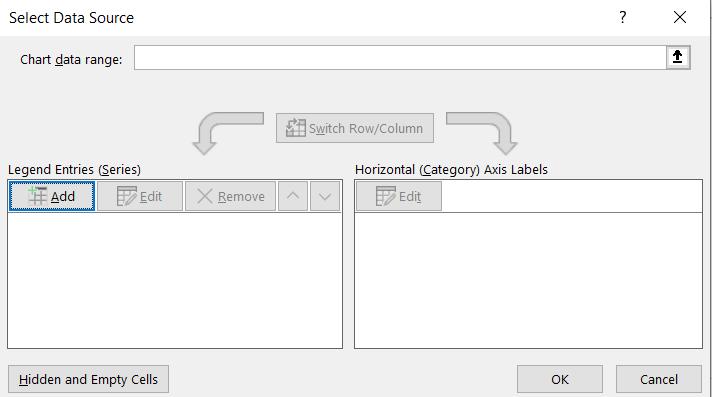
I relocate my blank chart and choose to ‘Select Data’ from the ‘Chart Design’ tab.
In the dialog that appears, I choose to ‘Add a Series’:
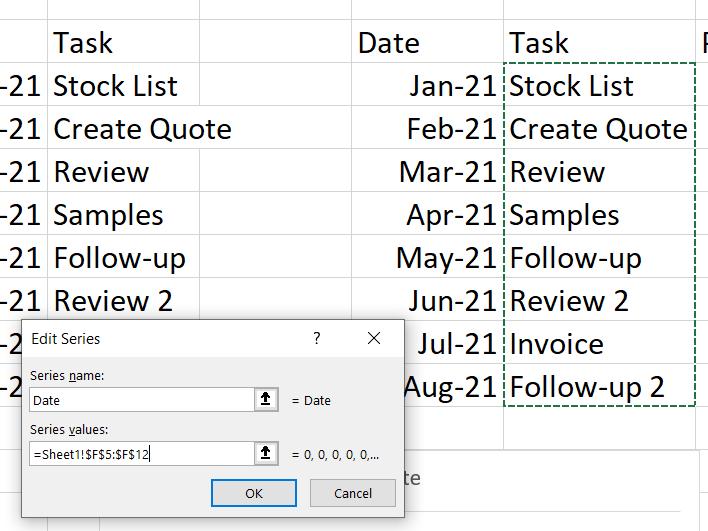
I begin by creating the timeline, so I add a series called Date, which will be linked to the Task cells in column F.
This doesn’t look right yet: I need to Edit the ‘Horizontal (Category) Axis Labels and select the dates in column E.
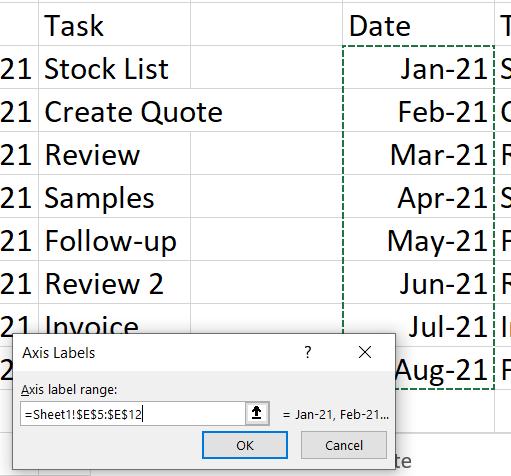
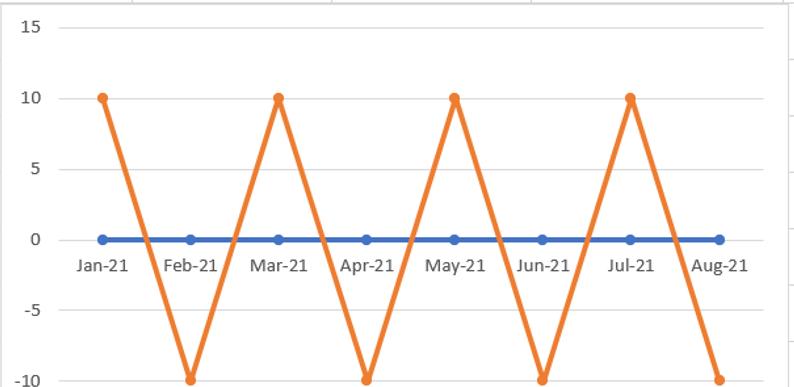
This looks more like a timeline. Now I can add my Task series.
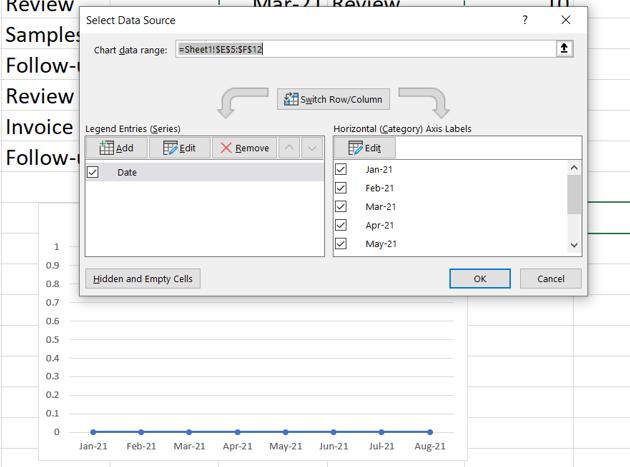
This time I am going to use the Placement column as the values.
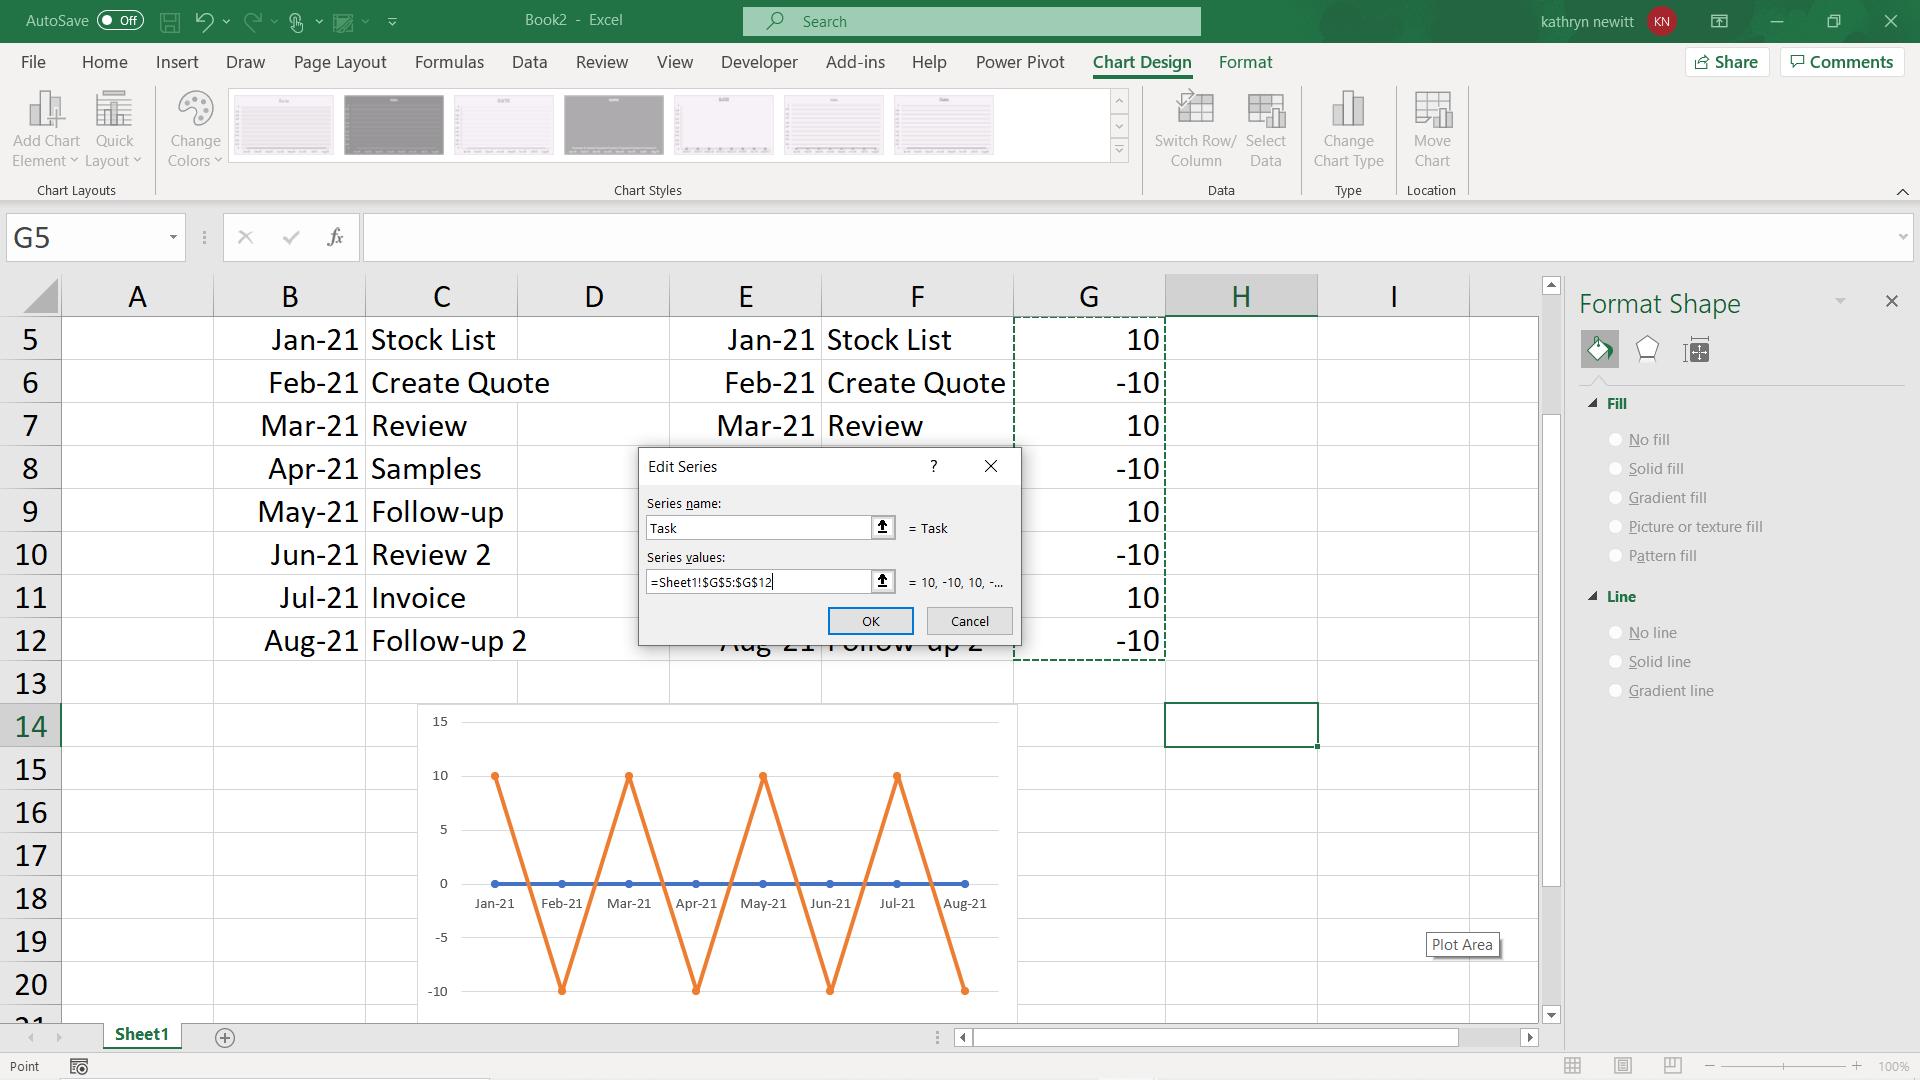
I have the key elements I need, now it’s time to format my chart. Next time I will change this:
To this:
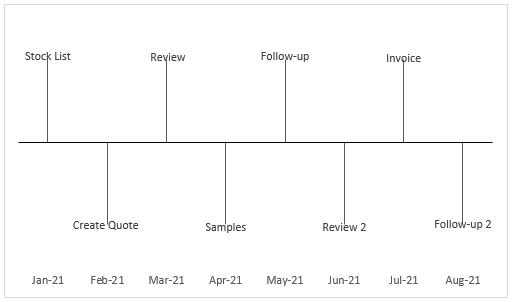
That’s it for this week. Come back next week for more Charts and Dashboards tips.