
Excel for Mac: Create a Forecast Sheet
23 August 2024
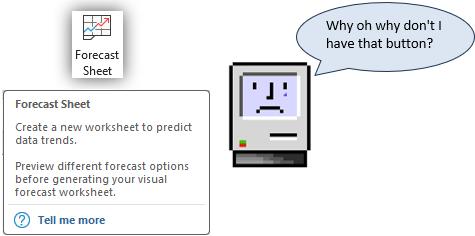
This week in our series about Microsoft Excel for Mac, we show how to create a forecast sheet, even though the ‘Forecast Sheet’ feature isn’t available on Mac.
Forecast Sheet on Windows
First, let’s see how this works on Windows. We’re not trying to make Mac users feel bad, but we want you to know what you’re missing. There are numerous ways you can create a forecast, but we’re going to focus on the ‘Forecast Sheet’ button, since that’s what’s missing on Mac.
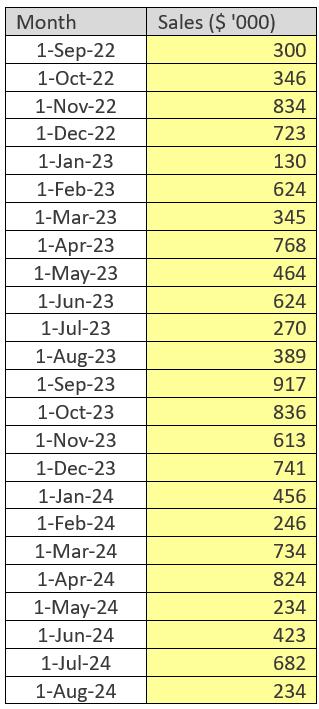
Before you begin, you need to have some data that includes time periods, and a value that you want to forecast, such as the data in the Sales column below. The idea is to use actual data from past time periods so that Excel can help you look at what might happen in the future. The time periods should be consistent. For example, using the 1st of each month as the date will work well. Don’t try to forecast if some time periods are seven [7] days long and some are months for example.
Below is the sales data that we’ll use in our example. Notice that the values in the Month column are actual dates. This will enable the forecast to work well in Excel. If the months were just text, Excel would not be able to calculate the future time periods:
To create a forecast from this data in Excel for Windows, we may follow a simple process.
Select any cell within your range of data and go to the Data tab of the ribbon, and choose ‘Forecast Sheet’, or use the shortcut ALT + A + F + C.
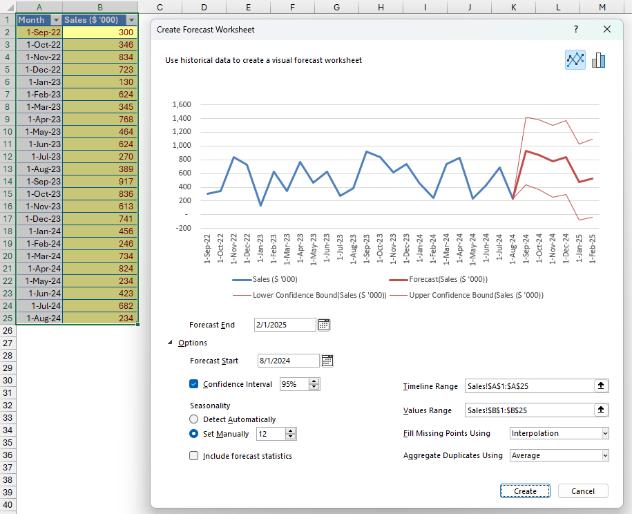
The ‘Forecast Sheet’ wizard will appear, where you can choose a few options and then click OK to complete the process.
- choose what type of chart to create. You have your choice of either a Line chart (default) or a Column chart.
- choose when you want the forecast to end (how far into the future you want to go).
Sometimes this is all you need to do, but often you’ll want to expand the dialog by clicking the Options button to reveal additional choices. Excel will try to automatically populate Seasonality by determining whether there’s a seasonal aspect to your data, but you may want to set this manually. For example, if your time periods are months, you may want to set the Seasonality to 12, corresponding to a year for the seasonality. All the options you see below will end up as arguments in formulae that will be created when you press the Create button.
The following image would occur assuming our Table were to start in cell A1:
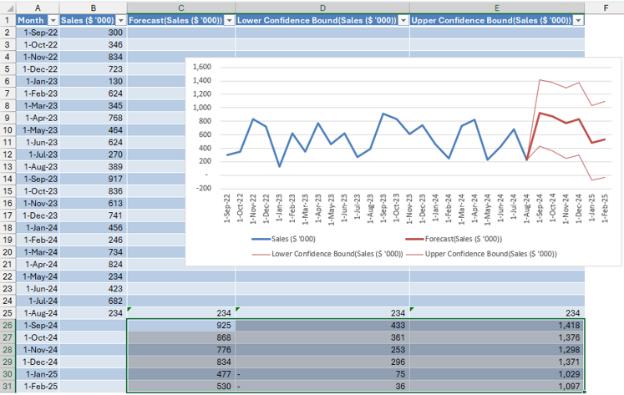
After you press Create, Excel will insert a new sheet with the source data and the forecast data, as well as a chart to visualize the data. Easy! You can see the result in the screenshot below. The table contains a copy of the source data, and the forecast data, which shows the upper and lower confidence bound along with the Sales forecast values. The forecast values are in separate columns, so they can be differentiated in the chart.
How to forecast on Mac
The 'Forecast Sheet' button and wizard makes the process easy, but you can create the same output by using some formulae and adding a chart. We describe the process, using a line chart as the intended output.
Start by inserting a new sheet, and then copy/paste the source time periods and Sales values to the new sheet. Next, turn the data into a Table by pressing CTRL + T (or by selecting Table from the Insert tab). You may then add new columns to hold the Forecast Sales values, and the upper and lower bound values, if needed.
In the Table, go to the row with the final Sales value. Copy the actual Sales value across the row so you have the same value for the forecast and the upper and lower bounds. This will make the forecast data start right at the final actual value on a line chart.
In the column with the time periods, extend the periods down as far as you want for the forecast.
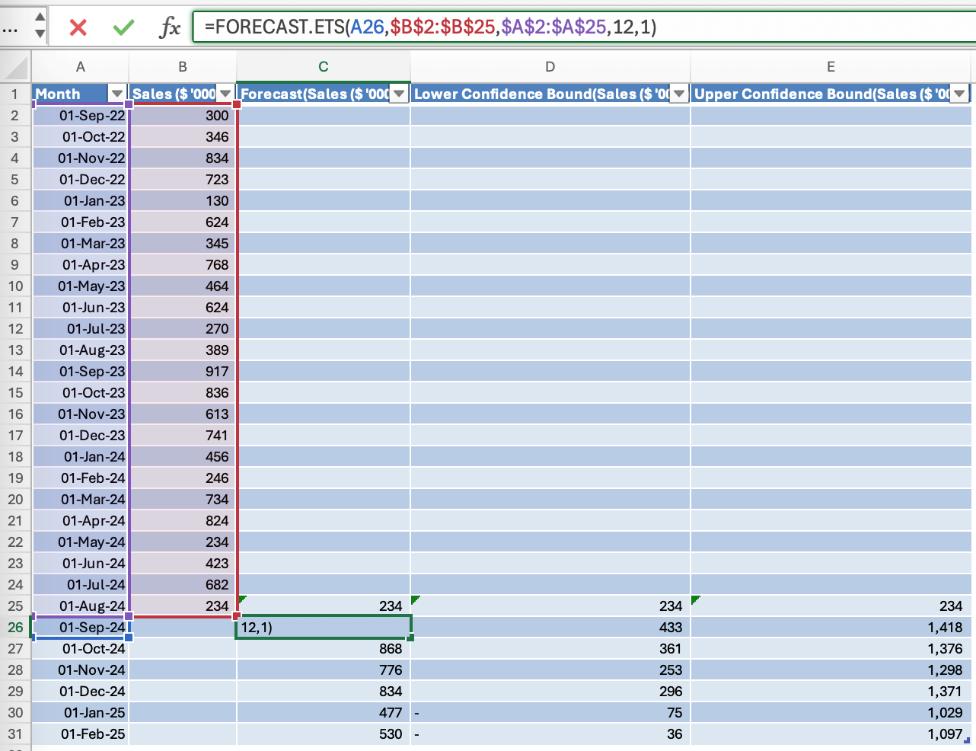
In the Forecast column, you should enter the same formula that would have been created by the wizard on Windows. It uses the FORECAST.ETS() function.
FORECAST.ETS(target_date, values, timeline, [seasonality], [data_completion], [aggregation])
Our formula is:
=FORECAST.ETS(A26,$B$2:$B$25,$A$2:$A$25,12,1)
For target_date, we refer to A26, which is the date of the first period we are forecasting. We refer to $B$2:$B$25 for values, and $A$2:$A$25 for timeline. We use 12 for seasonality, and 1 for data_completion, which tells the function how to handle missing data (emulating the default if the wizard was used).
Now copy the formula down to the last row.
The formulae for the lower and upper confidence bounds are similar, but they use the FORECAST.ETS.CONFINT() function. The main difference is the use of one more parameter, the confidence_level,
FORECAST.ETS.CONFINT(target_date, values, timeline, [confidence_level], [seasonality], [data_completion], [aggregation])
The function calculates the confidence interval for our data, so we need to subtract it from the forecast value in C26 to find the lower bound, and add it to calculate the upper bound. Our formula for the lower confidence bound, with 0.95 as the confidence level is:
=C26-FORECAST.ETS.CONFINT(A26,$B$2:$B$25,$A$2:$A$25,0.95,12,1)
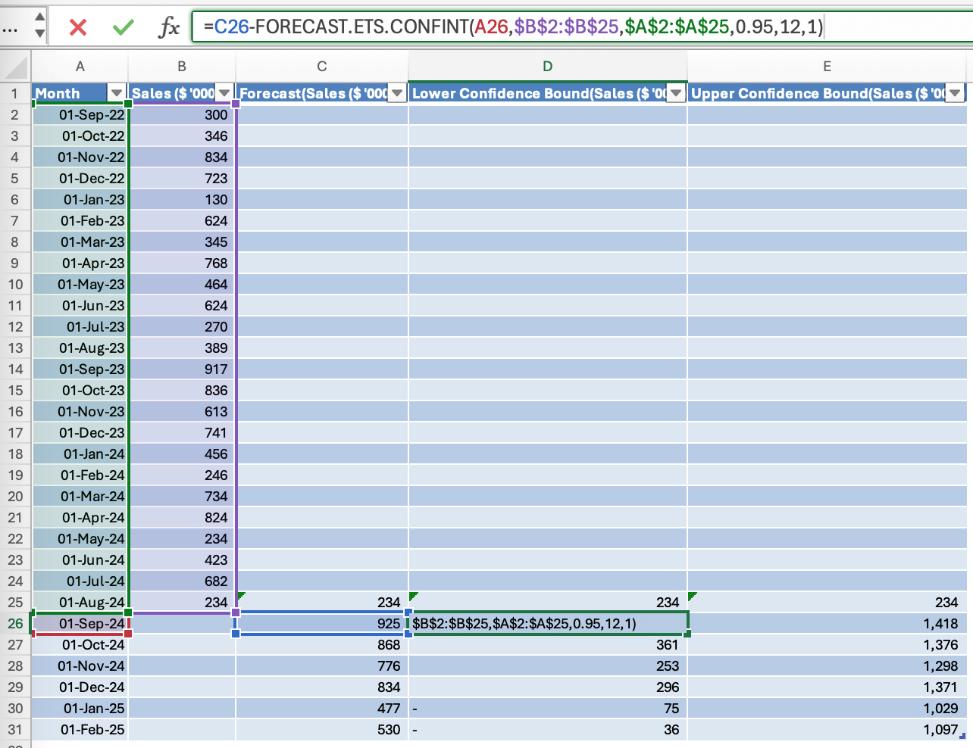
Our formula for the upper confidence bound, with 0.95 as the confidence level is:
=C26+FORECAST.ETS.CONFINT(A26,$B$2:$B$25,$A$2:$A$25,0.95,12,1)
Fill these formulae down to the last row and your data is complete.
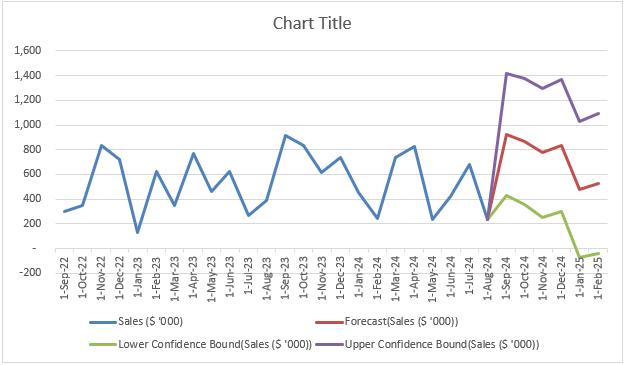
To create the chart, select any cell in the table and choose ‘Recommended Charts’ from the Insert tab. Excel should recommend a chart that’s very similar to the one that the wizard creates on Windows. You may need to do some minor adjustments, like setting the colour and weight for the upper and lower confidence bound lines.
Word to the Wise
If you’re using Excel for Mac, there are often ways to accomplish the same thing you can do in Excel for Windows, even if you think the feature is missing. It might just take some know-how to get there. Don’t give up. Check out our entire blog series for lots of great tips.
We hope you found this topic helpful. Check back for more details about Excel for Mac and how it’s different to Excel for Windows.