
Power BI Blog: Conditional Formatting Support for Visual Calculations
27 March 2025
Welcome back to this week’s edition of the Power BI blog series. This week, we look at conditional formatting support for visual calculation in Power BI.
There is now greater support for conditional formatting. You may now use visual calculations to set up conditional formatting rules for columns and measures on your visuals. Also, you can apply condition formatting rules to visual calculations.
Once you open the ‘Conditional formatting’ dialog, you will notice there is a new section that shows the data that’s on your visual. This section includes any column, measure and visual calculations on your visual and will include any hidden fields as well.
For example, here we have a simple visual that shows sales by quarter using a Total Sales measure and the Fiscal Quarter column. We have added a visual calculation that for each quarter calculates the difference with the first quarter:
VSFirst = [Total Sales] - FIRST( [Total Sales] )
We have hidden the VSFirst calculation, but we will use it to set a conditional background colour for the fiscal quarter. In the ‘Conditional formatting’ dialog, we see the data in this visual section:
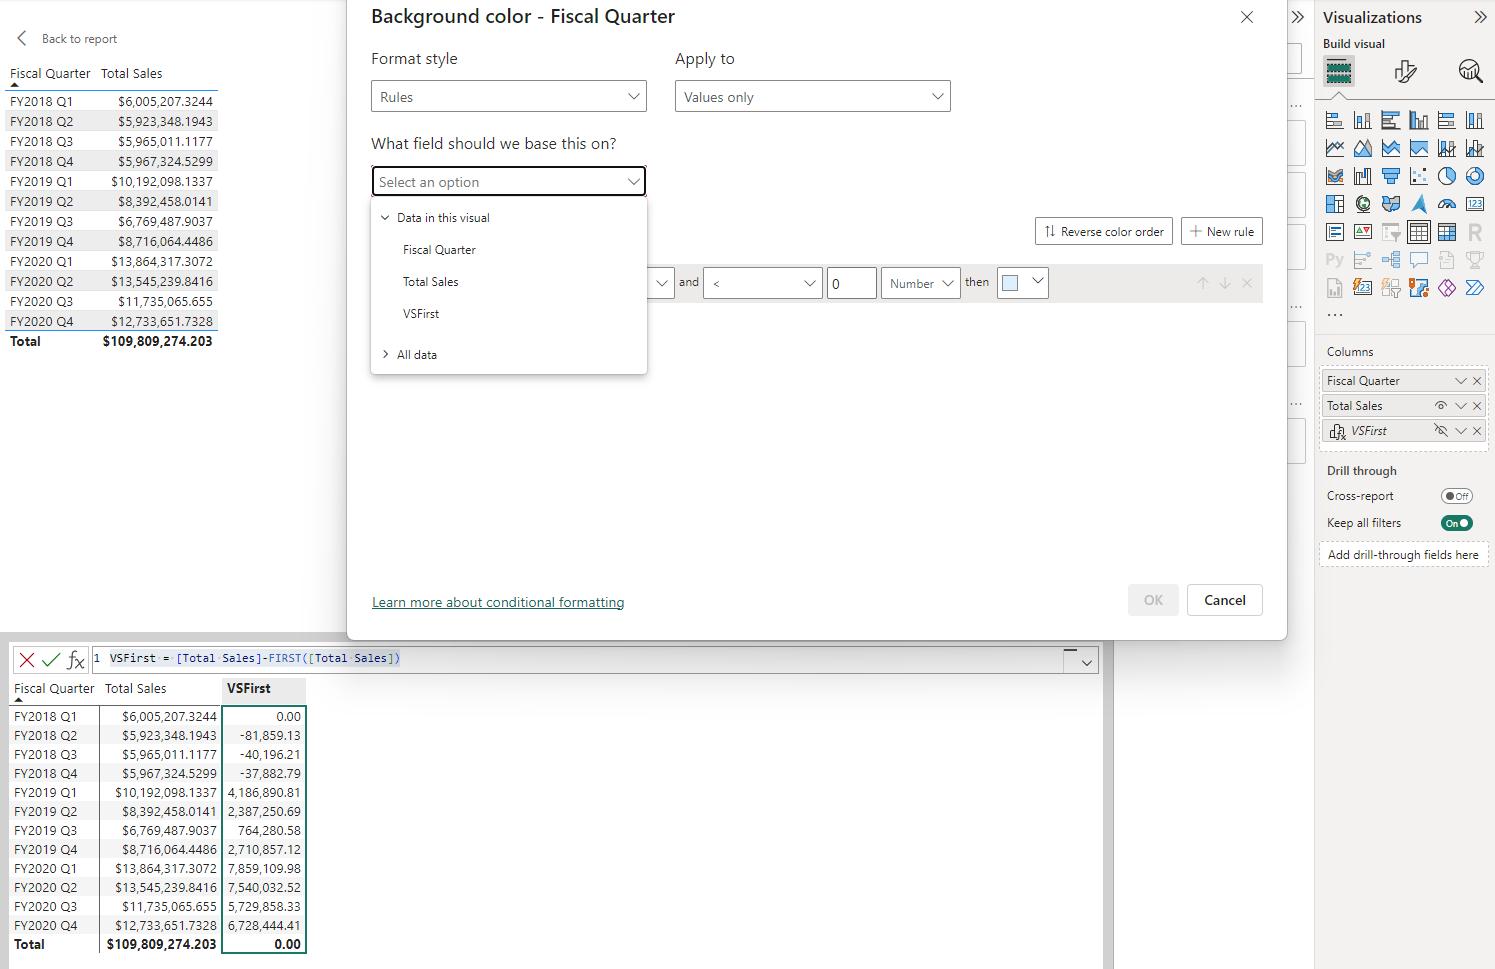
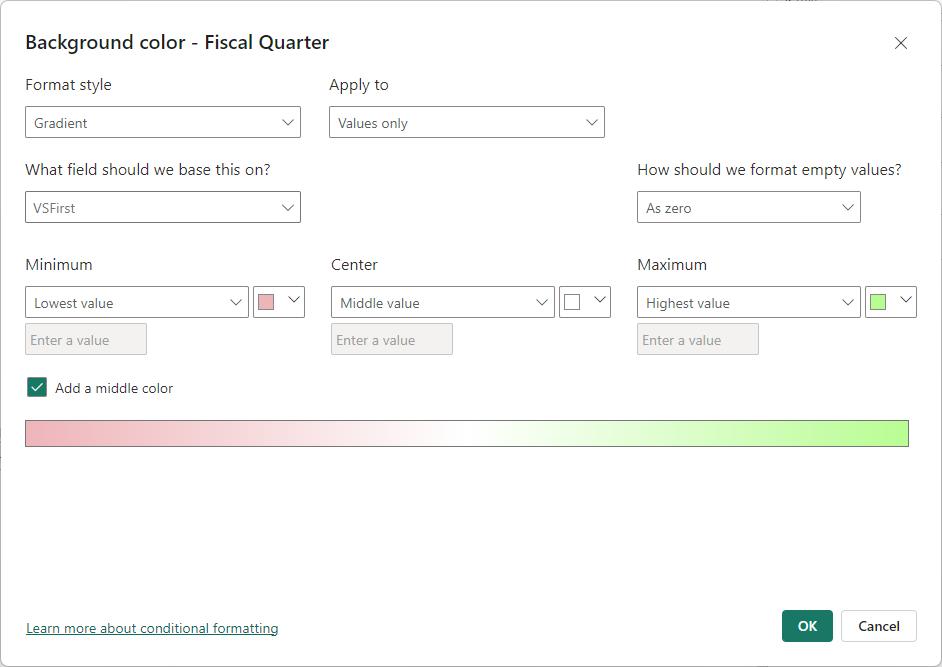
All your model data is still accessible, it is in the ‘All data’ section. Next, select the VSFirst visual calculation and set up the rule as usual:
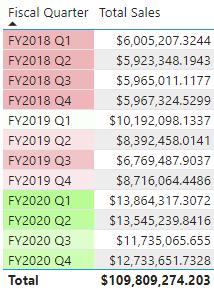
The conditional formatting is applied:
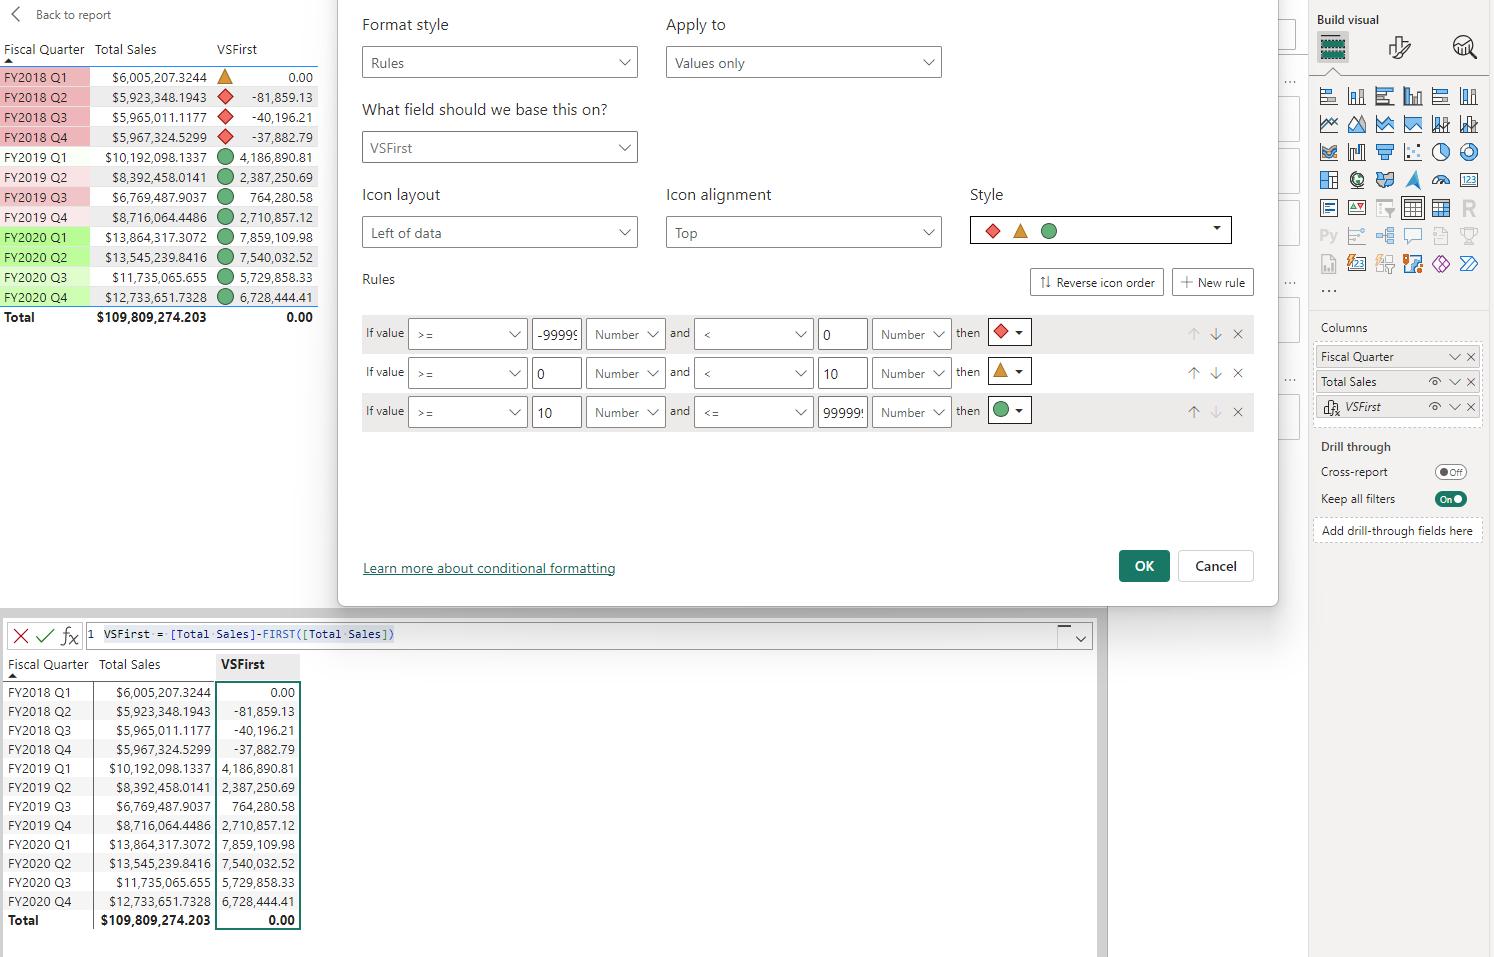
As mentioned, you can also format the visual calculations themselves, as done here with the same visual calculation that was made visible to show the result:
In the meantime, please remember we offer training in Power BI which you can find out more about here. If you wish to catch up on past articles, you can find all of our past Power BI blogs here.