
Power BI Blog: I Want to Tell You a Story
17 April 2025
Welcome back to this week’s edition of the Power BI blog series. This week, we look at the improved storytelling capabilities using data annotations in Power BI for PowerPoint.
You may now make your presentations more engaging by adding data point annotations to the visuals incorporated into their slides.
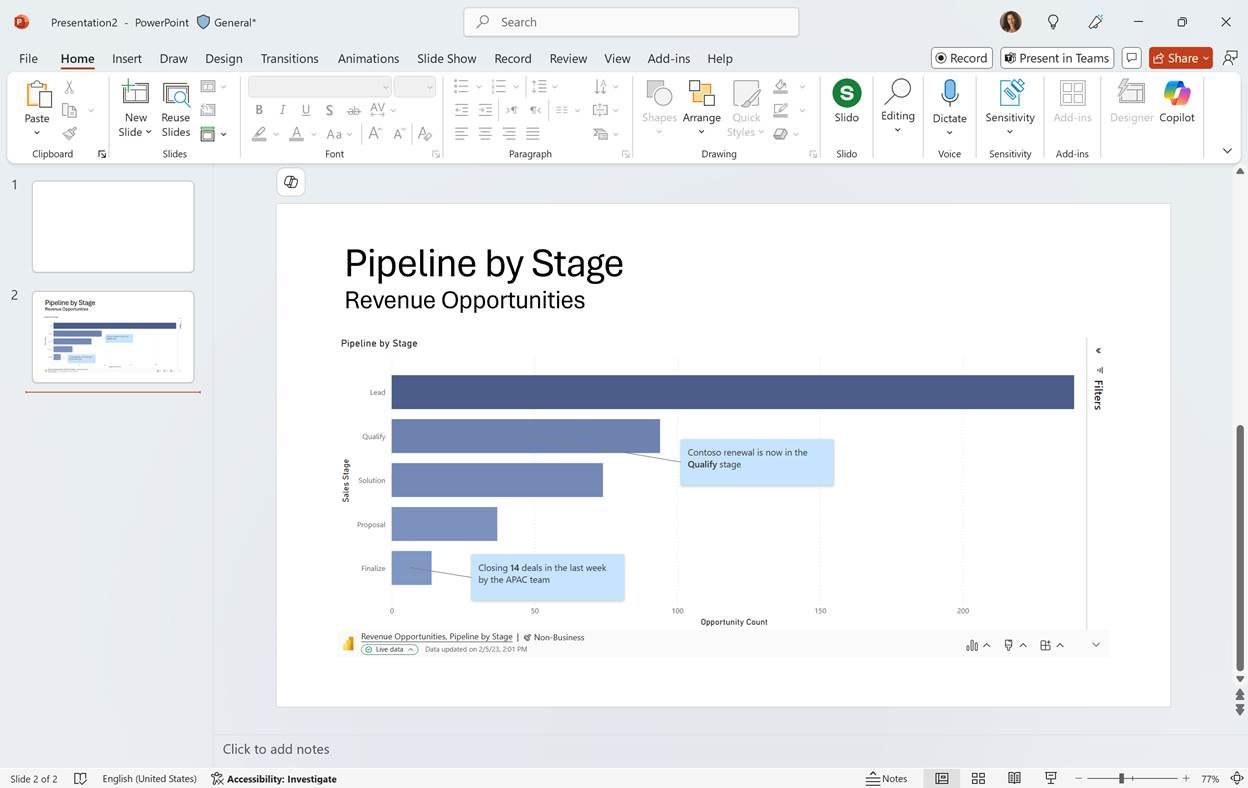
Annotations enable users to add descriptive text directly to visualisations, offering contextual explanations or highlights that improve communication and understanding. This feature transforms data storytelling by allowing users to communicate insights with greater efficacy and enhance the engagement and informativeness of presentations.
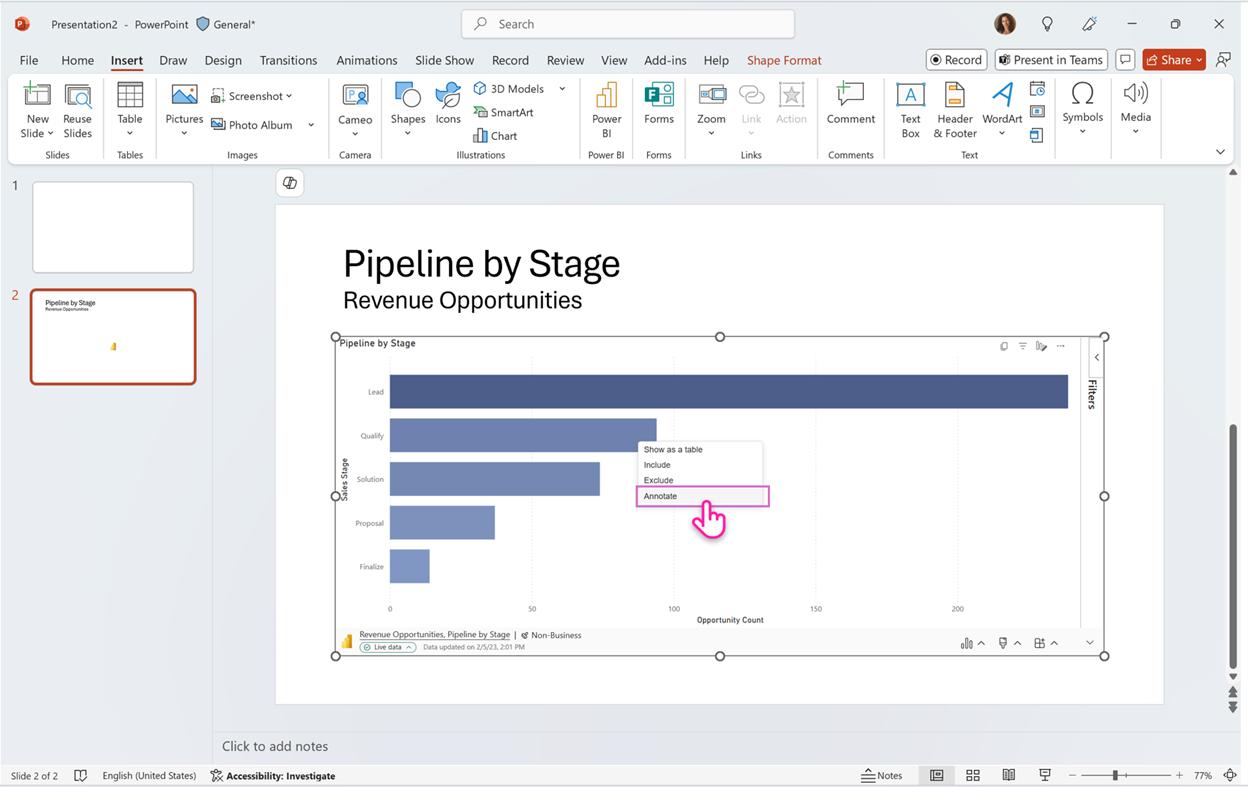
To utilise annotations, you first need to embed a single visual within the add-in in a slide. Then, simply select a data point on the visual, right-click, and choose ‘Annotate’. You can then begin typing your text. You may reference the data point’s measure value and category values in the annotation, ensuring the content is connected to the actual data point. Typing ‘/’ provides options that can be included in the annotation text.
Annotations will display whenever the data point is visible. If the visual is filtered, resulting in the disappearance of the data point, the annotation will likewise disappear. Additionally, if the data updates and the data point is no longer part of the visual, the annotation will not be shown as well.
Annotations are specific to the presentation and slide where the visual was added, allowing you to provide content that is truly in the context of your presentation.
It should be noted:
- Annotations are not supported in custom visuals
- Annotations are supported in all Power BI native Cartesians visuals
- Annotations are available only when embedding a single visual view and not a page view.
In the meantime, please remember we offer training in Power BI which you can find out more about here. If you wish to catch up on past articles, you can find all of our past Power BI blogs here.