
Power BI Blog: Leave a Line
22 July 2021
Welcome back to this week’s edition of the Power BI blog series. This week, we will look at how to leave a blank line in a Matrix visualisation.
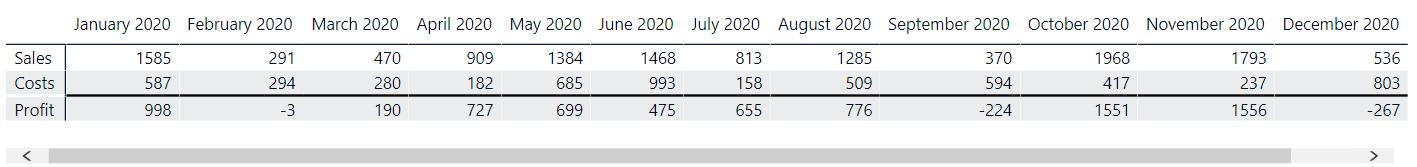
Last week, I had a simple table of accounting data, which I created a Matrix for:
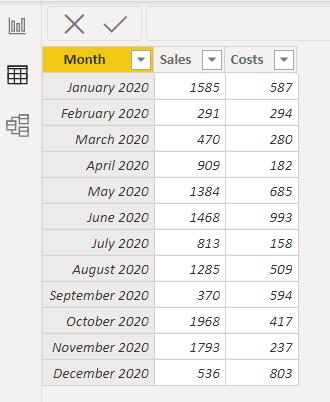
I used a measure which I called asterisk
* = “ “
to create a line in my Matrix.
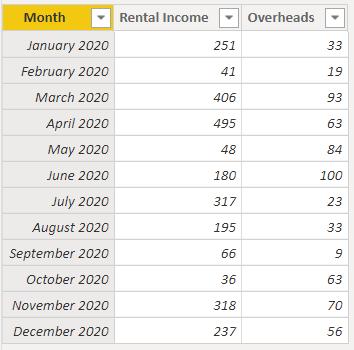
Today, I have imported rental data into a new table called Rent:
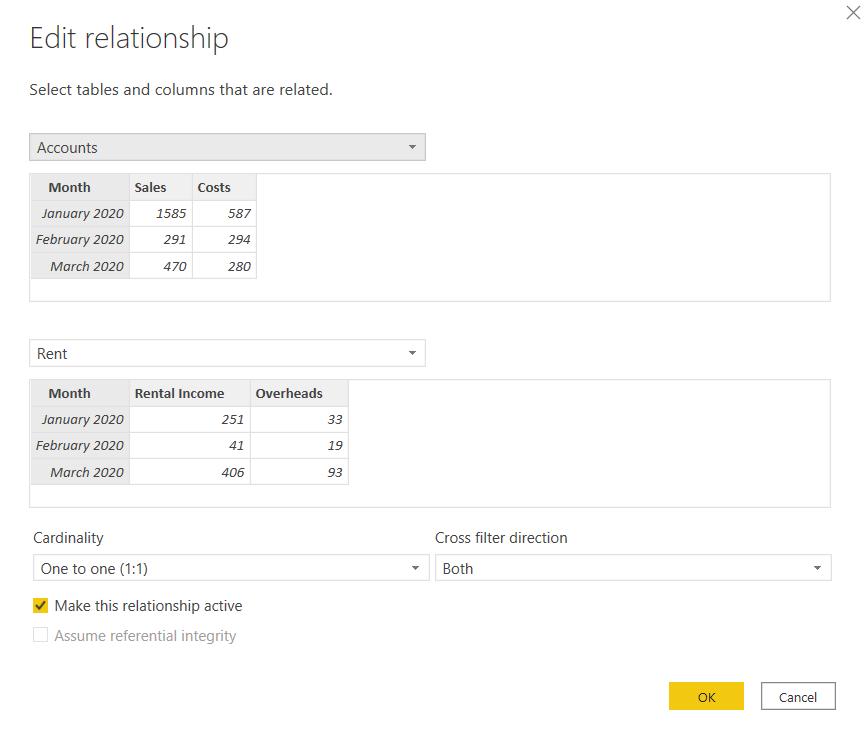
I want to include a calculation based upon this data in the same Matrix I created last week. I have created a relationship between the Rent and Accounts tables:
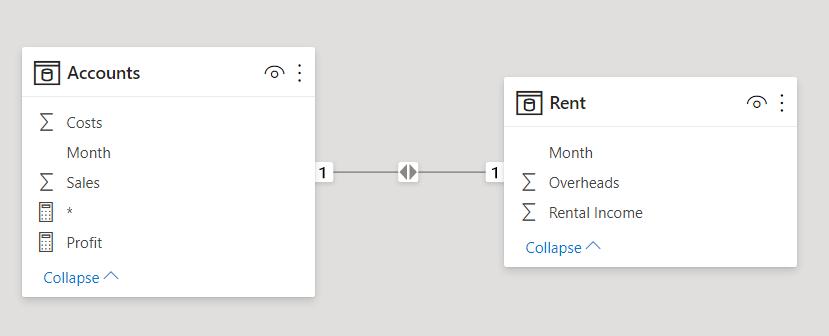
In this very simple example, I can use a 1 to 1 relationship using the Month field.
I can create a new measure to work out the Net Rental Income:
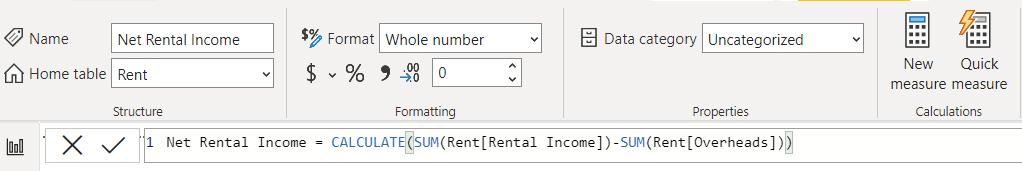
Net Rental Income = CALCULATE(SUM(Rent[Rental Income]) – SUM(Rent[Overheads]))
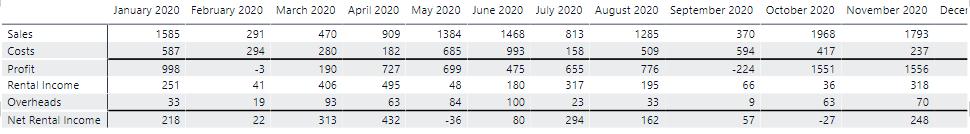
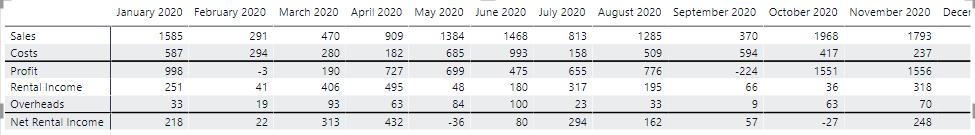
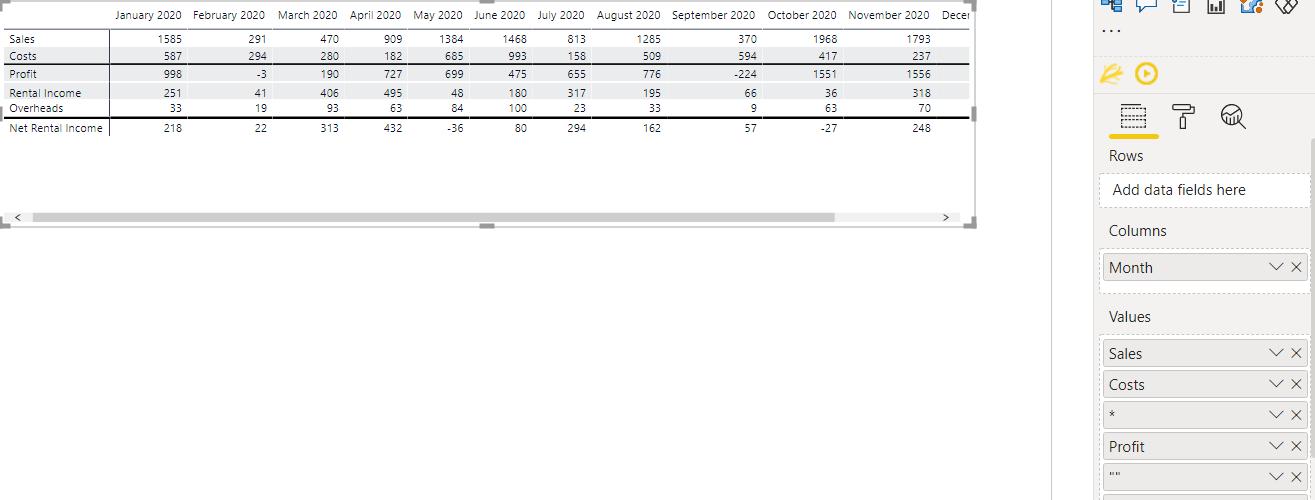
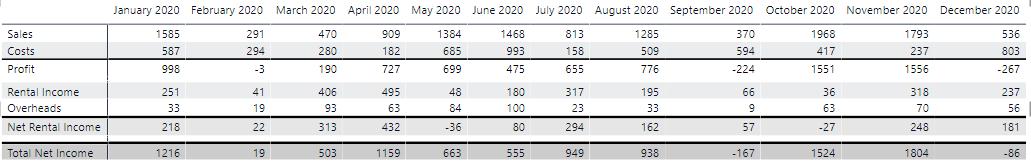
This is very similar to the Profit measure I created last week. Now I can add Rental Income, Overheads and Net Rental Income to my Matrix. I include the asterisk measure before Net Rental Income to insert a line.
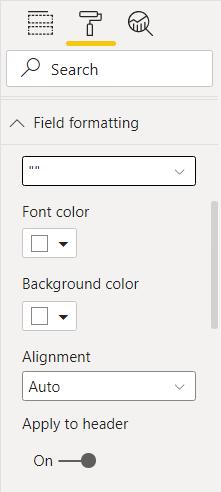
There are a couple of changes I want to make to the formatting. Now I have more lines, I would prefer to see the line all the way across to the row names. I can do this in the Formatting pane in the ‘Field formatting’ section for the asterisk measure.
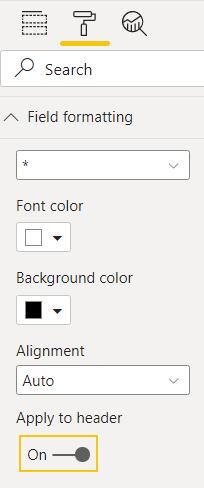
If I toggle ‘Apply to header’ to On, then the line is extended for both occurrences of my asterisk measure:
This is looking better, but I’d like to leave a gap between Profit and Rental Income. I can do this by creating another measure:
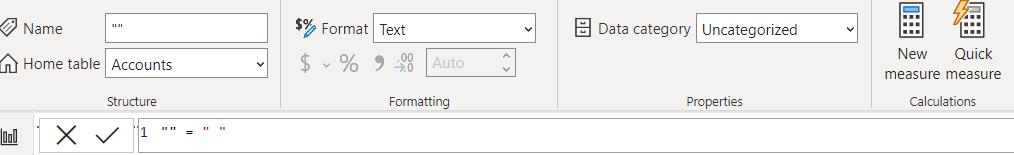
“” = “ “
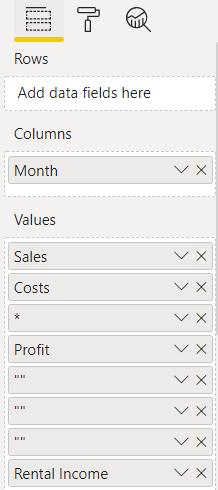
I will refer to this as the blank measure. I add the blank measure to my Matrix.
I have a space, but it’s a bit thin. I can just add more blank measures until I am happy with the gap.
This gives me a gap I am happy with. For this Matrix, I want the font and background colour of the blank measure to be white, but this will depend upon the formatting chosen for each Matrix.
I can now add a Total Net Income measure.
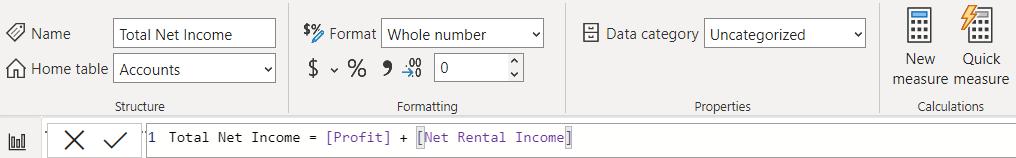
Total Net Income = [Profit] + [Net Rental Income]
I add this to my Matrix and format it with more asterisk and blank measures. I also alter the background in the ‘Field formatting’ section of the Formatting tab for each field to give my Matrix a more balanced appearance.
Check back next week for more Power BI tips and tricks!