Power BI Blog: Data Profiling Generally Available
18 April 2019
Welcome back to the Power BI blog series! This week, we’re going to look at a tool that we’ve covered before, but is now generally available and has some neat improvements.
The Data Profiling feature has been in preview mode for a while, but this month is has just been released in the wild. It also comes with several changes to the way that it operates, providing more information than we’ve seen previously.

Data Profiling requires you to tick off some additional boxes in the Ribbon in the View tab of the Power Query editor.

By choosing “Column quality”, “Column distribution” and “Column profile”, you open up several new panes. We’ve seen quality and distribution before, so today we’ll focus on the new Profiles pane at the bottom of the above image.

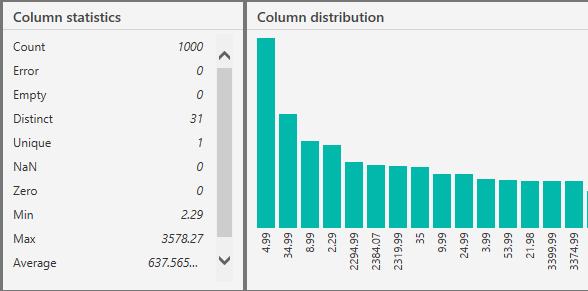
This gives you two more detailed sets of information – statistics around the number of errors, empty cells, valid values, duplicated values and unique values. We also get some descriptive statistics such as Minimum, Maximum, Average and Standard Deviation.
The info on the right is a larger size version of the value distribution histograms at the top, which also allows you to insert further steps into your query by keeping or removing values:


Most importantly, we now have the ability to switch from preview-based data profiles to profiling over the entire table. Use the Status Bar in the bottom left to switch between these:

These features only work if you have defined your data type for your column, so make sure that you clean up any custom columns that you create in order to take advantage of these new tools!

