Power BI Blog: Sydney’s Register of Food Penalty Notices – Part 2
7 November 2019
Welcome back to this week’s Power BI blog series. This week, we are going to look at extracting more information from the NSW Food Authority’s register of penalty notices.
Last week, we ran into a problem where we were trying to retrieve data from an online source, where the data was deliberately organised in such a manner that would make it challenging to collate it into a single table.
As a refresher, we extracted a single table from the following website http://www.foodauthority.nsw.gov.au/penalty-notices/default.aspx?template=results. However, this table contains a column (Penalty notice no.) with links to more information for each row on a separate web page:

Each link points to a page that looks like this:

Our task this week is to come up with a method to extract the data from each page and combine them with each row in our main dataset.
We can use a feature called custom functions in the Power Query engine in Power BI. We have covered Custom Functions before in our Power Query blog here.
When using a custom function, you should first identify whether it is appropriate to use such a function in your dataset. We do this by sifting through our specific dataset to see if the data transformations required in each link are repeatable.
Going through our dataset, we can see that each link always points to a table that contains 12 rows of data. This means that we can use a custom function. This is great news for us and Kieran (who the hell’s Kieran!? – Ed.) the intern who would have had to spend one or two days manually bringing in all of the data.
We then have to define the data transformation steps that the custom function will have to perform, by transforming the data ourselves from the URL. Let’s import this data into our data model.

The data initially comes in organised in a row format:

We want to organise the data into a column format, so that we can combine it with our main table. To do this, we have to transpose the data, ‘Use First Row as Headers’ and rename our query.

Now that we have our data transposed, it is in a format that can be combined with our original data table. The next step is to find a pattern in the URL that will allow us to step through each link:

It looks like we may use the Penalty notice no as the ‘itemId’ in the URL.
Now we can create a custom function out of our query. Click on the Custom Function Query that we created earlier; we are going to make some changes in the Advanced Editor, viz.

We will make the following changes to the code above:
let
IDLink = (WebsiteLink as text) =>
let
Source = Web.Page(Web.Contents("http://www.foodauthority.nsw.gov.au/penalty-notices/default.aspx?template=detail&itemId="&WebsiteLink)),
Data0 = Source{0}[Data],
#"Changed Type" = Table.TransformColumnTypes(Data0,{{"Column1", type text}, {"Column2", type text}}),
#"Transposed Table" = Table.Transpose(#"Changed Type"),
#"Promoted Headers" = Table.PromoteHeaders(#"Transposed Table", [PromoteAllScalars=true]),
#"Changed Type1" = Table.TransformColumnTypes(#"Promoted Headers",{{"Penalty notice number", Int64.Type}, {"Trade name of party served#(cr)#(lf)(or name of place of business)", type text}, {"Address(where offence occurred)", type text}, {"Council#(cr)#(lf)(where offence occurred)", type text}, {"Date of alleged offence(yyyy-mm-dd)", type date}, {"Offence code", type text}, {"Nature & circumstances of alleged offence", type text}, {"Amount of penalty", Currency.Type}, {"Name of party served(with penalty notice)", type text}, {"Date penalty notice served#(cr)#(lf)(yyyy-mm-dd)", type date}, {"Issued by", type text}, {"Notes", type text}})
in
#"Changed Type1"
in
IDLink

IDLink is the name of our function, and in this function, it will accept the WebsiteLink parameter as text. We then alter the URL segment of the code to change along with the WebsiteLink parameter. We will then have to specify what values to input as the WebsiteLink parameter later. After completing the changes click on ‘Done’.
The query will now have the ‘fx’ icon appear next to it, indicating that it is now a function.

Now navigate back to our “Penalty Register (Load)” query, be sure that Penalty notice no column is set as ‘text’. Then, click on the ‘Add Column’ tab on the Ribbon, and select the ‘Invoke Custom Function’ option:

We call this column ‘Step’ since it is just a step towards extracting our data. The function query is the Custom Function Query that we created earlier. We specify that the WebsiteLink parameter should use the Penalty notice no. from the table, and then click OK.
This will create a new column in our query, where we click on the outward arrow icon:

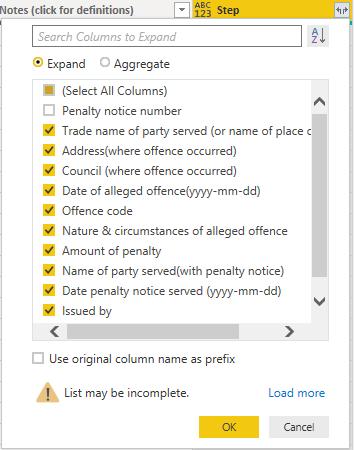
This will bring a drop-down list of all the columns that will be brought in. We do not want the Penalty notice number (bringing this column in again would create a duplicate) and we want to unselect the ‘Use original column name as prefix’ option too.

Then, we have successfully imported the additional columns into our table – just remember to set the data types accordingly.

That’s it for this week! Check back in seven days when we talk about how to bring all of this information into the Map visualisation.
In the meantime, please remember we offer training in Power BI which you can find out more about here. If you wish to catch up on past articles, you can find all of our past Power BI blogs here.

