
Power Query: Heading Off – Part 1
14 February 2024
Welcome to our Power Query blog. Today, I begin to look at an issue that occurs when I load to a Table with no headers.
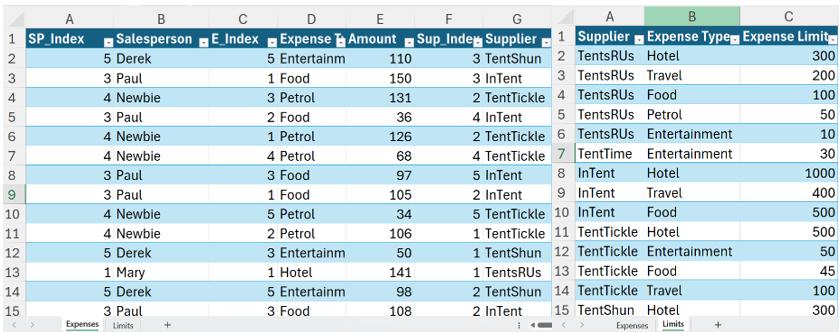
I plan to show a particular issue with Power Query and Tables without headers. However, first I need to create the scenario, and I will show a few methods and tips along the way. I have two Tables of data:
- contains my salespeople’s expenses (Expenses)
- determines the expenses that will be covered by each supplier (Supplier_Limit).
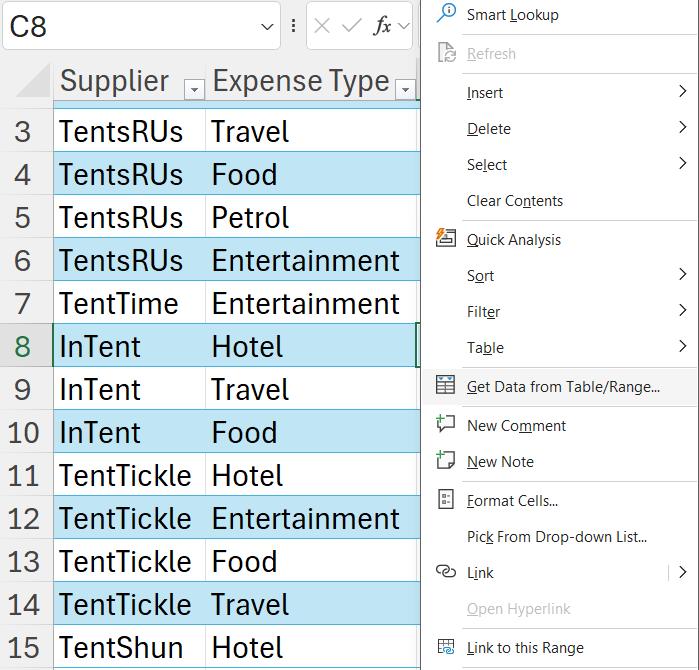
I extract Supplier_Limit, by clicking somewhere in the Table, and right-clicking to ‘Get Data from Table/Range’.
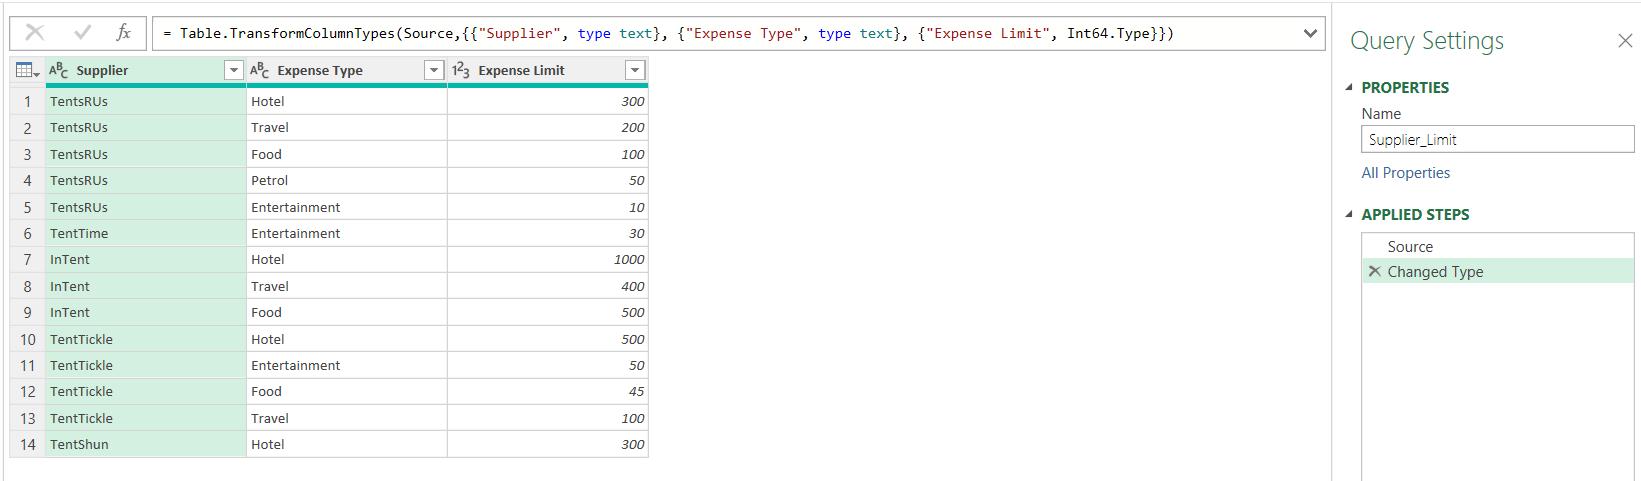
This gives me a query called Supplier_Limit:
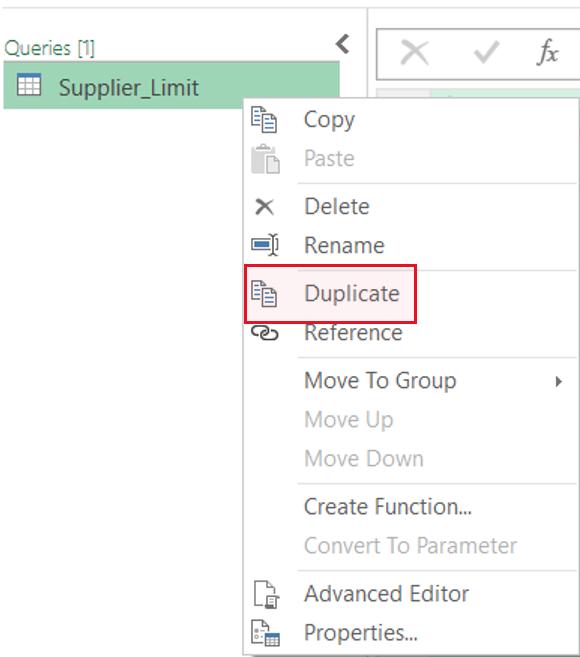
I could load this query as a connection only and go back and get the other data in the same way, but there is another method I could use without leaving the Power Query editor. I make a duplicate copy of Supplier_Limit:
I delete the ‘Changed Type’ step because it uses the column names, and look at the M code in the Source step:
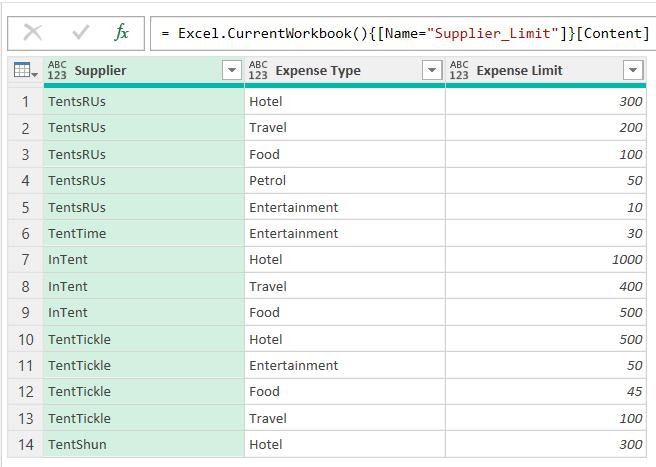
I may use the current M code:
= Excel.CurrentWorkbook(){[Name="Supplier_Limit"]}[Content]
and change the Table name from Supplier_Limit to Expenses:
= Excel.CurrentWorkbook(){[Name="Expenses"]}[Content]
This gives me the contents of the Expenses Table, and automatically recreates the ‘Changed Type’ step:
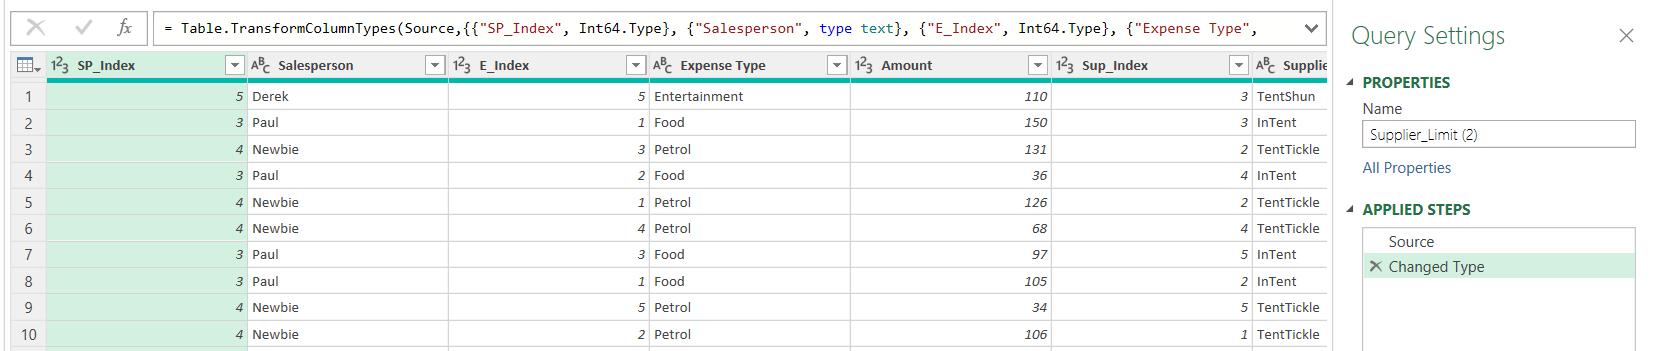
I rename this query Expenses.
Before I can compare this date to the limits, I need to group by Supplier and Expense Type. I can do this using the ‘Group By’ functionality on the Home tab:
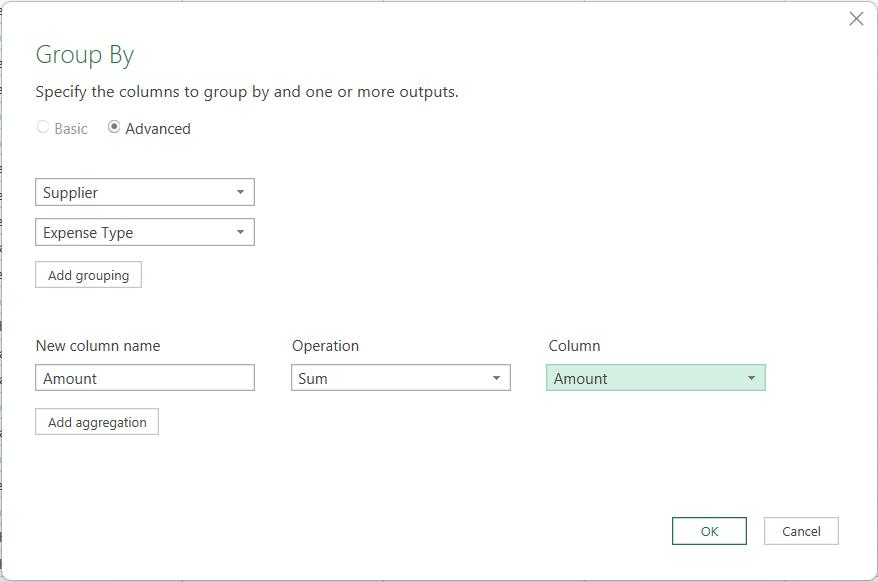
Using Advanced mode, I have chosen Supplier, and then used ‘Add grouping’ to also group by Expense Type. I have chosen to aggregate Amount, by using the Sum Operation.
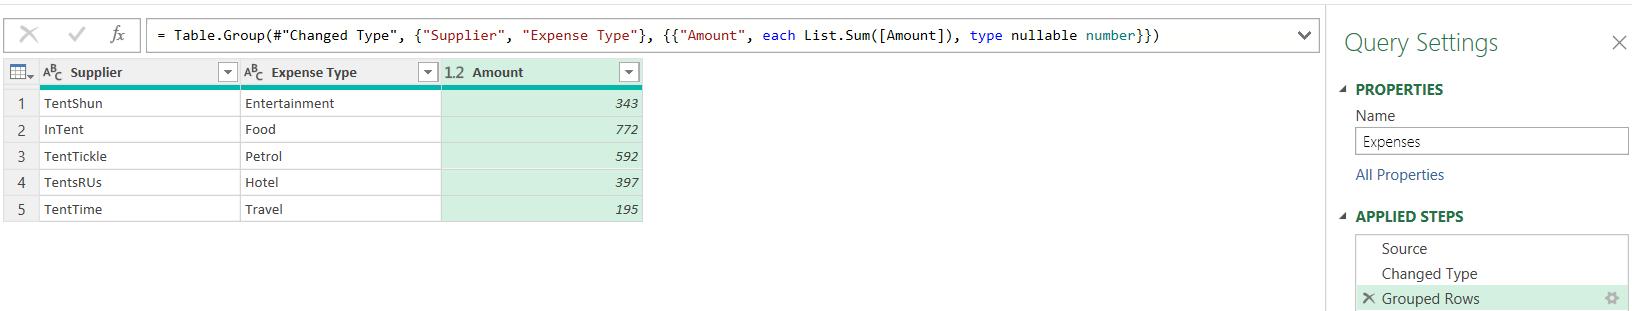
The data is now in a similar format to the Supplier_Limit query.
Next time, I will merge Expenses with the Supplier_Limit query to see if any limits have been breached.
Come back next time for more ways to use Power Query!