
Power Query: Month Mayhem – Part 1
3 July 2024
My salespeople are back from their break and I have more reports to construct. I have a report with a list of the clients they have been working with each month:
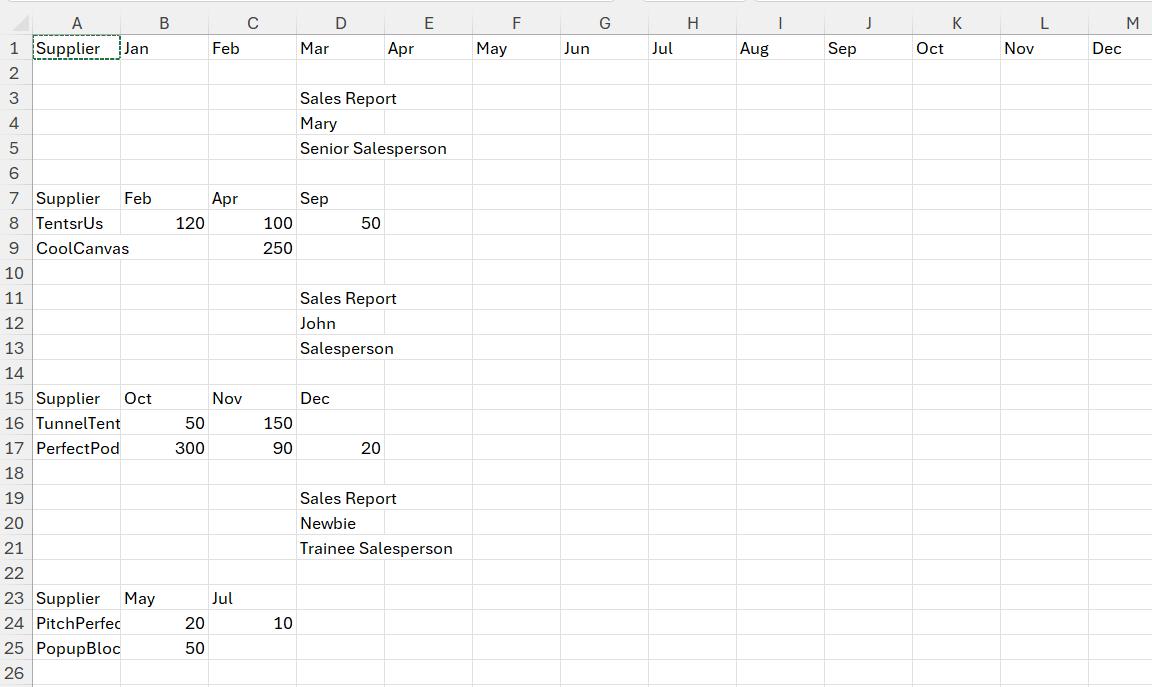
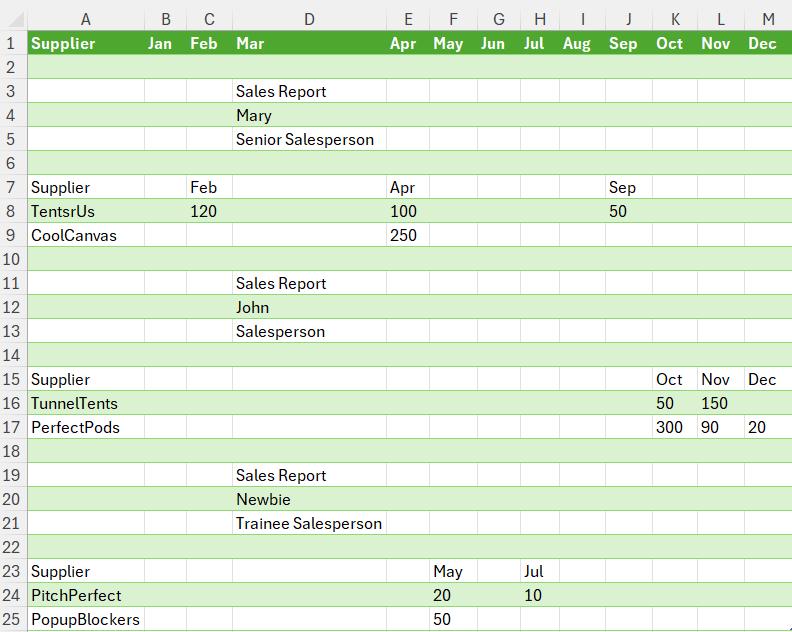
I would like to display the amount details in the salesperson sections but aligned to the relevant month at the top of the page:
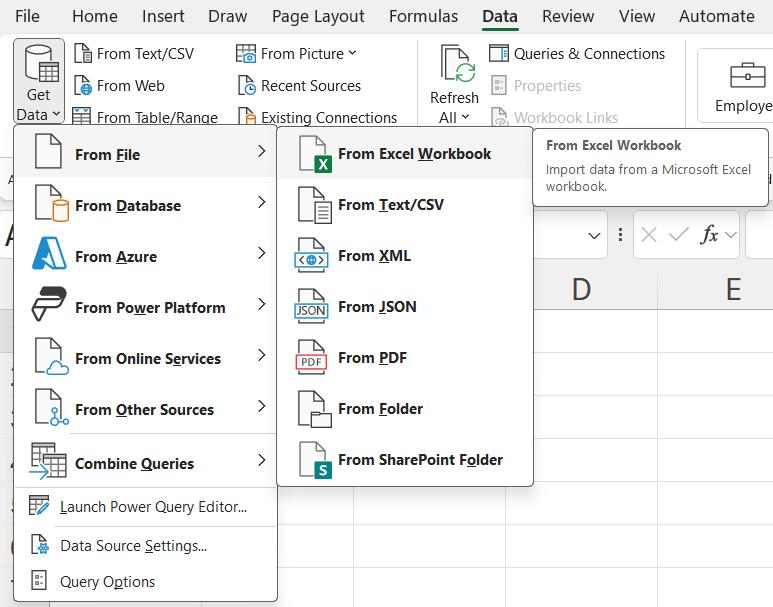
I will start in a new blank workbook and go to the ‘Get & Transform’ section on the Data tab, where I choose to use the ‘Get Data’ dropdown. I select ‘From File’ and then ‘From Excel Workbook’:
Having browsed to the source file, I choose to open it.
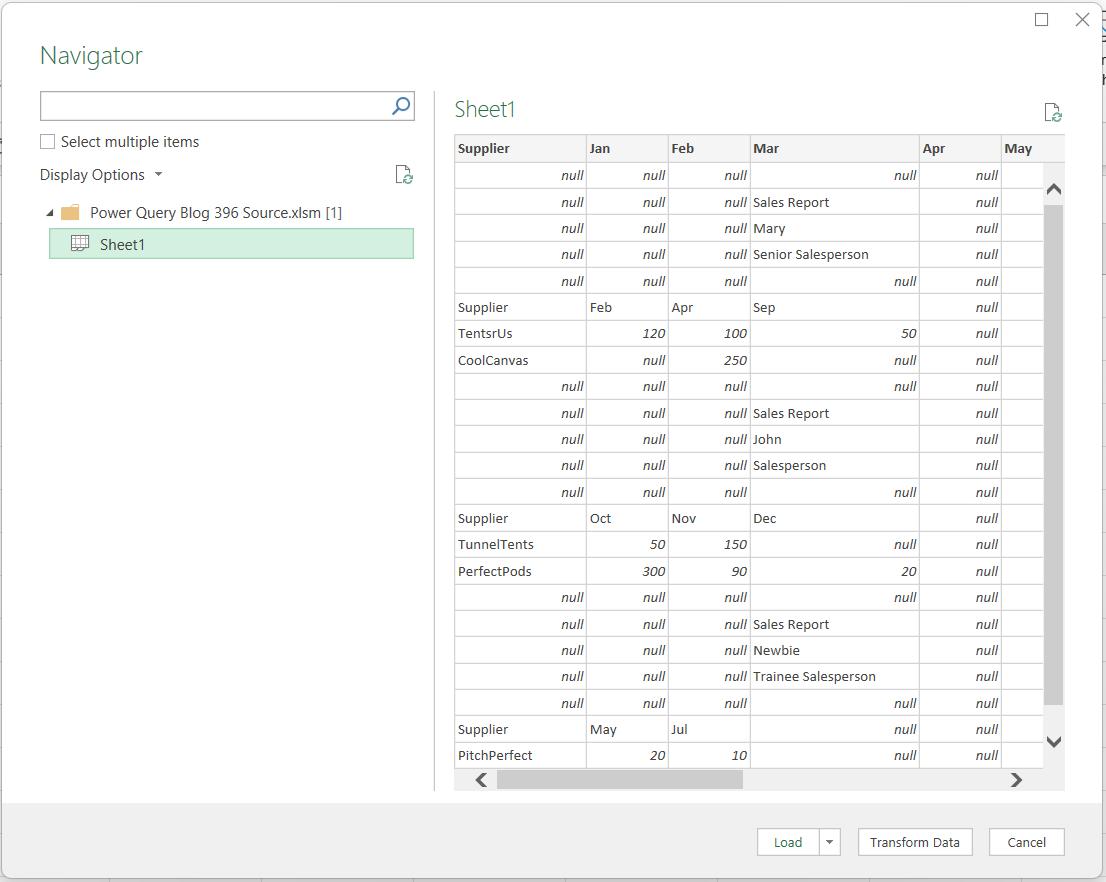
In the Navigator screen, I can see that Sheet1 contains the data. I click the ‘Transform Data’ button to bring my data into the Power Query editor:
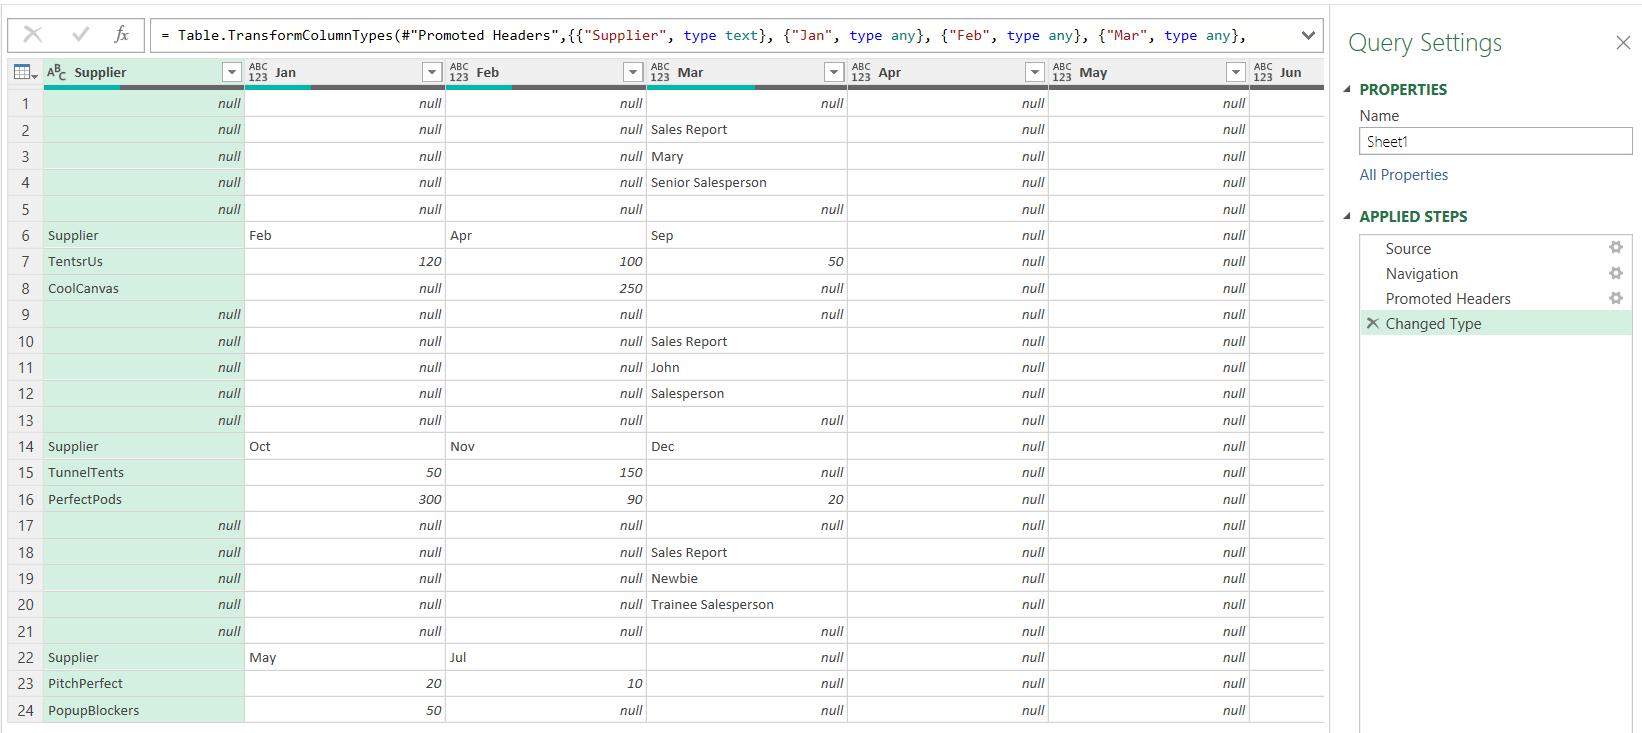
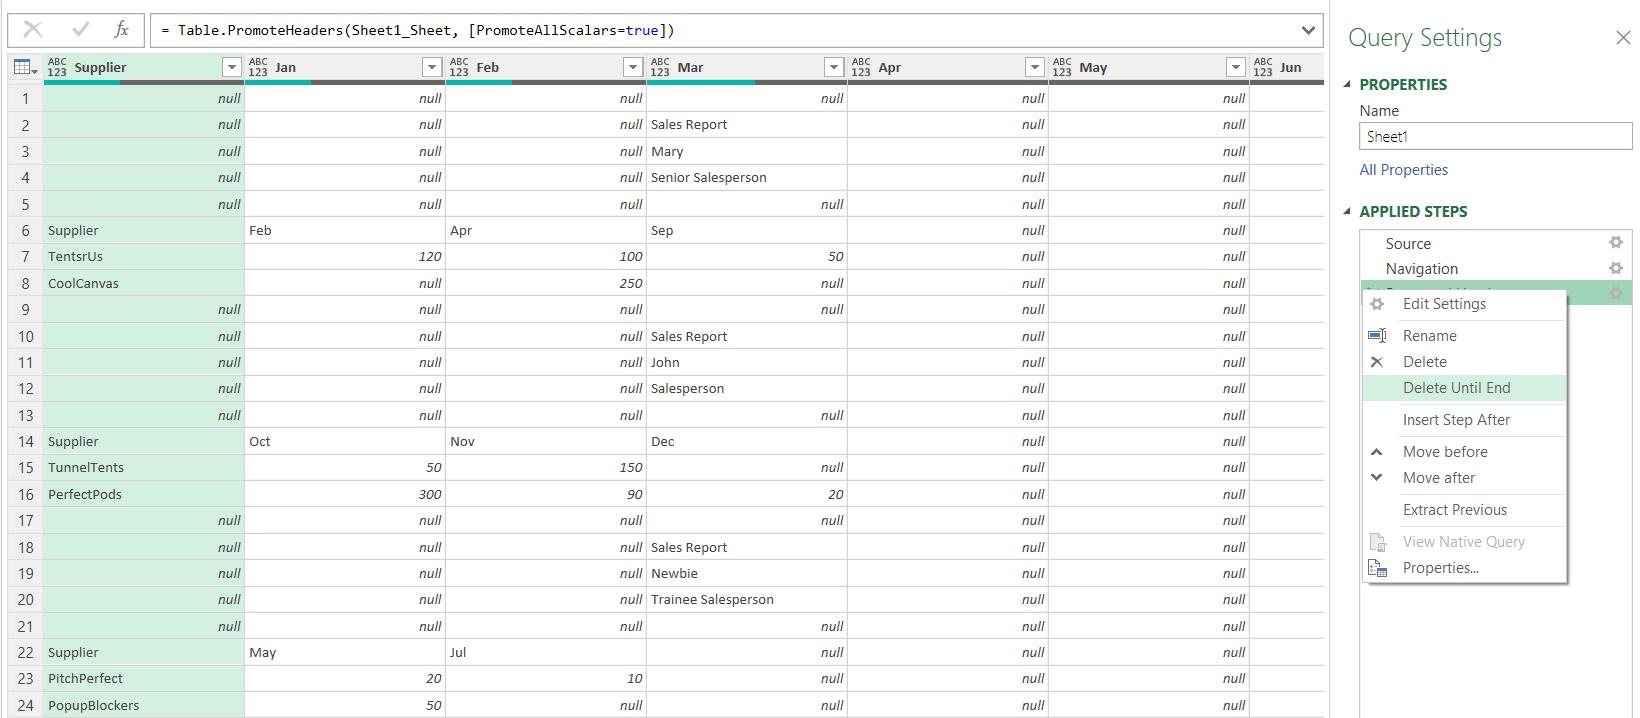
Power Query has performed some steps automatically for me. Since I will be using the column headers in a query later, I do not want to keep the ‘Promoted Headers’ step. I go to the ‘Promoted Headers’ step, and right-click to access the ‘Delete Until End’ option:
I receive a prompt to ensure I mean to delete all subsequent steps:
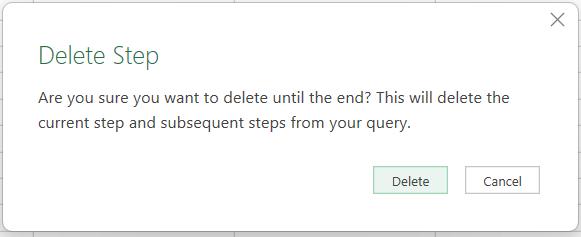
I choose to Delete.
One of the challenges for this example, is to keep related data together, and ensure that I will be able to display it in the correct order. The best way to do this, is to create my own key by adding an index. From the ‘Add Column’ tab, I choose to add an ‘Index Column’ starting ‘From 1’:
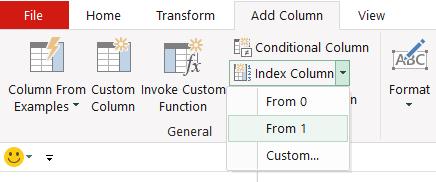
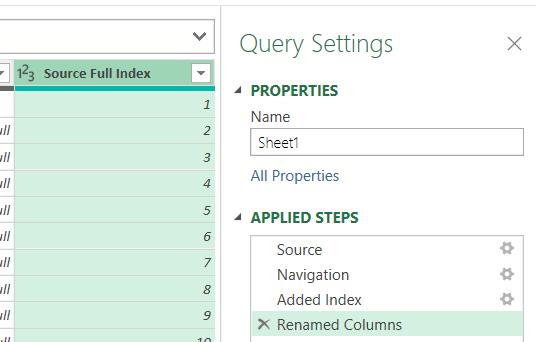
I will need to create more than one key, and therefore more than one index. I change the name of the new column to Source Full Index to indicate that this index will help me to keep the order of the full data set.
Having recorded the position of the data, I need a way of keeping the sections of data together whilst I am transforming the data to move the amounts to different columns. I plan to use another key (index) for this.
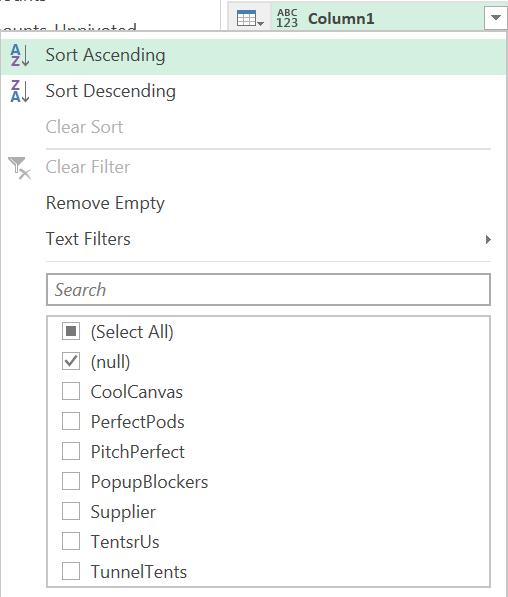
I remove the subheading rows by filtering on the first column:
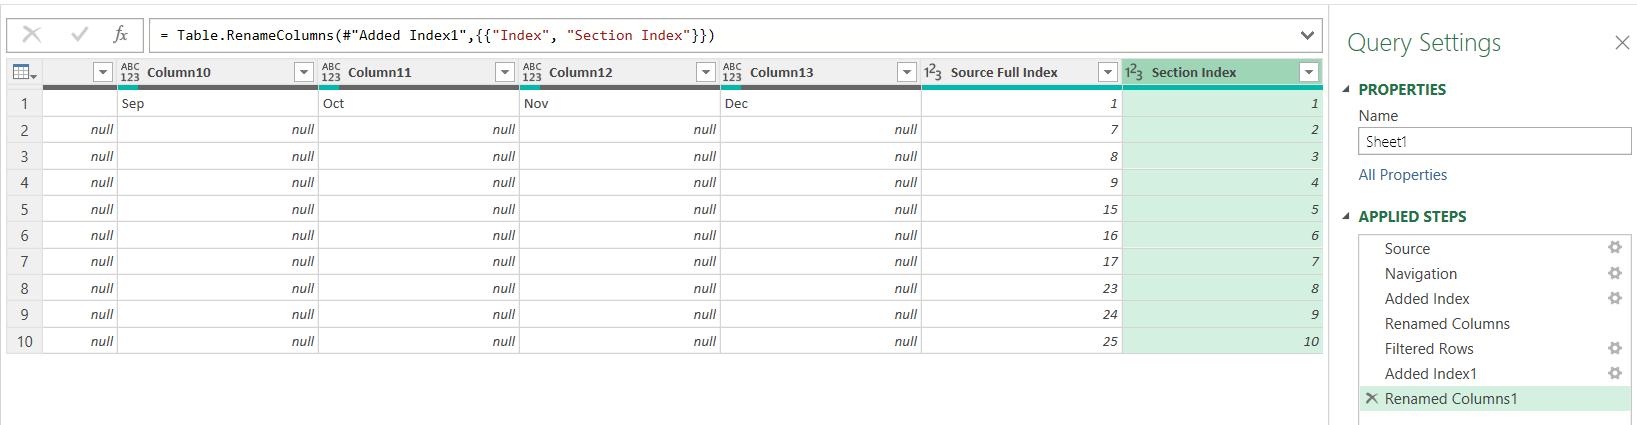
Having done this, I create another key. I add another index starting from one [1], and this time I call it Section Index:
Next time, I will recombine the data, and show how this will help me to identify the data in each section.
Come back next time for more ways to use Power Query!