
Power Query: Month Mayhem – Part 6
7 August 2024
Welcome to our Power Query blog. Today, I continue mapping the data.
My salespeople are back from their break and I have more reports to construct. I have a report with a list of the clients they have been working with each month:
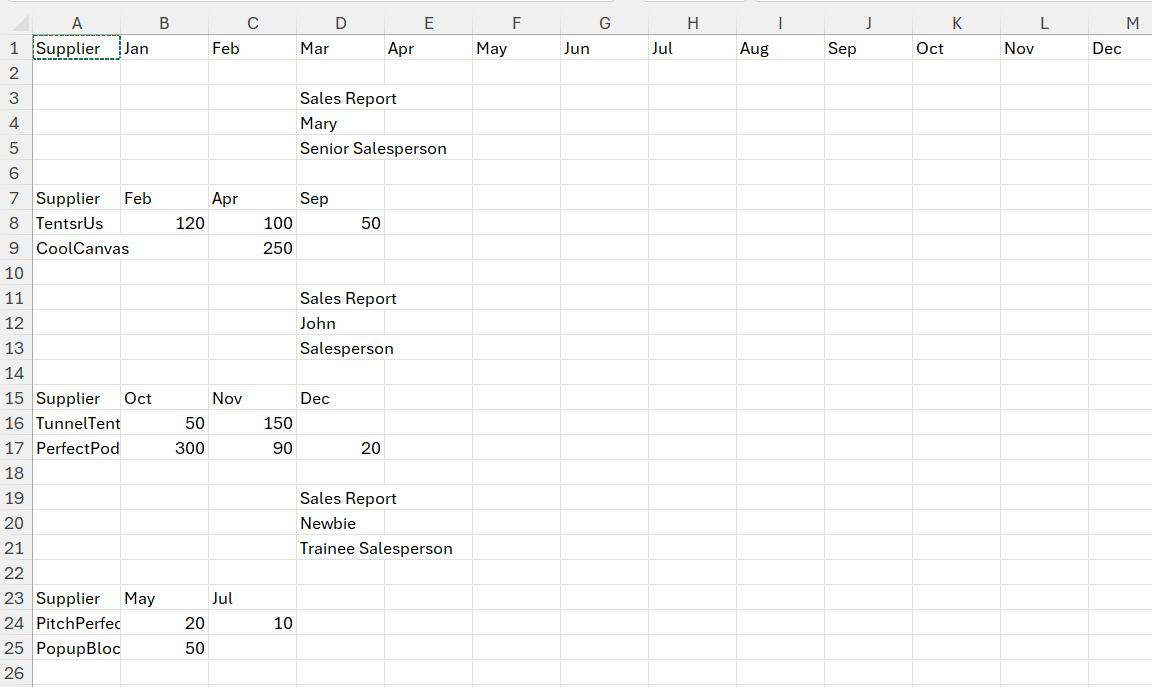
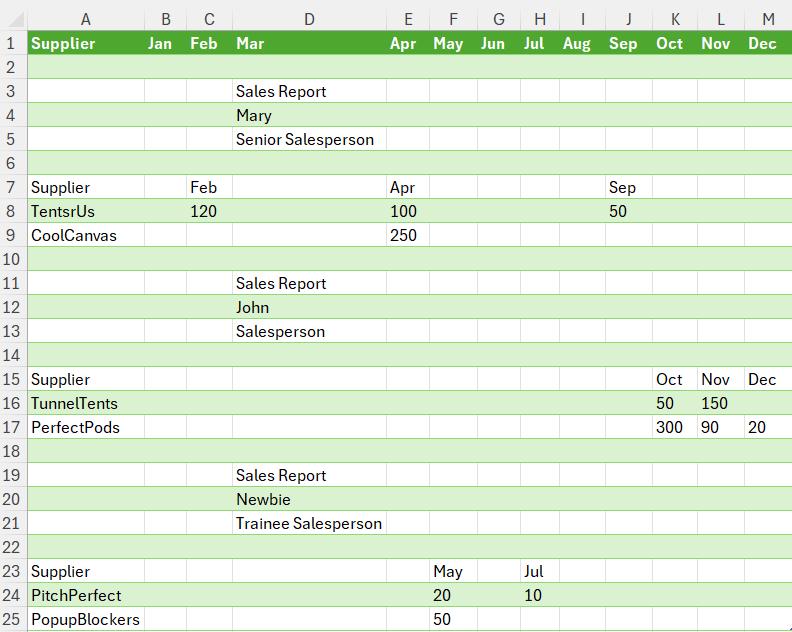
I would like to display the amount details in the salesperson sections but aligned to the relevant month at the top of the page:
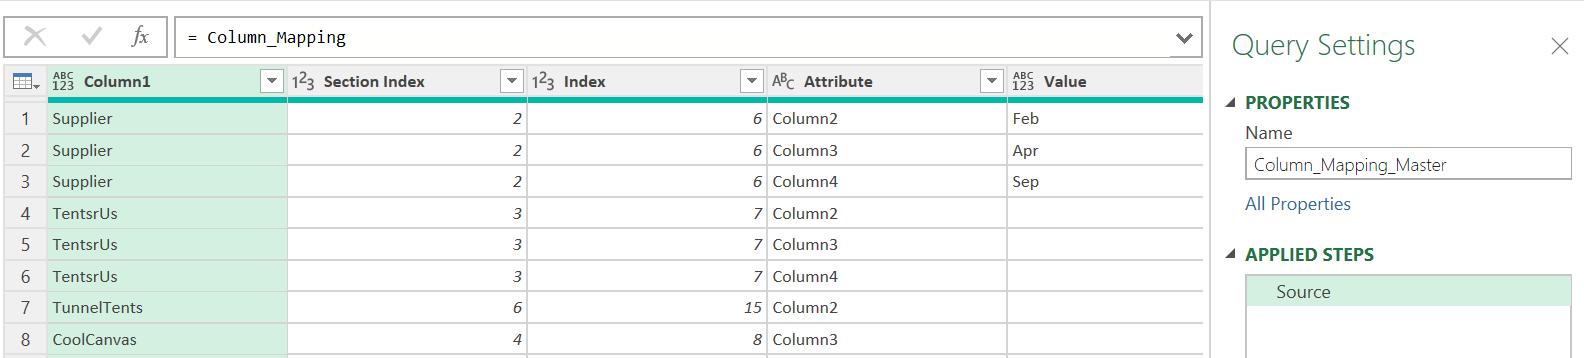
Last time, I created a mapping query, which I called Column_Mapping:
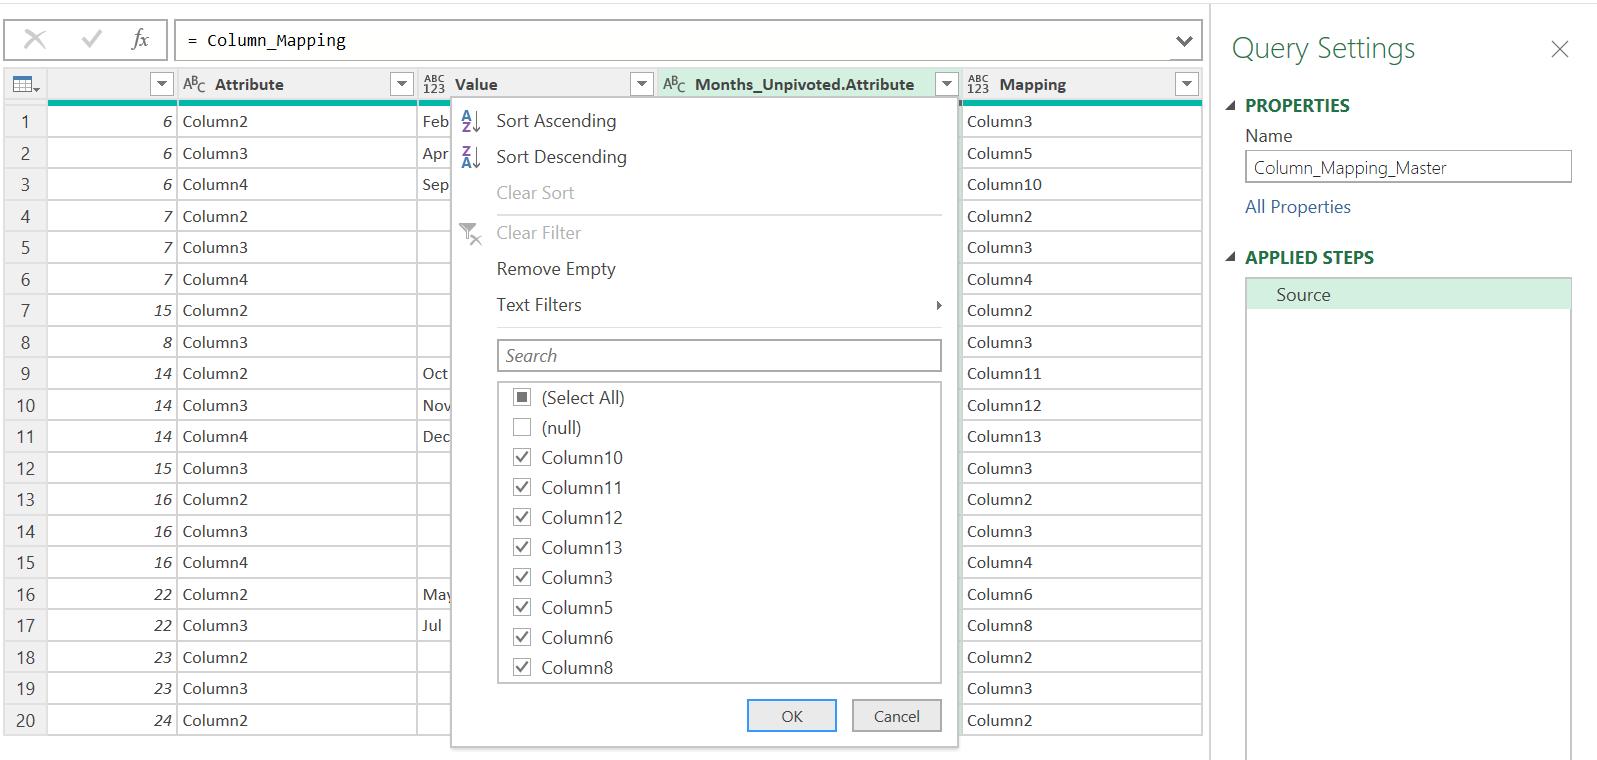
I will continue mapping my data. Whilst I can use the query I have created for the data, I need a more concise mapping tool for the months. I take a reference copy of Column_Mapping, which I call Column_Mapping_Master.
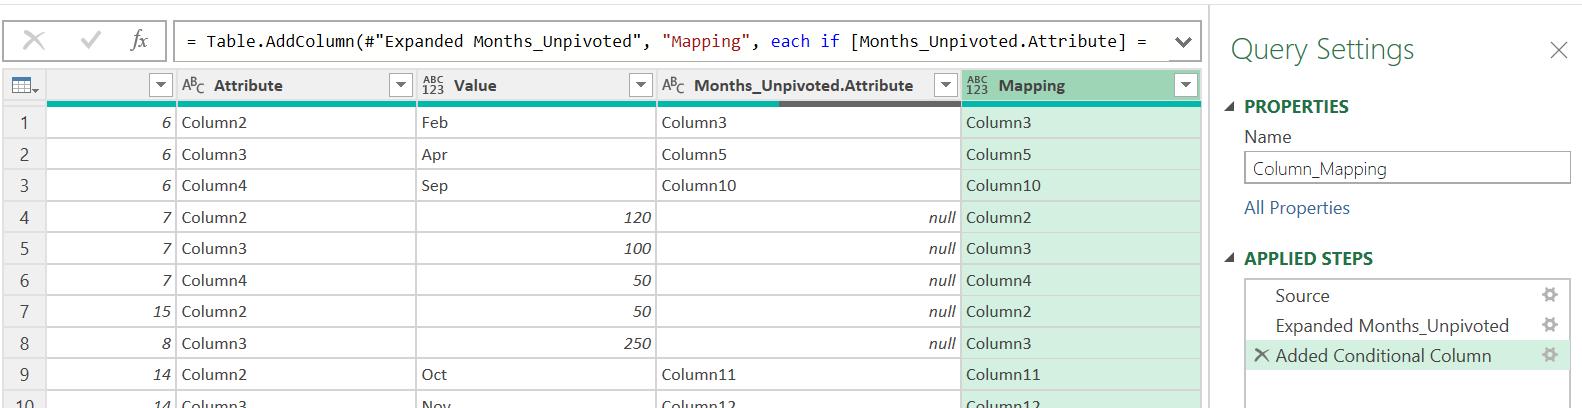
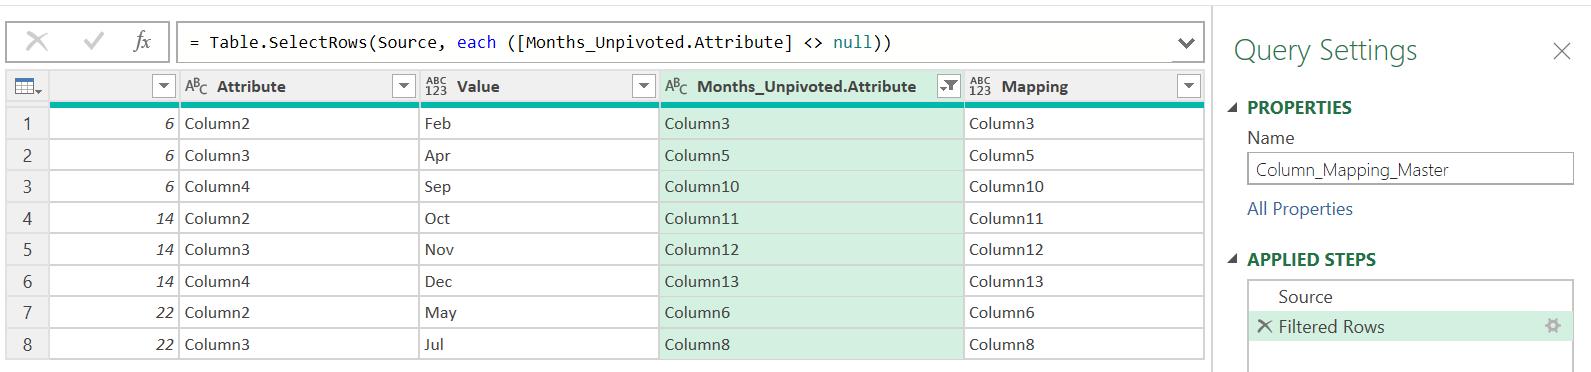
I am going to filter on Months_Unpivoted.Attribute to remove null values:
This reduces the number of rows to the months where data will appear:
Column_Mapping_Master is complete. It is time to begin rebuilding my data to create the new table. I start in Column_Mapping, where I am going to ‘Merge as New’ with Column_Mapping_Master:
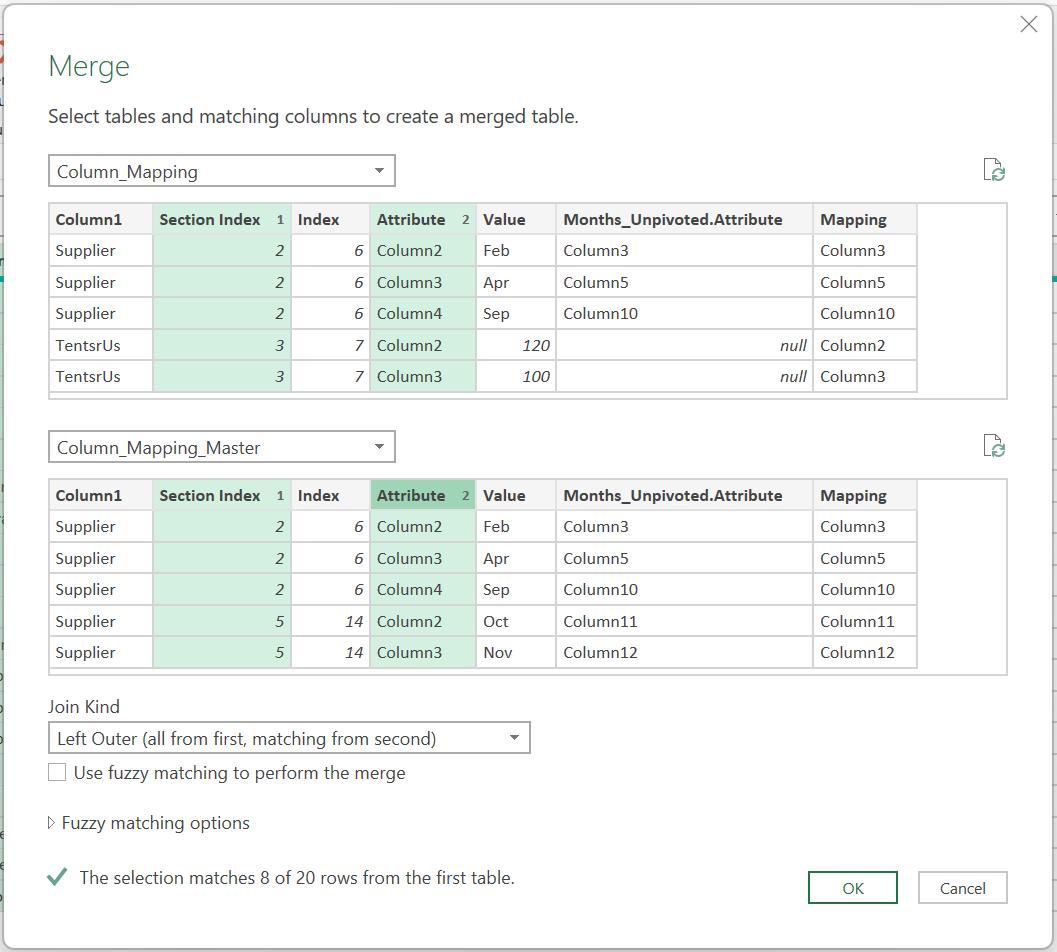
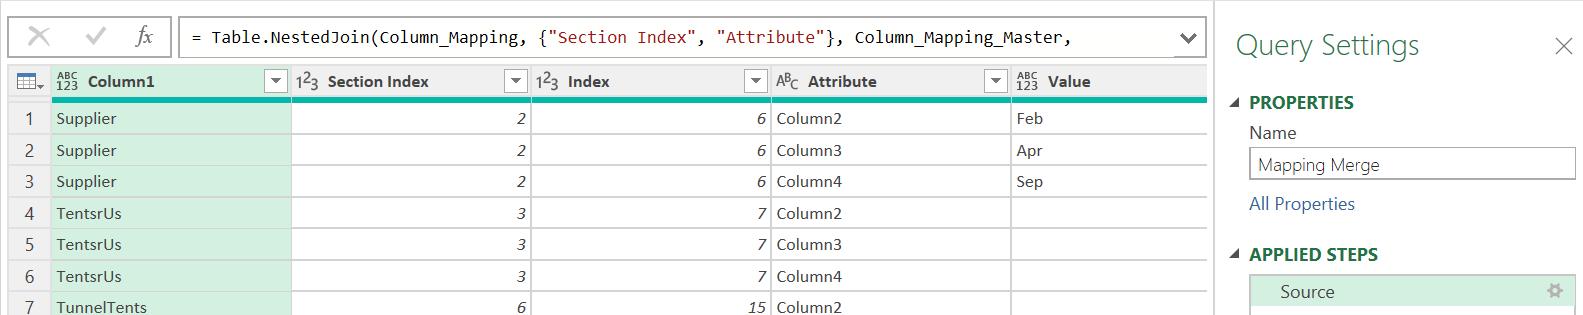
I merge on Section Index and Attribute, being careful to select the columns in the same order. I call the new query Mapping Merge:
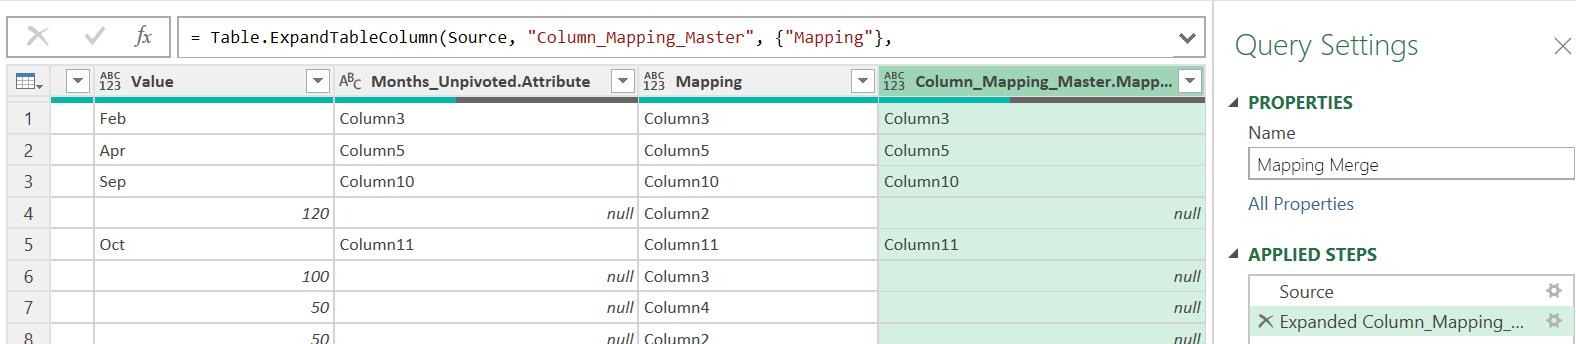
I expand Column_Mapping_Master and select Mapping:
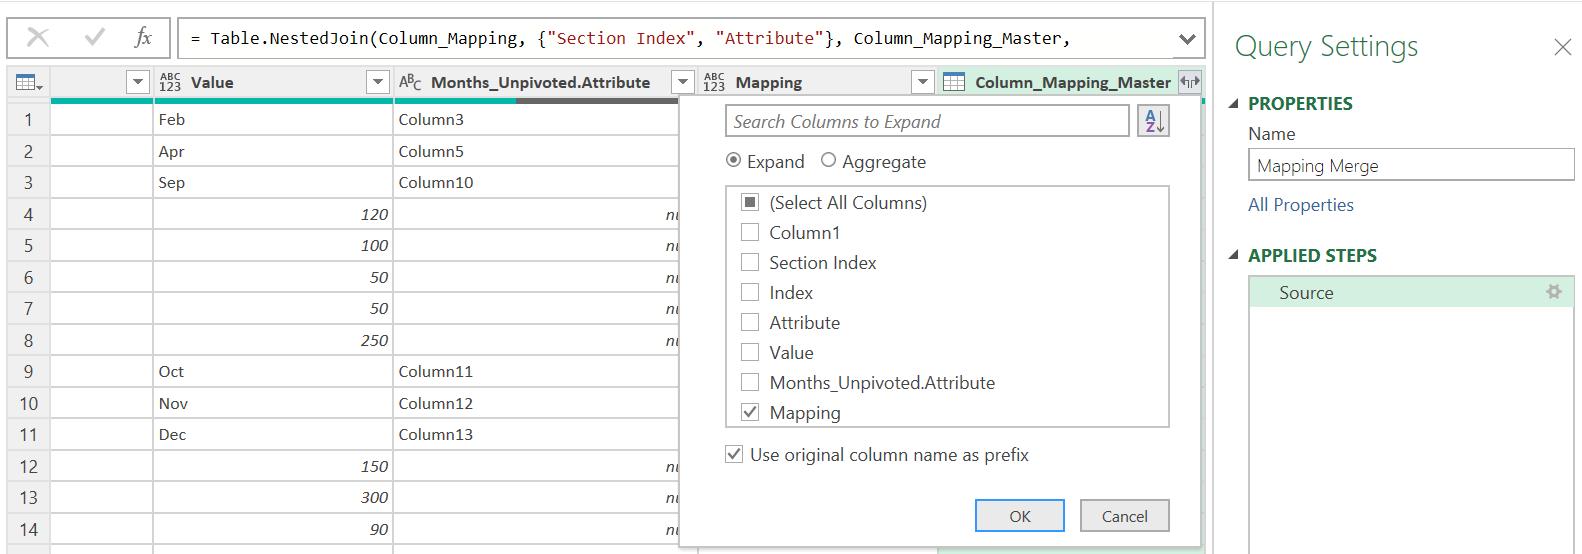
Since there is already a column with the same name, I keep the prefix option.
I select the ‘Choose Columns’ option from the Home tab, and select Column1, Index,Value and Column_Mapping_Master.Mapping:
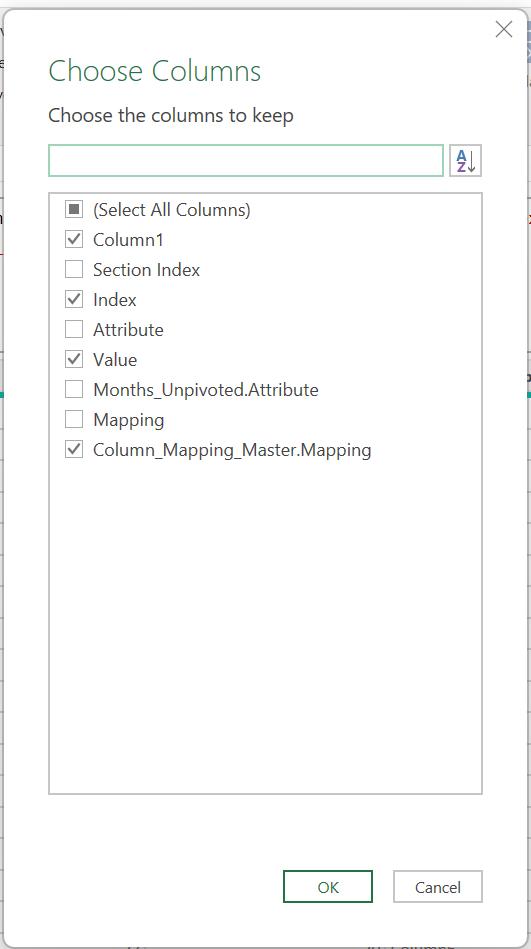
This gives me four [4] columns:
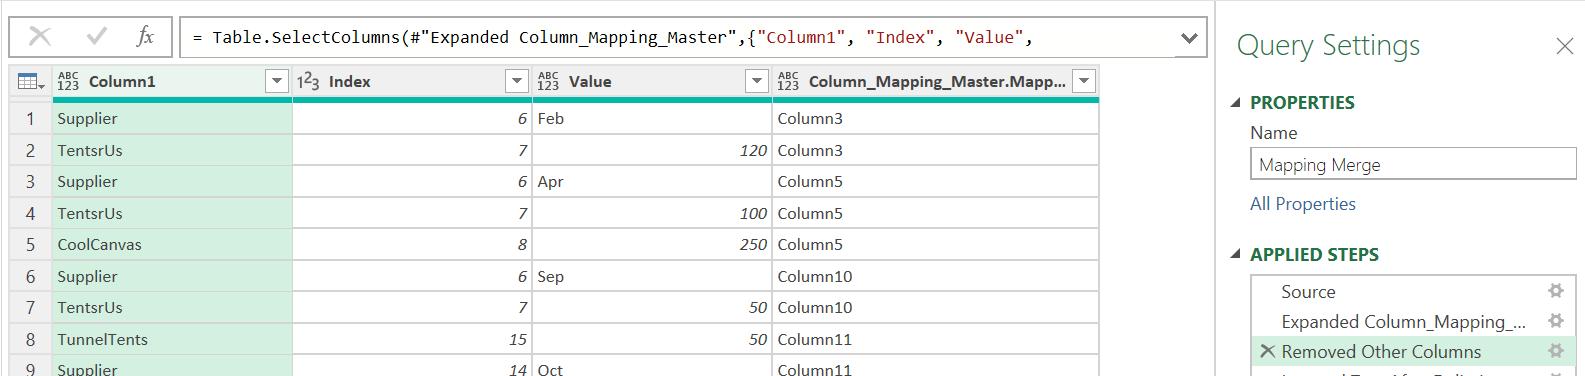
I want to sort on the column number, but if I sort on the text, ‘Column11’ would come before ‘Column2’. I need to get the digits from the Column_Mapping_Master.Mapping column, whilst keeping the column, so I use Extract from the ‘Add Column’ tab:
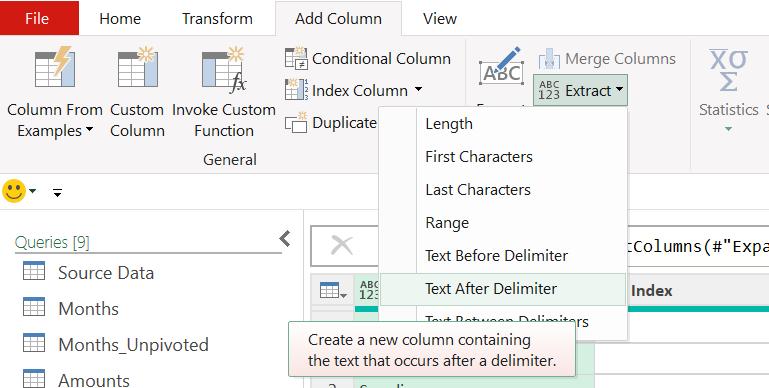
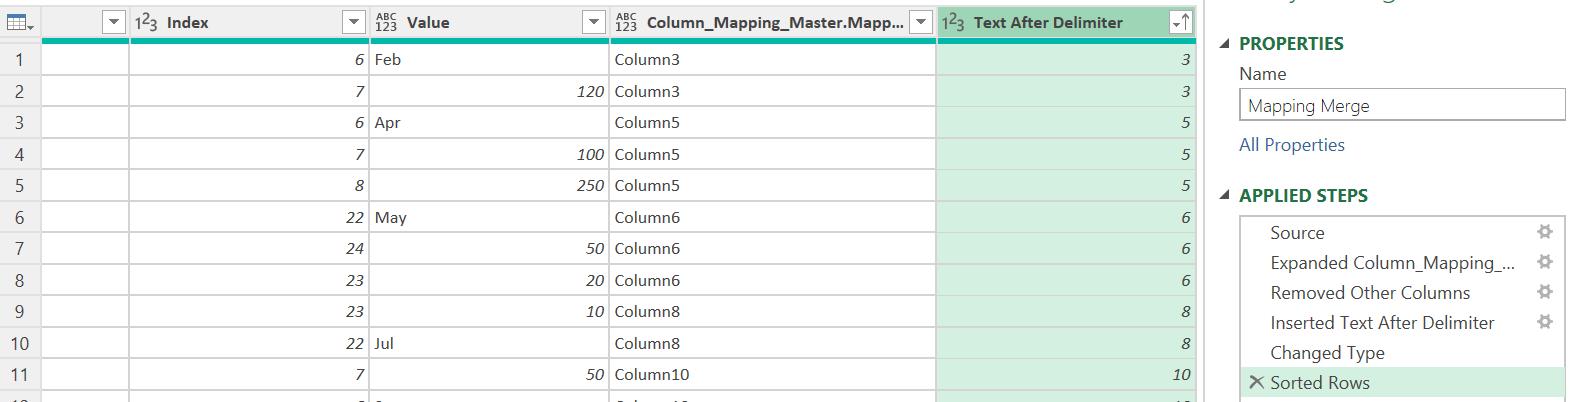
I extract the data after ‘Column’. This gives me a new column, which I can change to whole numbers and sort on:
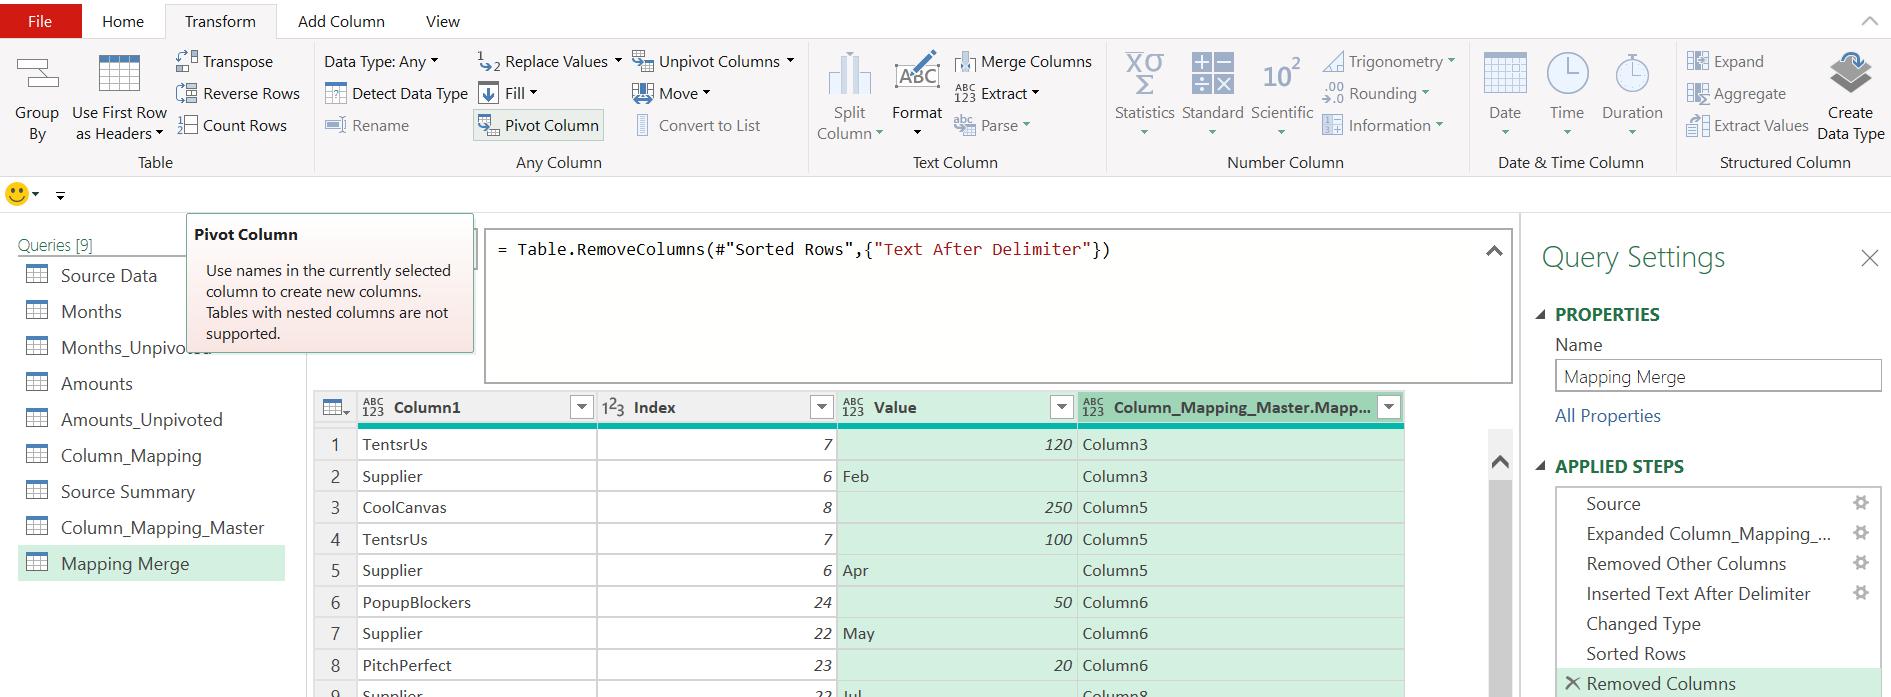
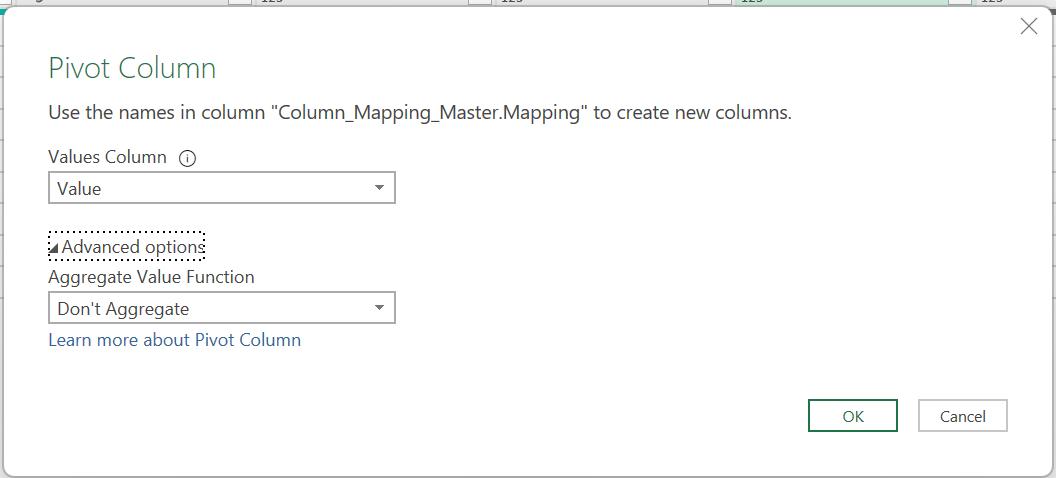
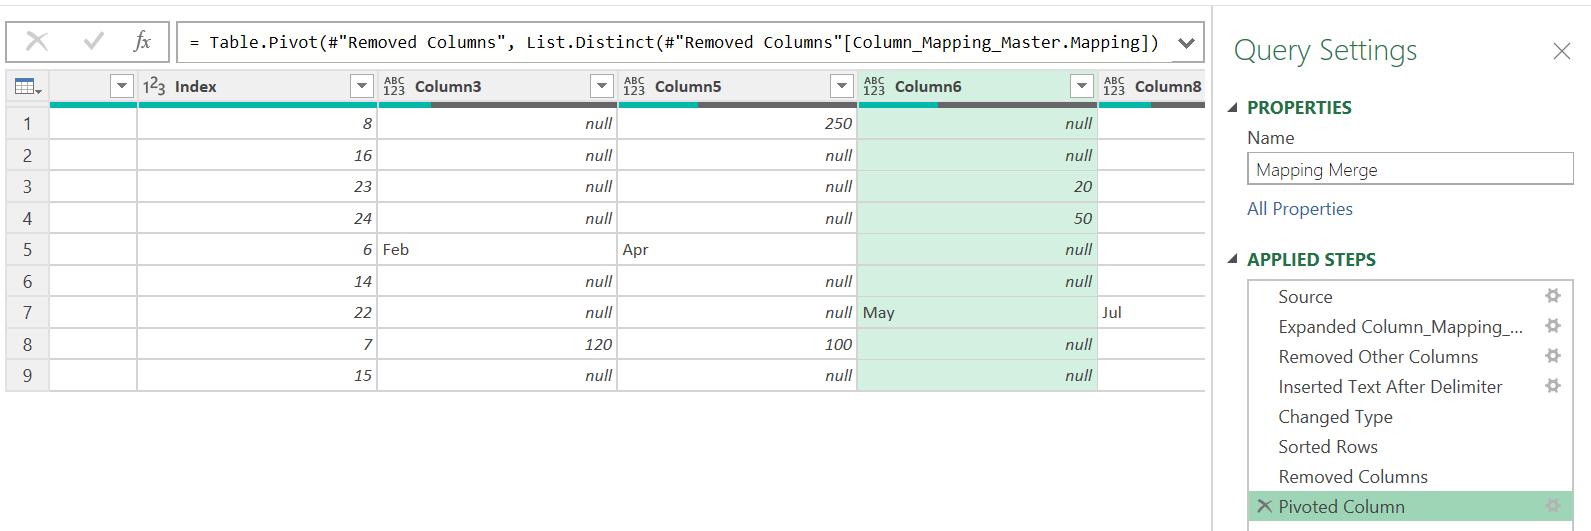
I can now delete the new column and select Column_Mapping_Master.Mapping and then Value and choose to pivot these columns:
I select the ‘Advanced options’ and choose ‘Don’t Aggregate’:
This query is complete; I will continue transforming my data next time.
Come back next time for more ways to use Power Query!