
Power Query: Month Mayhem – Part 8
21 August 2024
Welcome to our Power Query blog. Today, I complete the challenge.
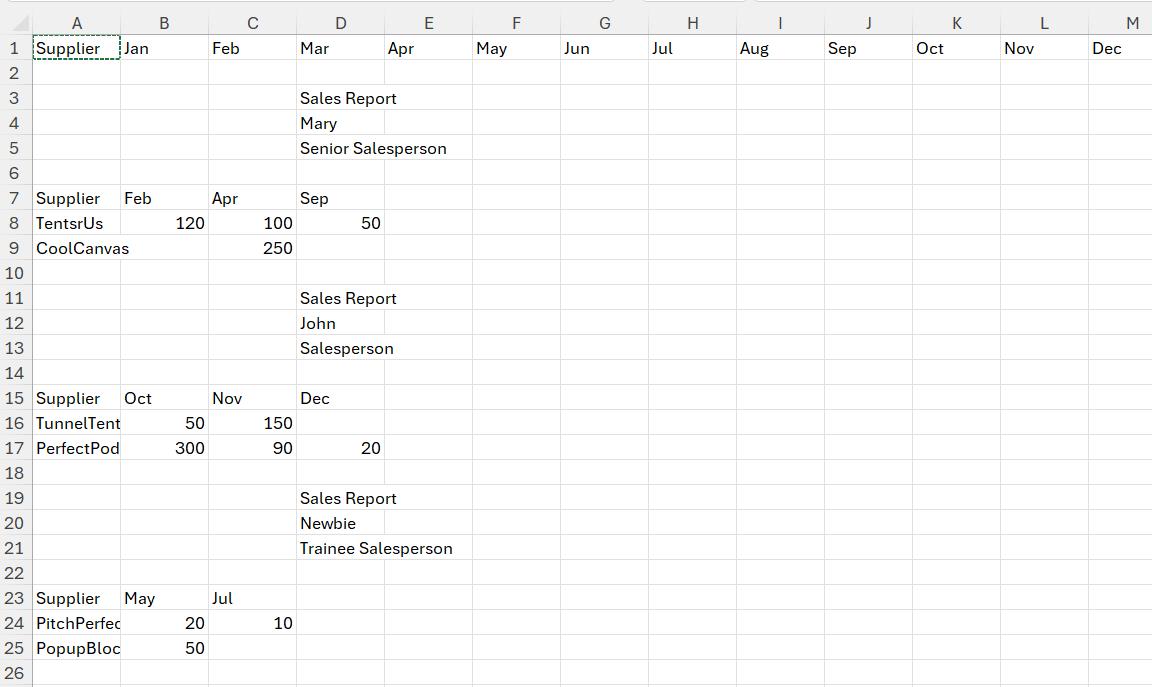
My salespeople are back from their break and I have more reports to construct. I have a report with a list of the clients they have been working with each month:
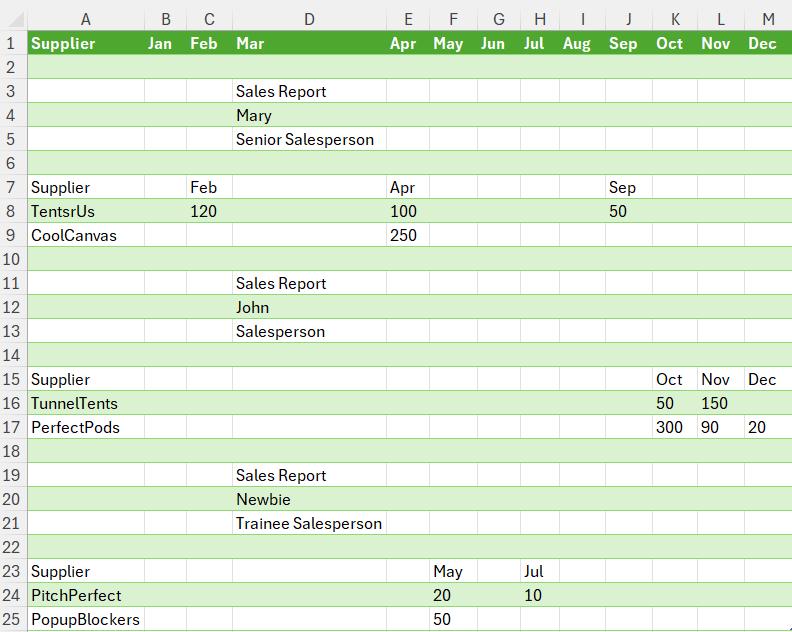
I would like to display the amount details in the salesperson sections, but aligned to the relevant month at the top of the page:
Last time, I extracted the interim report headings.
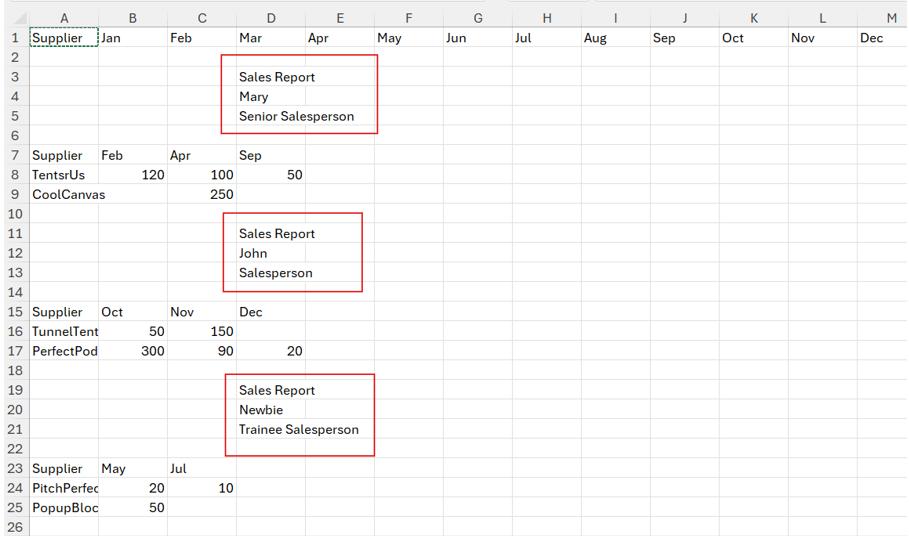
I extracted them from the Source Summary query into a new query which I called Report Headings and then appended Mapping Merge to get the body of the query that I will be loading to the workbook:
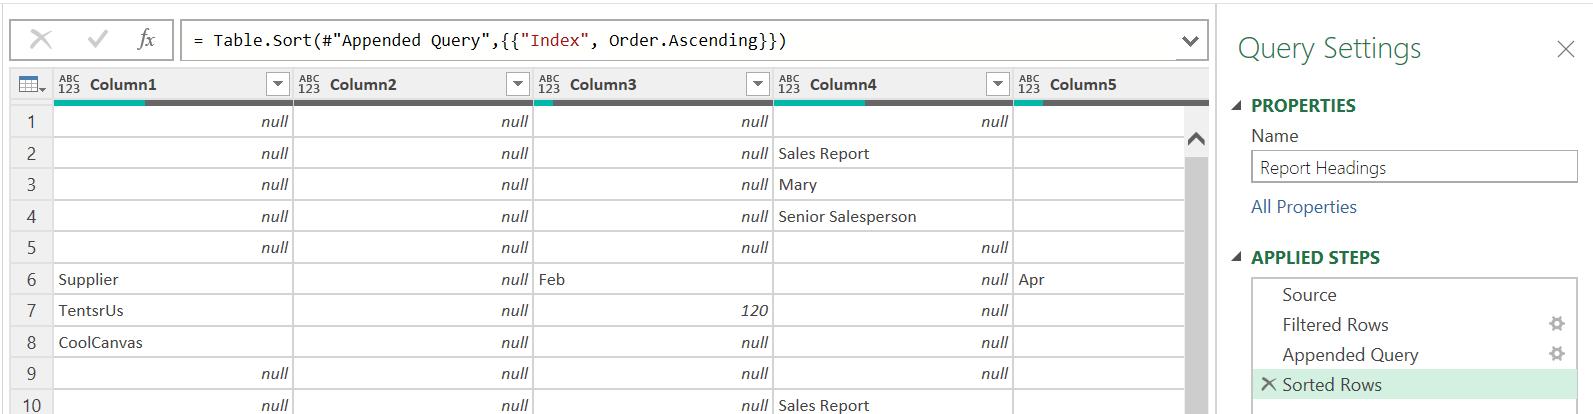
My transformations are almost done. I still need to add the top heading and fully prepare my data for loading. I need to be able to control the order that the data is appended in, as I want to add this query to the top header (Months). I could either start from Months, and ‘Append Queries’ from the Home tab, or I can start from Report Headings and choose to ‘Append Queries as New’ from the ‘Append Queries’ dropdown on the Home tab. I choose the latter option to create a new query which I will be loading to the workbook.
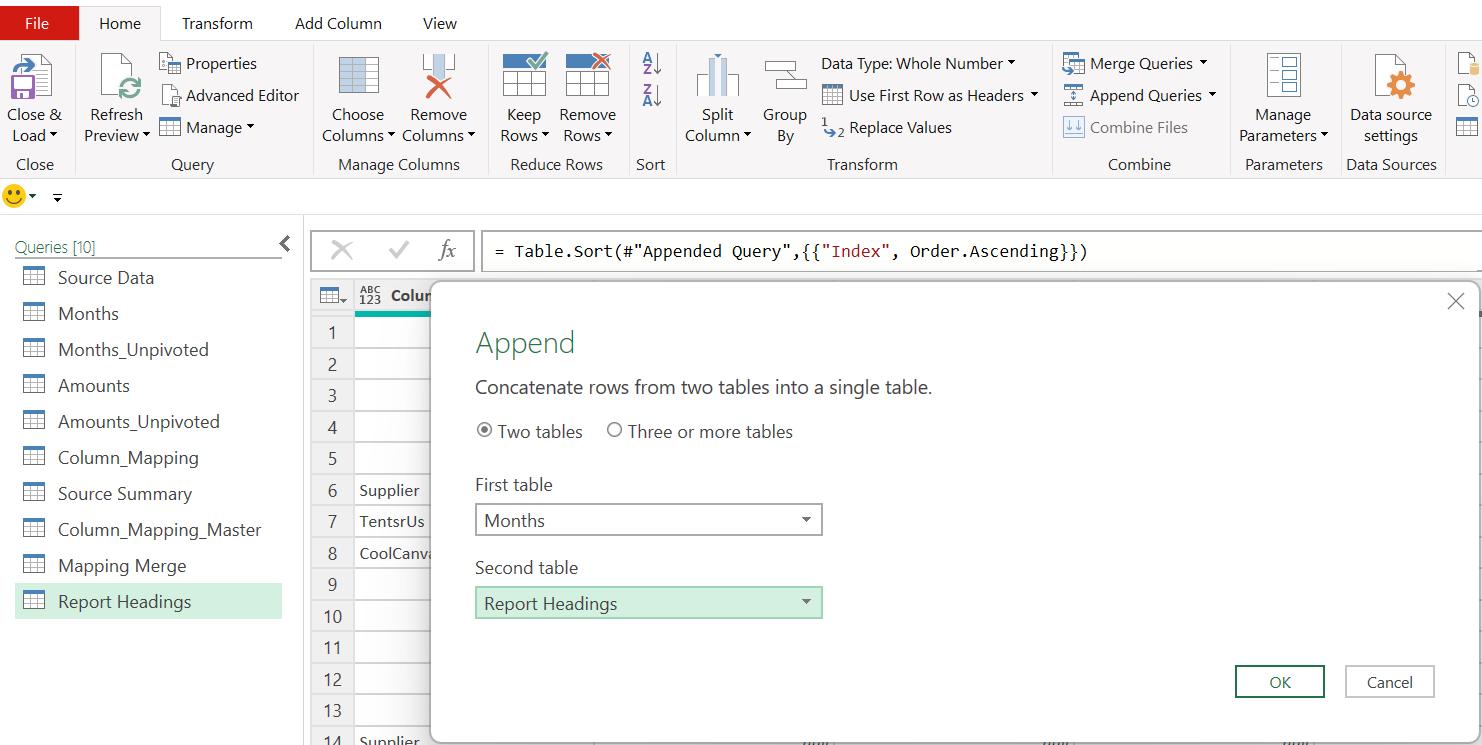
I may use the ‘Two tables’ format, and make sure that I put Months first.
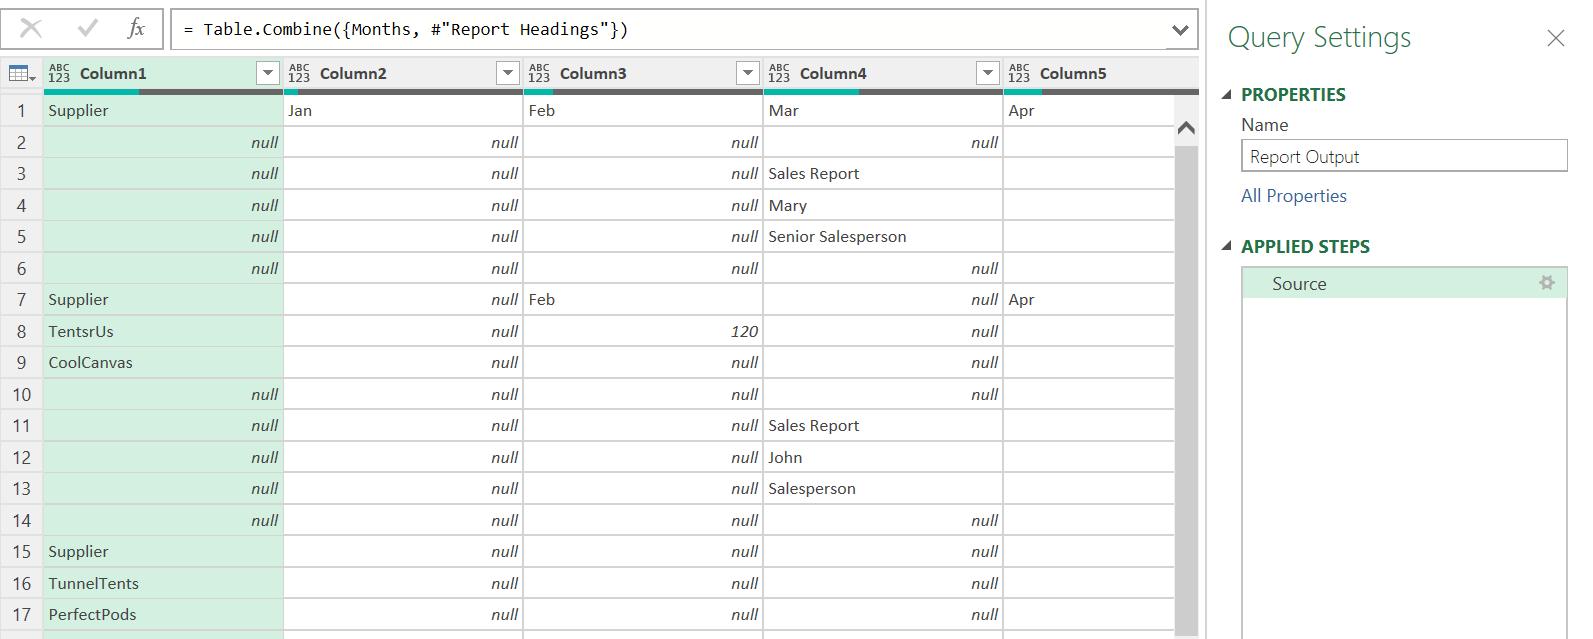
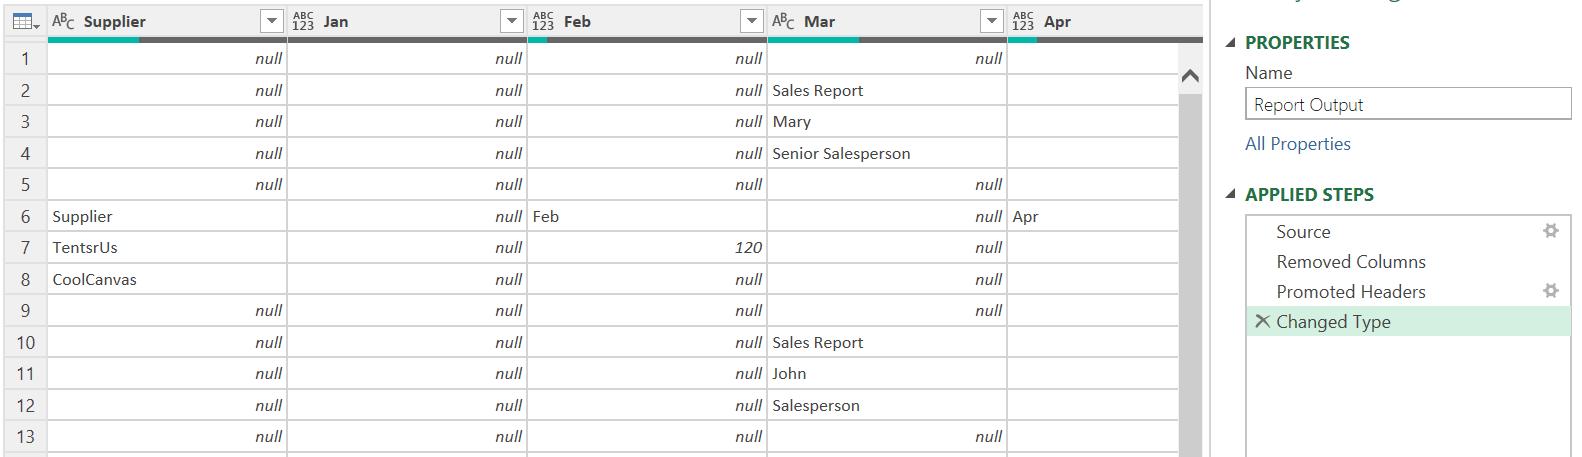
I can see that my new query, called Report Output, is already looking promising. I just need to remove the indexes I created. I select the column headings of Section Index and Index whilst holding down the CTRL key:
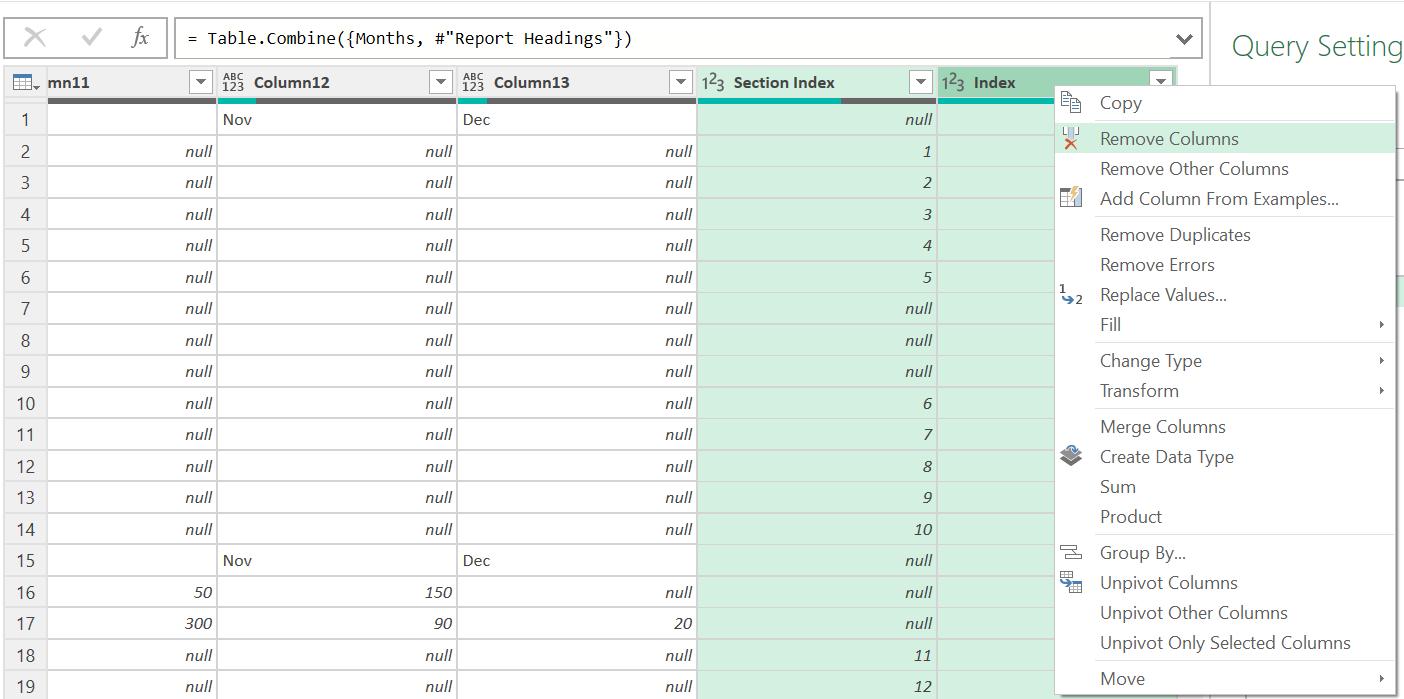
I right-click and choose to ‘Remove Columns’. The final transformation is to promote the headers, which I can do from the Home tab or the Transform tab:
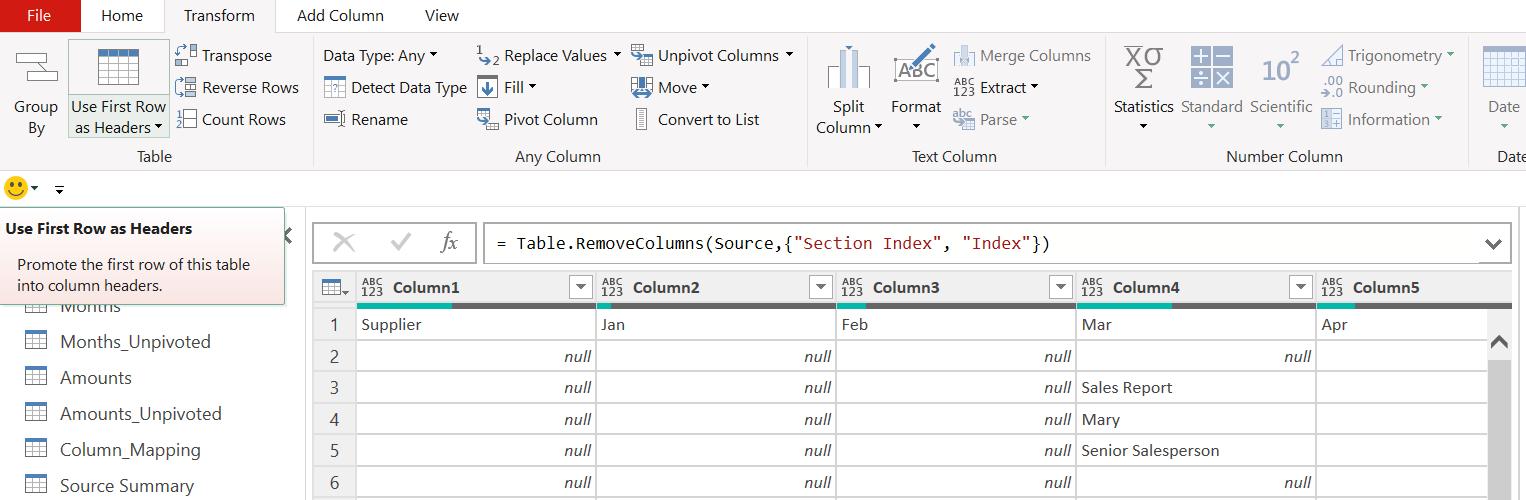
Since some of the columns are a mixture of numbers and text, the ‘Changed Type’ step leaves most of them as data type ‘Any’.
I select one of the headers and use CTRL + A to select them all. On the Transform tab, I change ‘Data Type’ to ‘Text’ for all the columns:
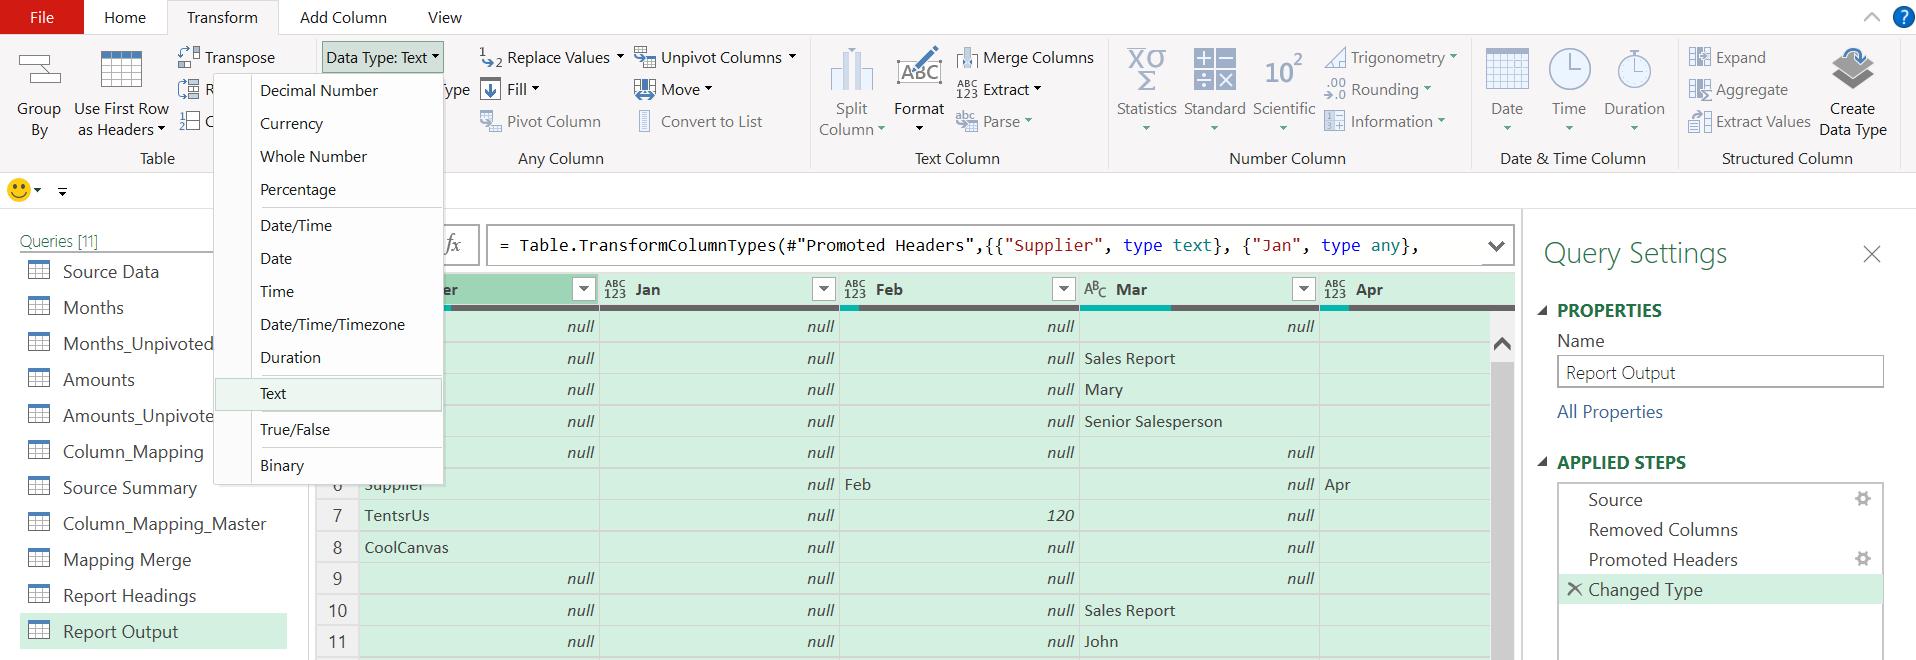
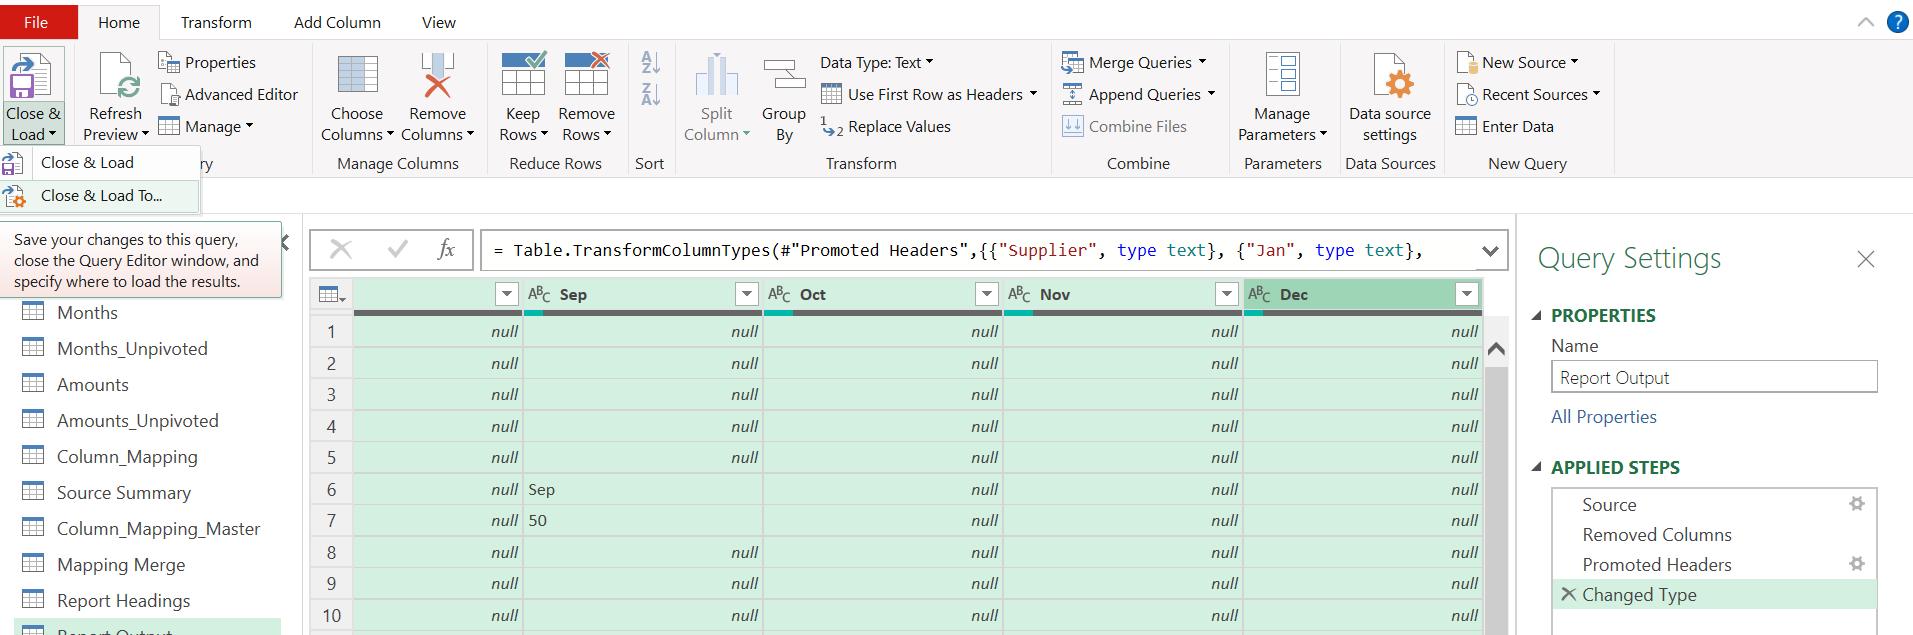
This is incorporated by Power Query into the existing ‘Changed Type’ step. My data is ready for me to ‘Close & Load To…’ from the Home tab:
I initially choose to set all the queries to ‘Connection Only’ as I only want to load Report Output.
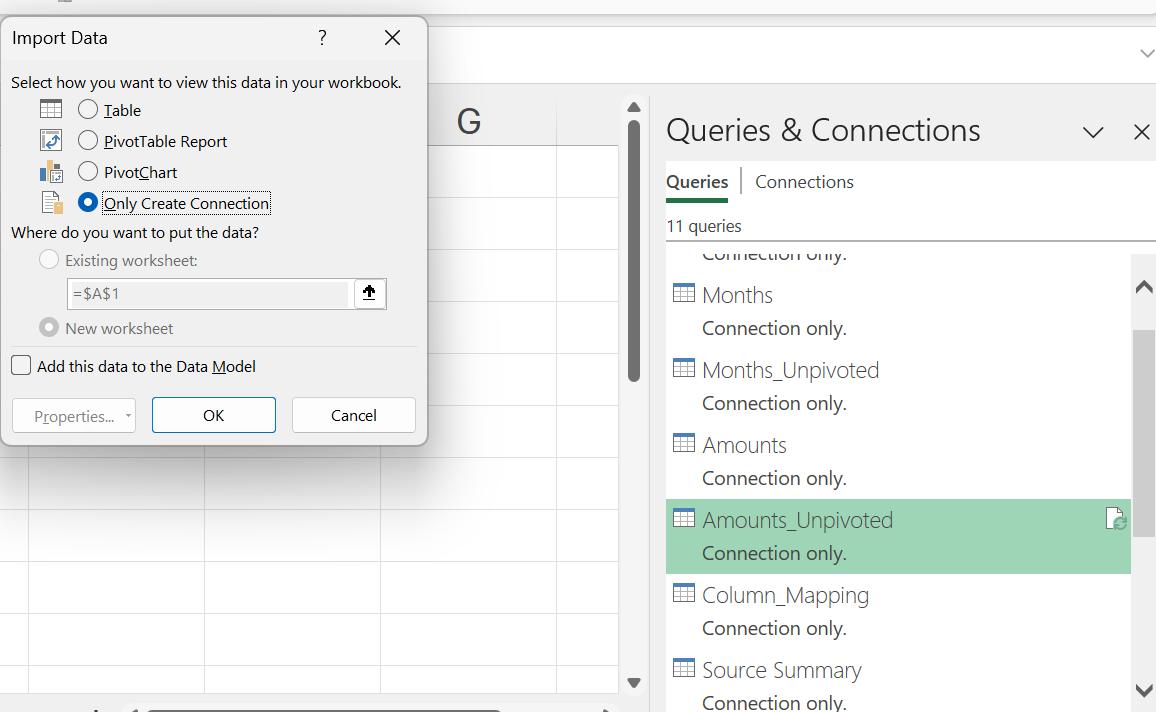
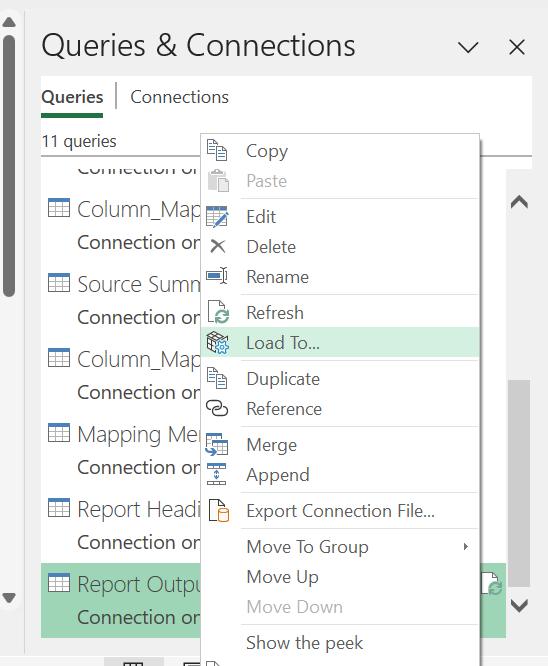
Having done this, I select the Report Output query, and right-click to change the ‘Load To…’ settings:
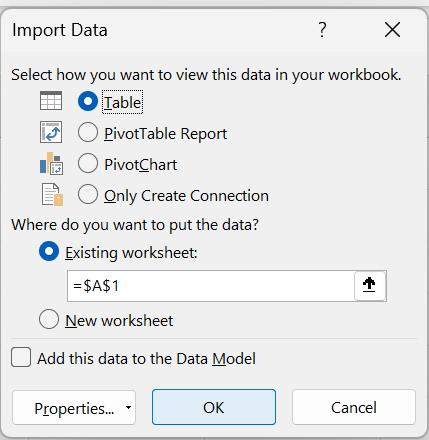
I choose to load to a Table on the ‘Existing worksheet’:
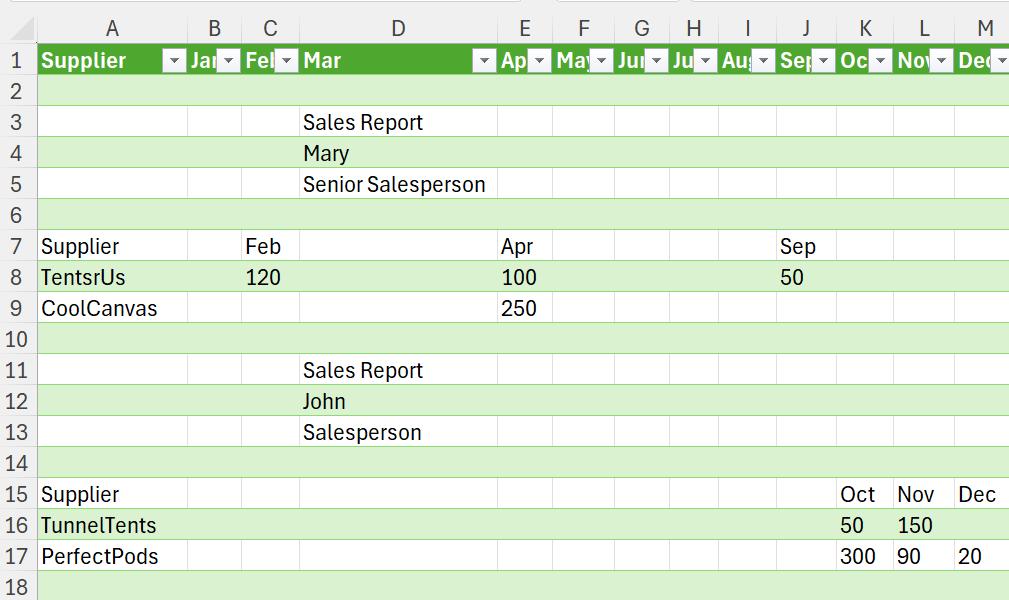
I click ‘OK’ and the data is loaded:
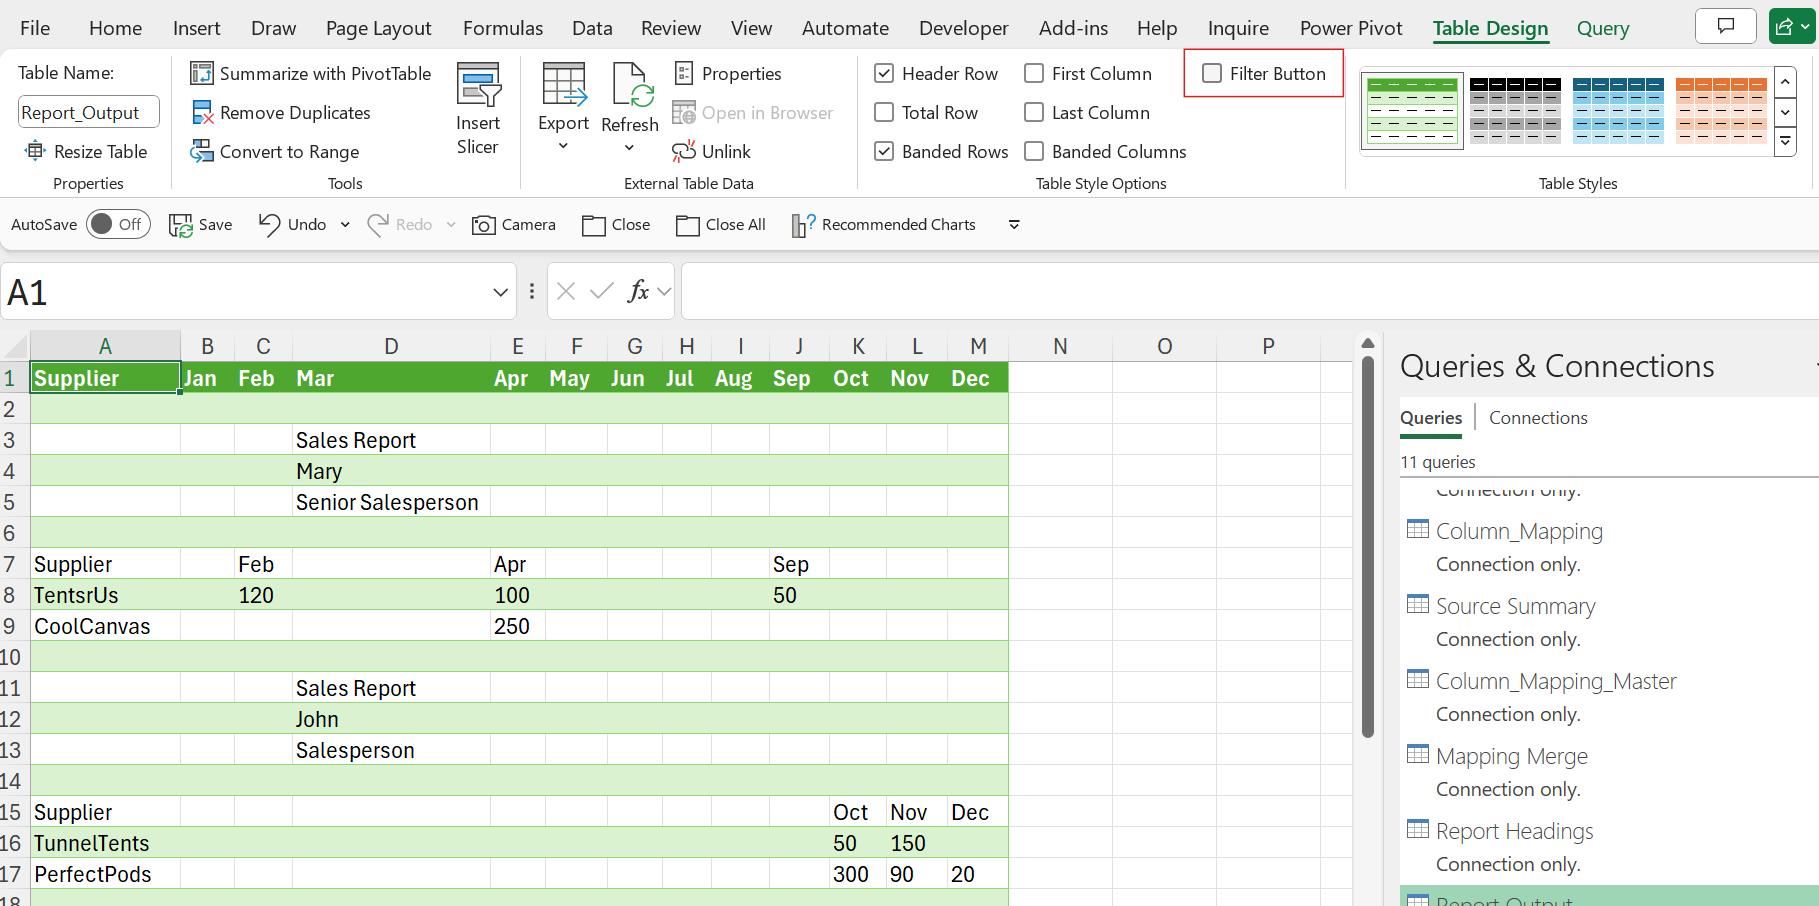
I can remove the filters in the Table tab if I wish:
My query is now complete.
Come back next time for more ways to use Power Query!