
Power Query: Big Comparison
23 April 2020
Welcome to our Power Query blog. This week, I look at comparing data in two large CSV files.
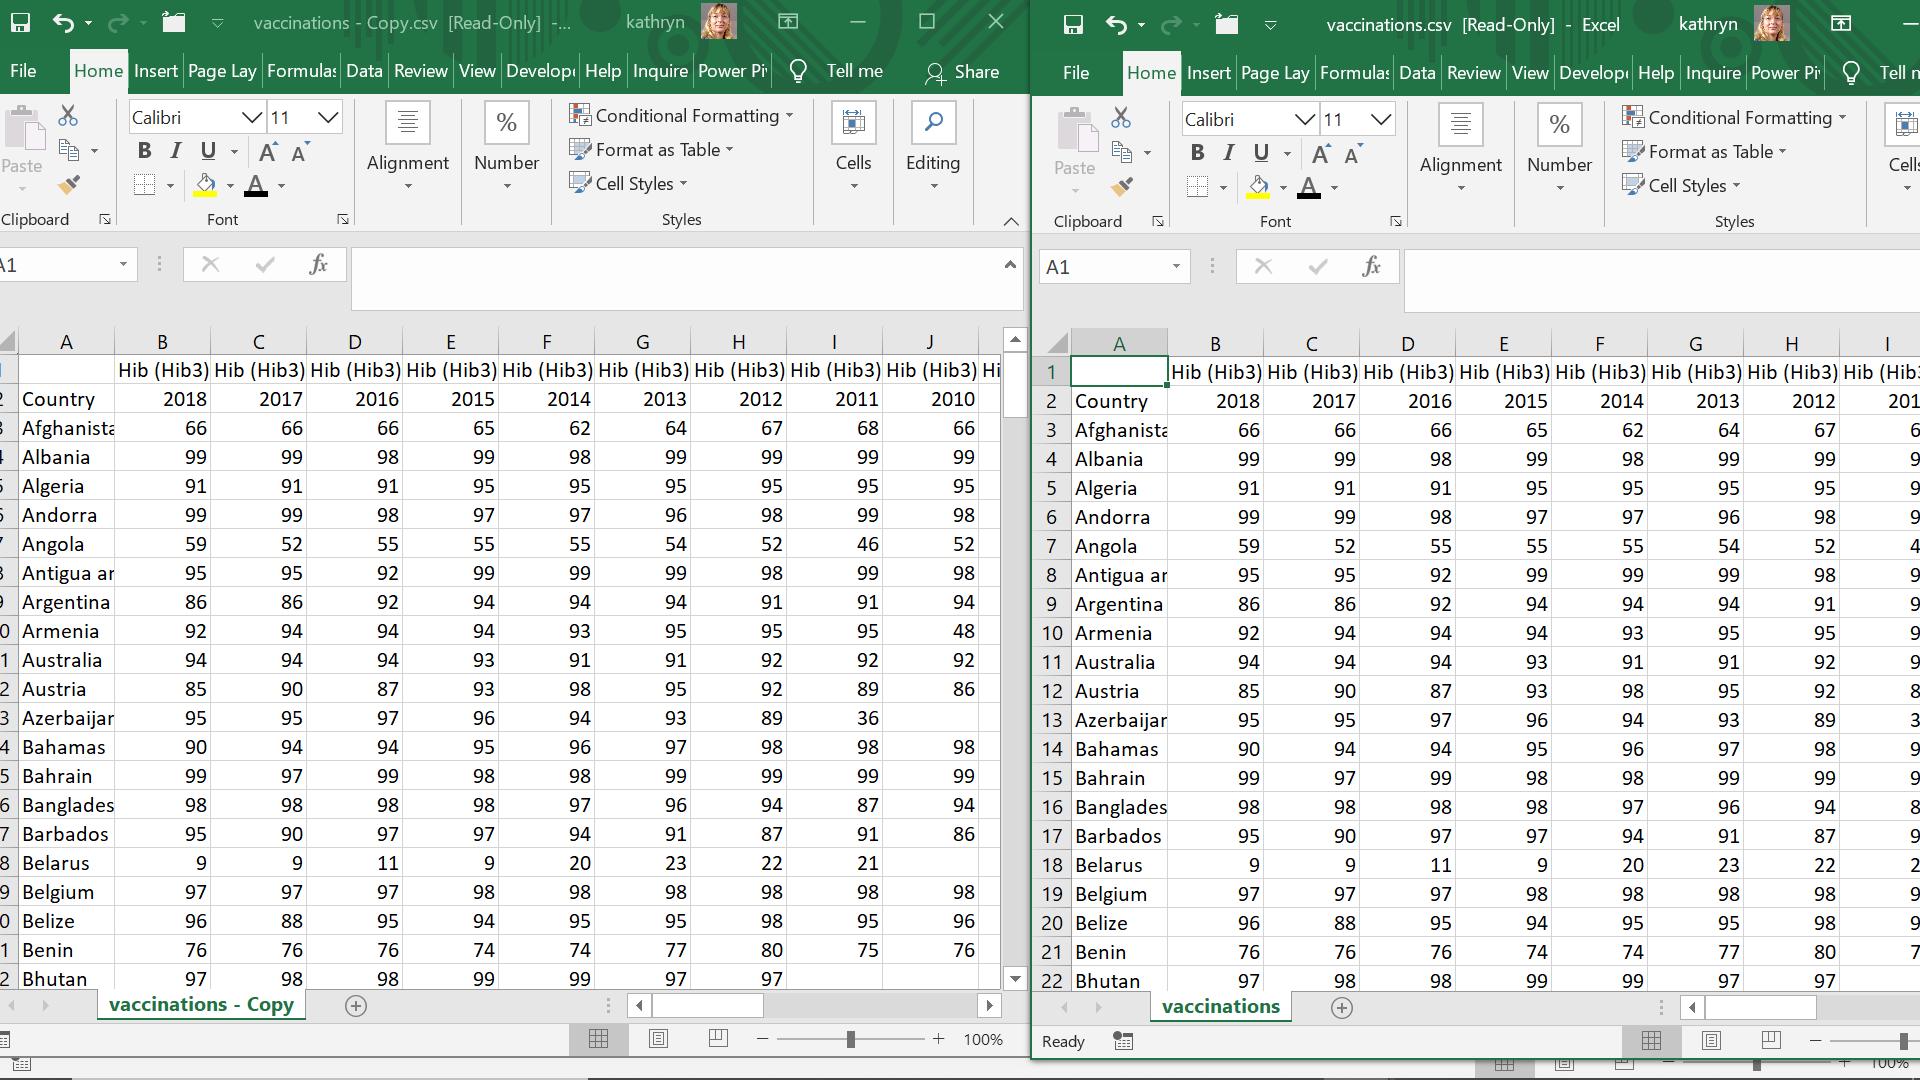
This week, I am looking at some vaccination data available from the WHO: I have two versions of the data, and I want to detect the differences.
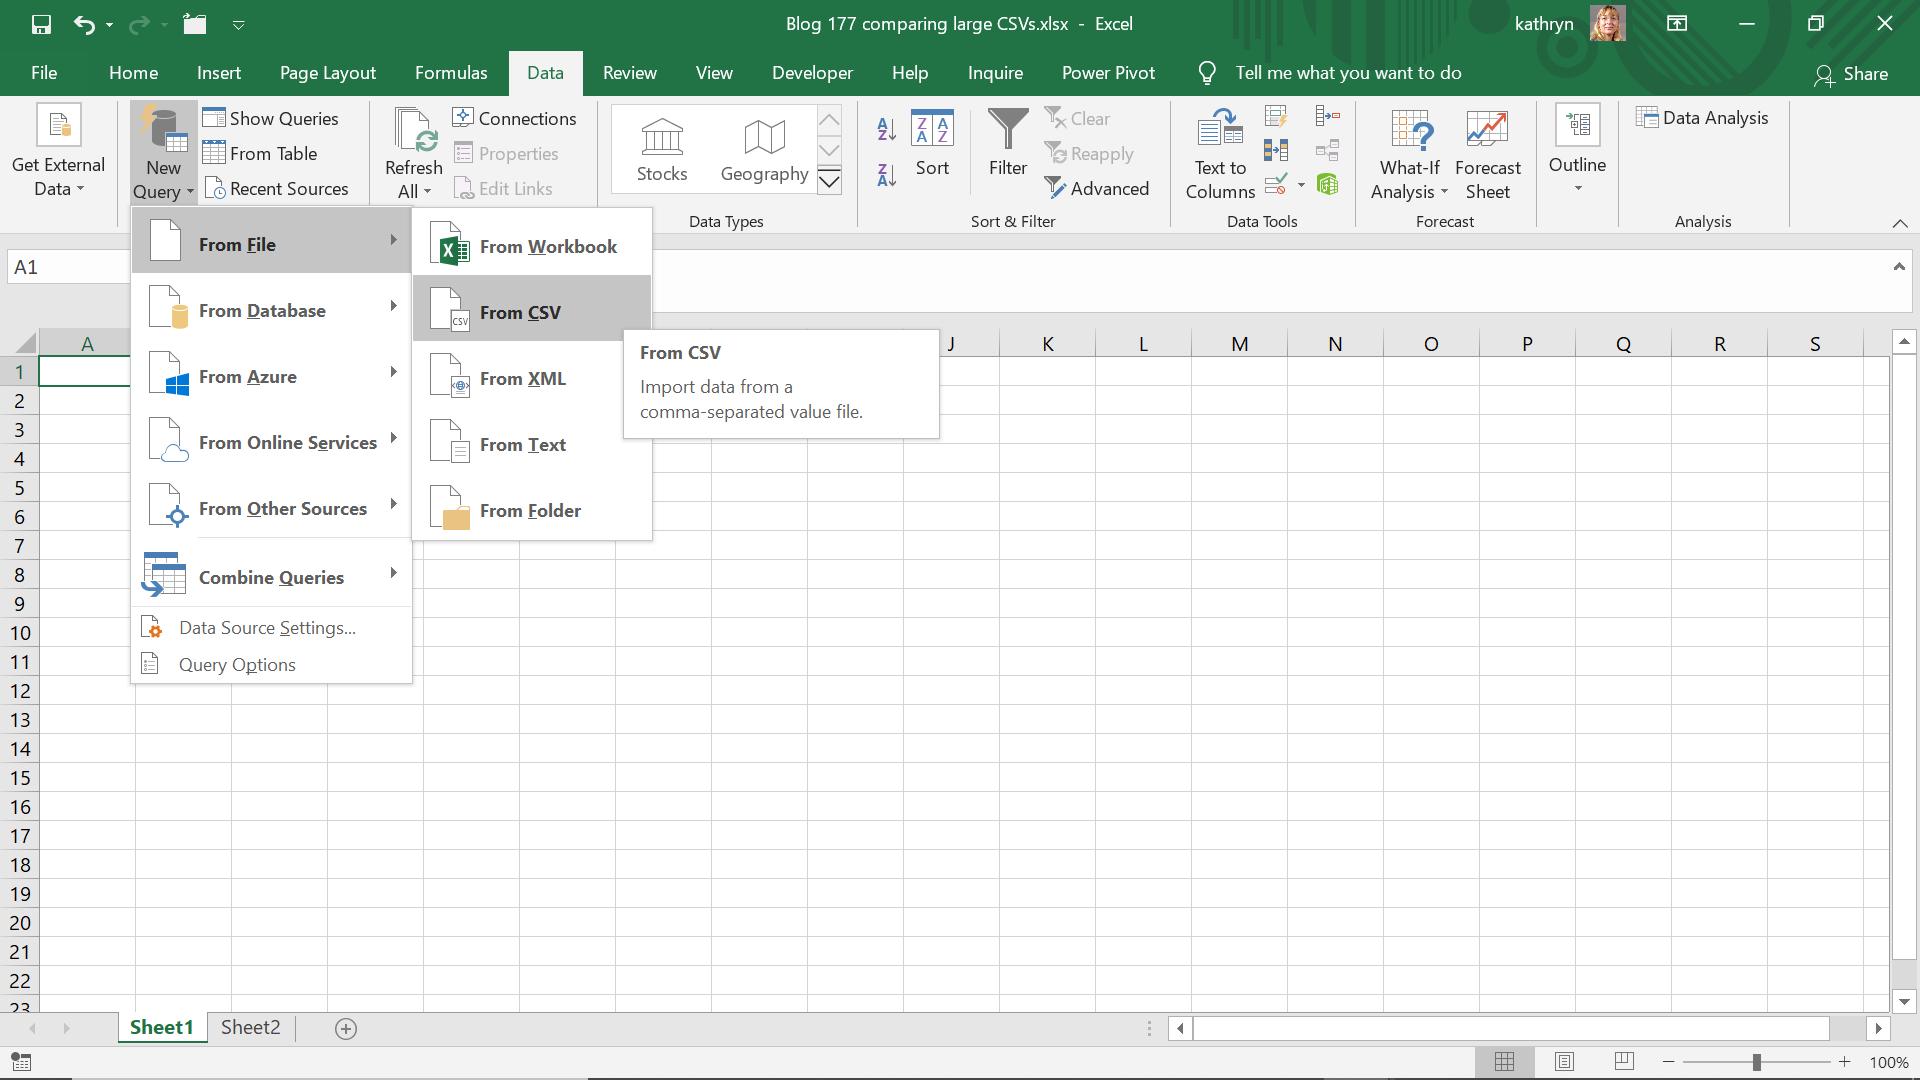
I begin by extracting my first CSV file to Power Query by using ‘From CSV’ on the ‘From File’ section of the ‘New Query’ option in the ‘Get & Transform’ section of the ‘Data’ tab (that’s a mouthful!).
I find the CSV file and import it.
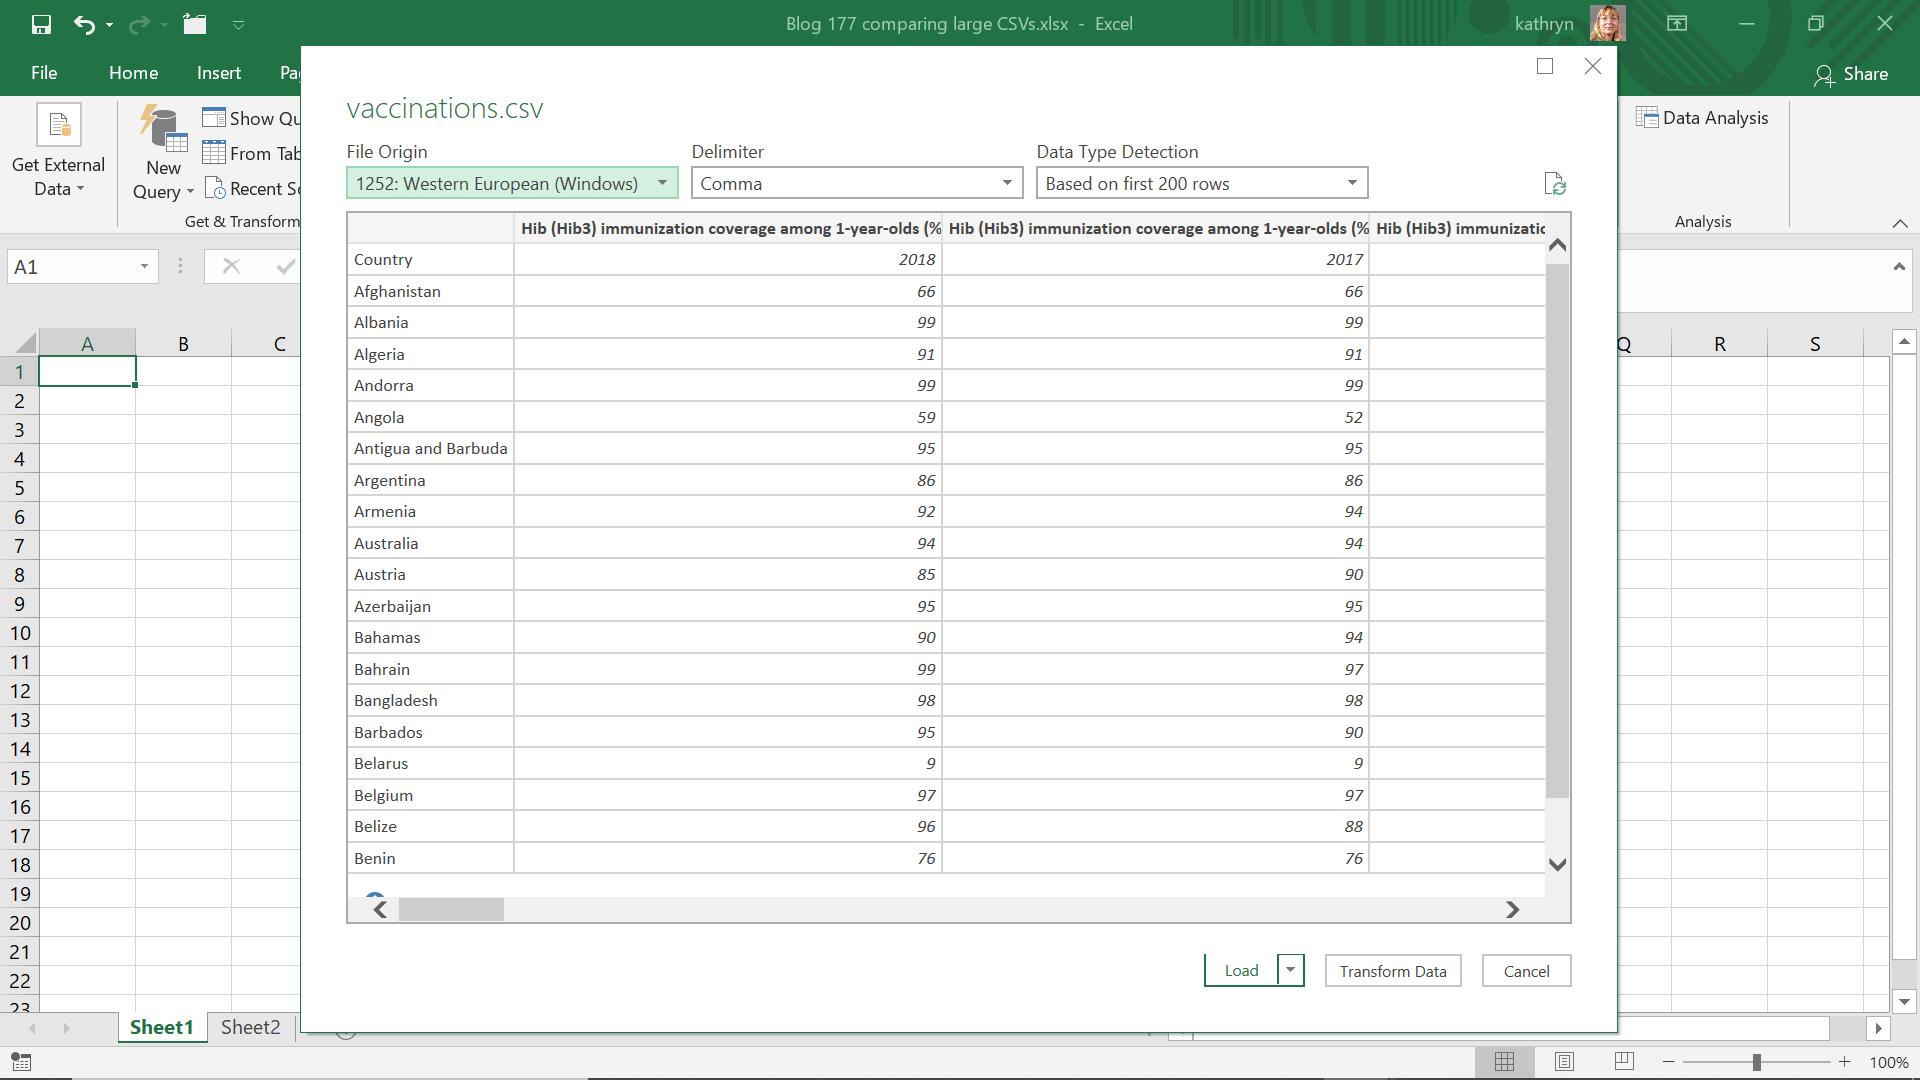
I select ‘Transform Data’ so that I may select choose to load it.
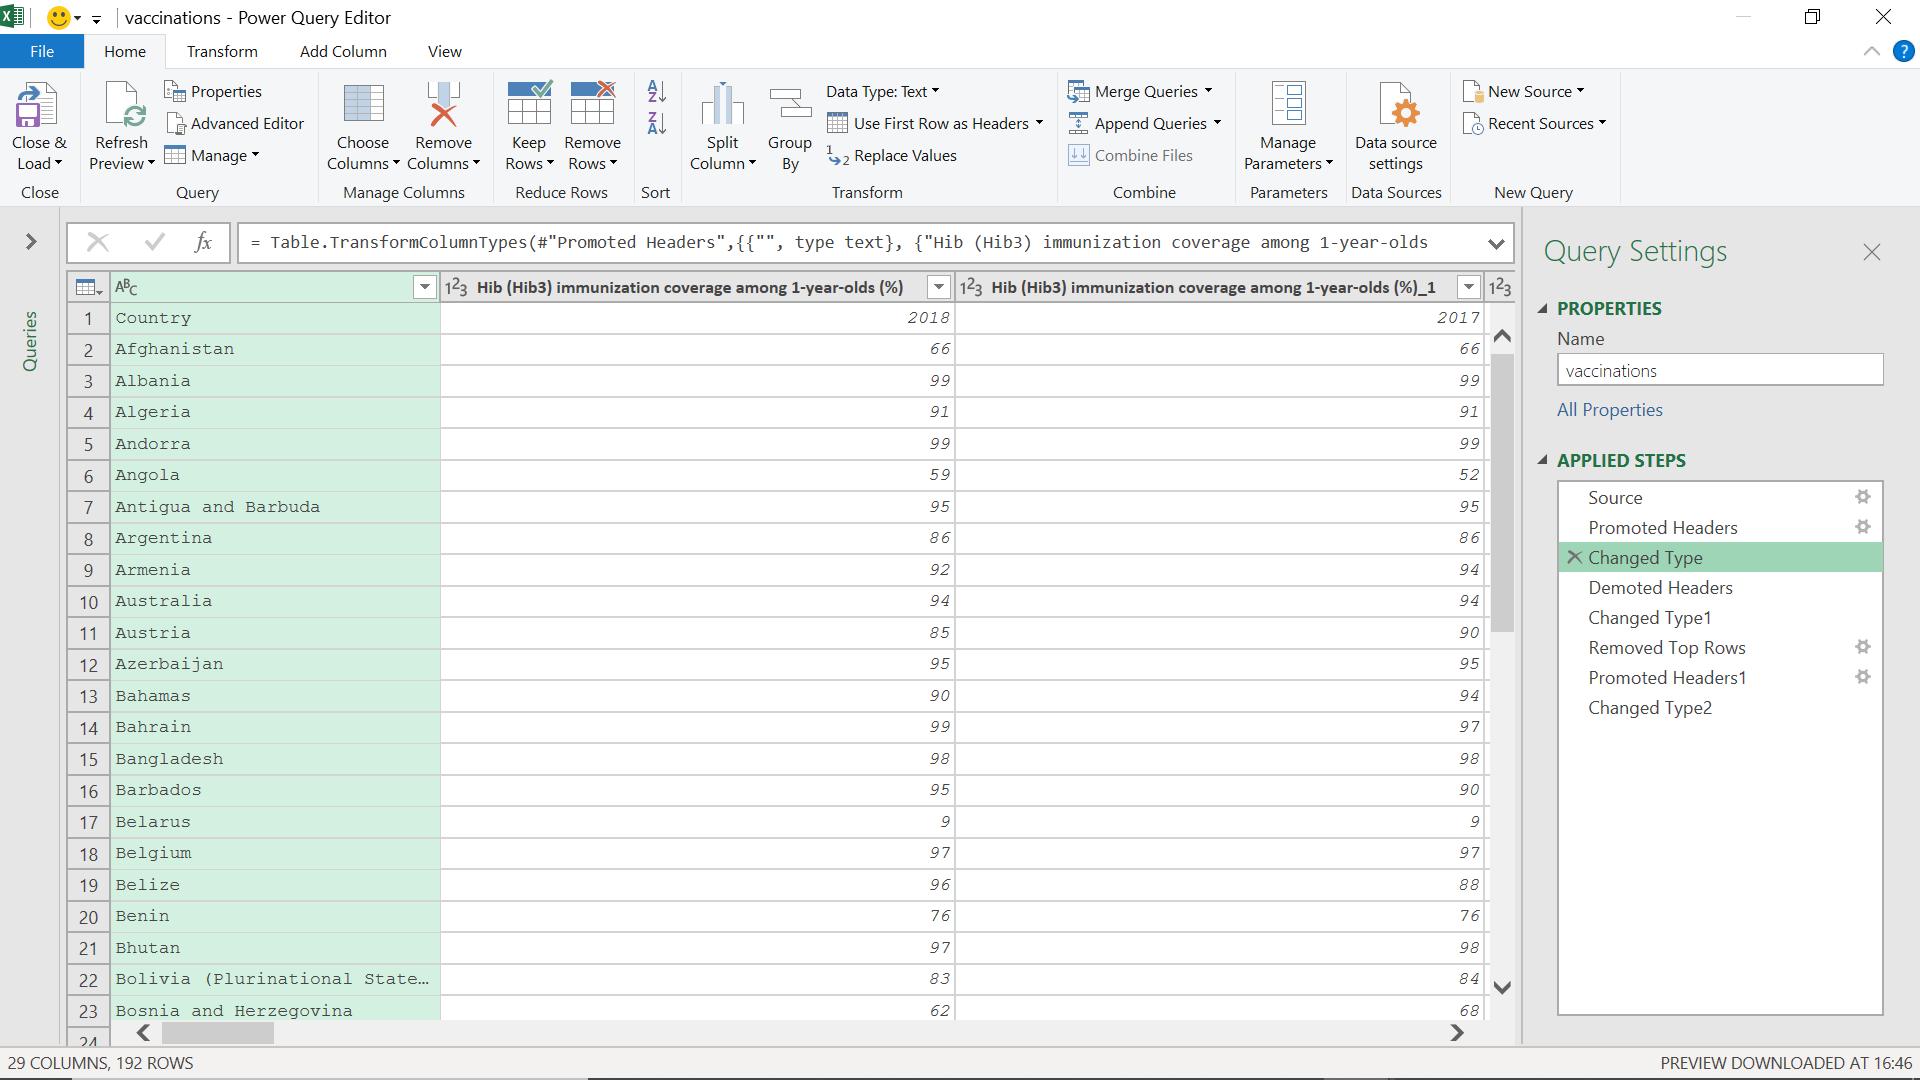
My data is initially extracted, with the top row automatically promoted to headers. However, I don’t want to use this row as my headers. Thus, I demote this row.
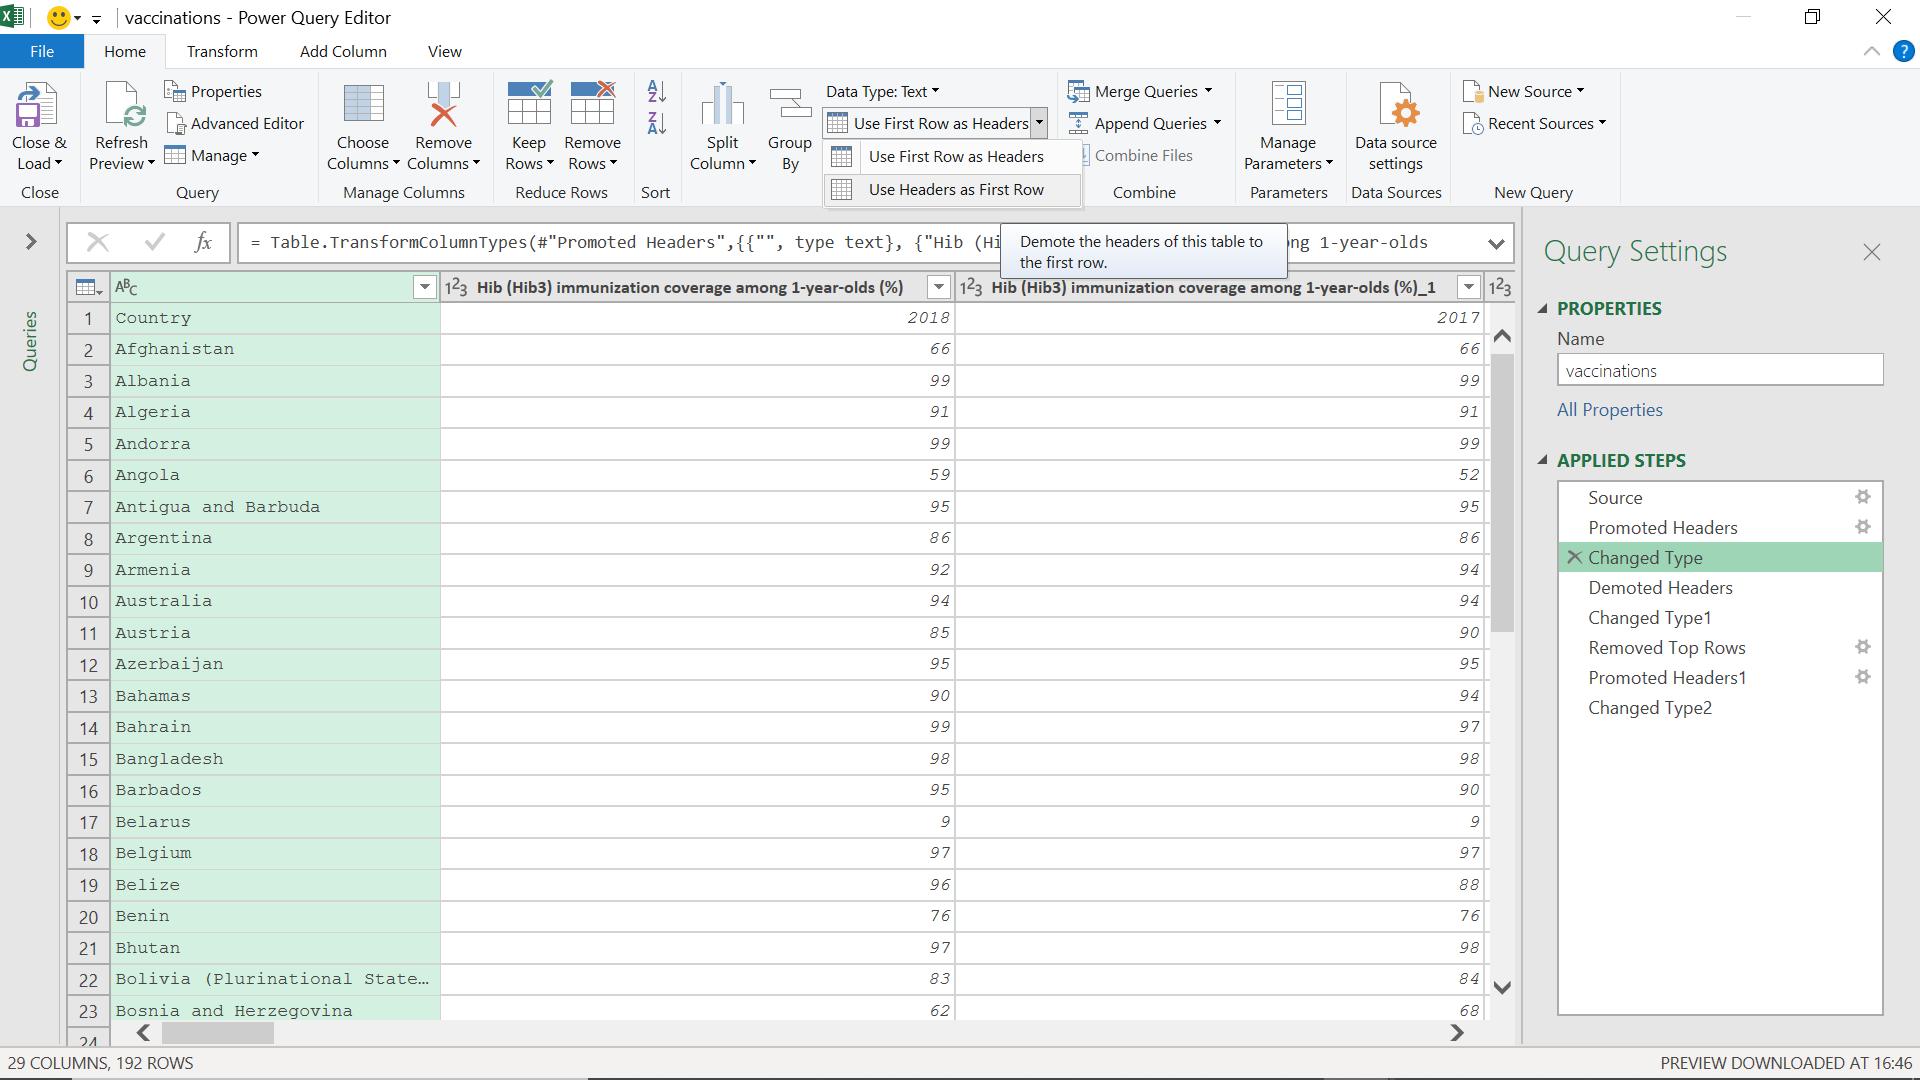
I can do this from the Home tab on the ‘Use First Row as Headers’ dropdown. ‘Using Headers as First Row’ demotes the headers accordingly.
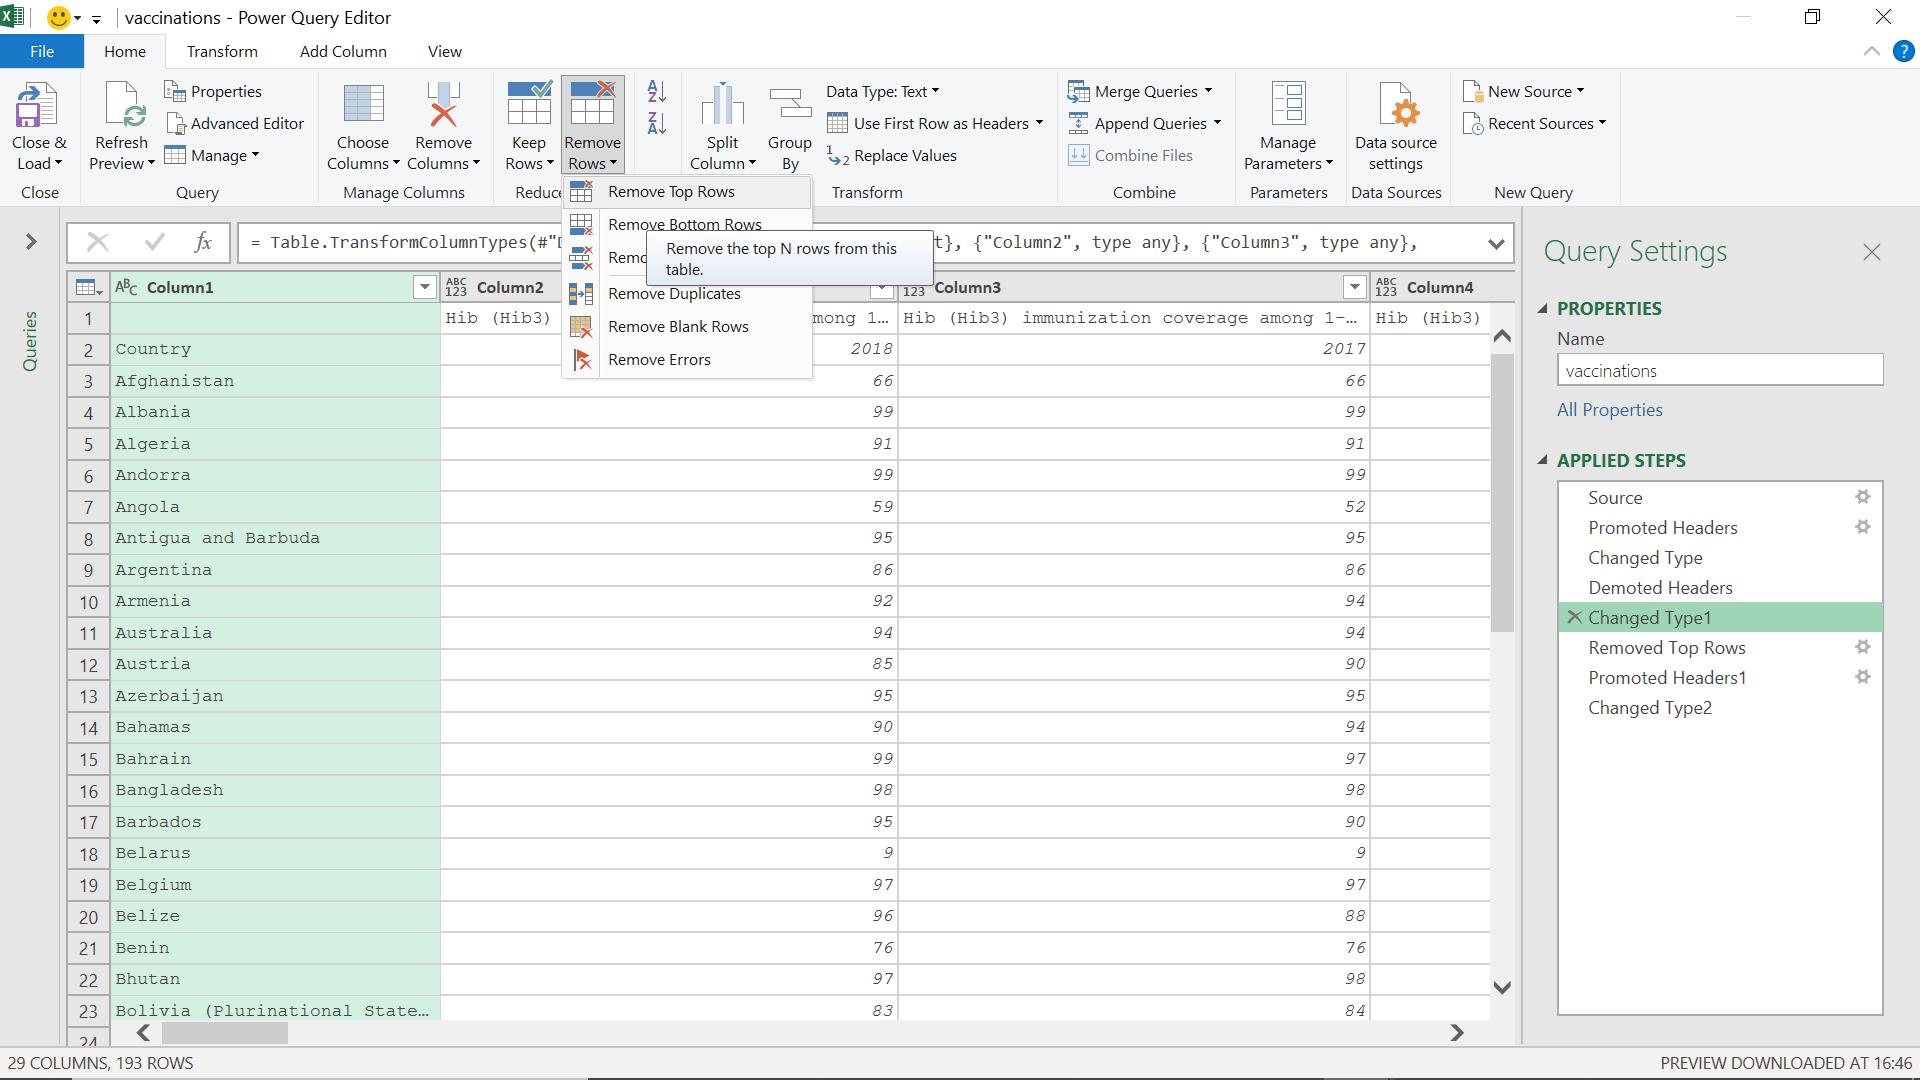
I remove the first row using the ‘Remove Top Rows’ option on the ‘Remove Rows’ dropdown.
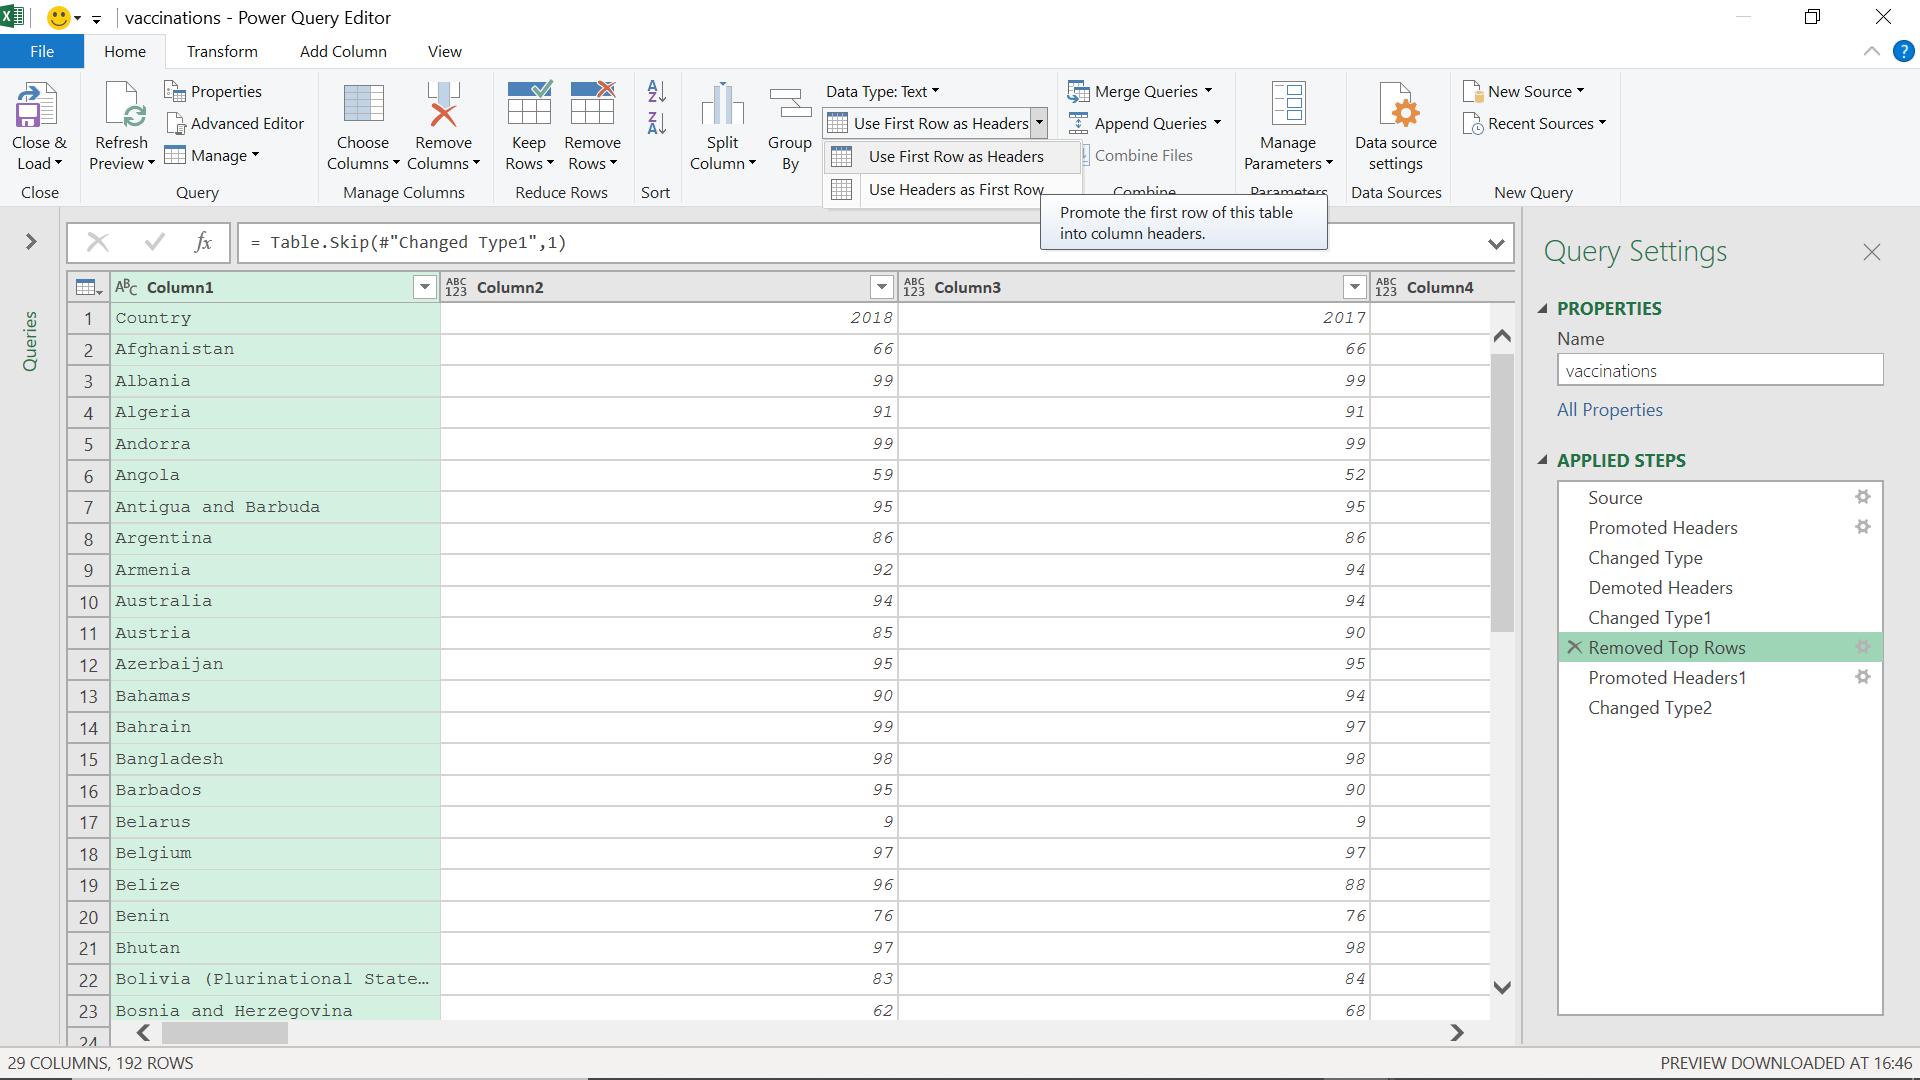
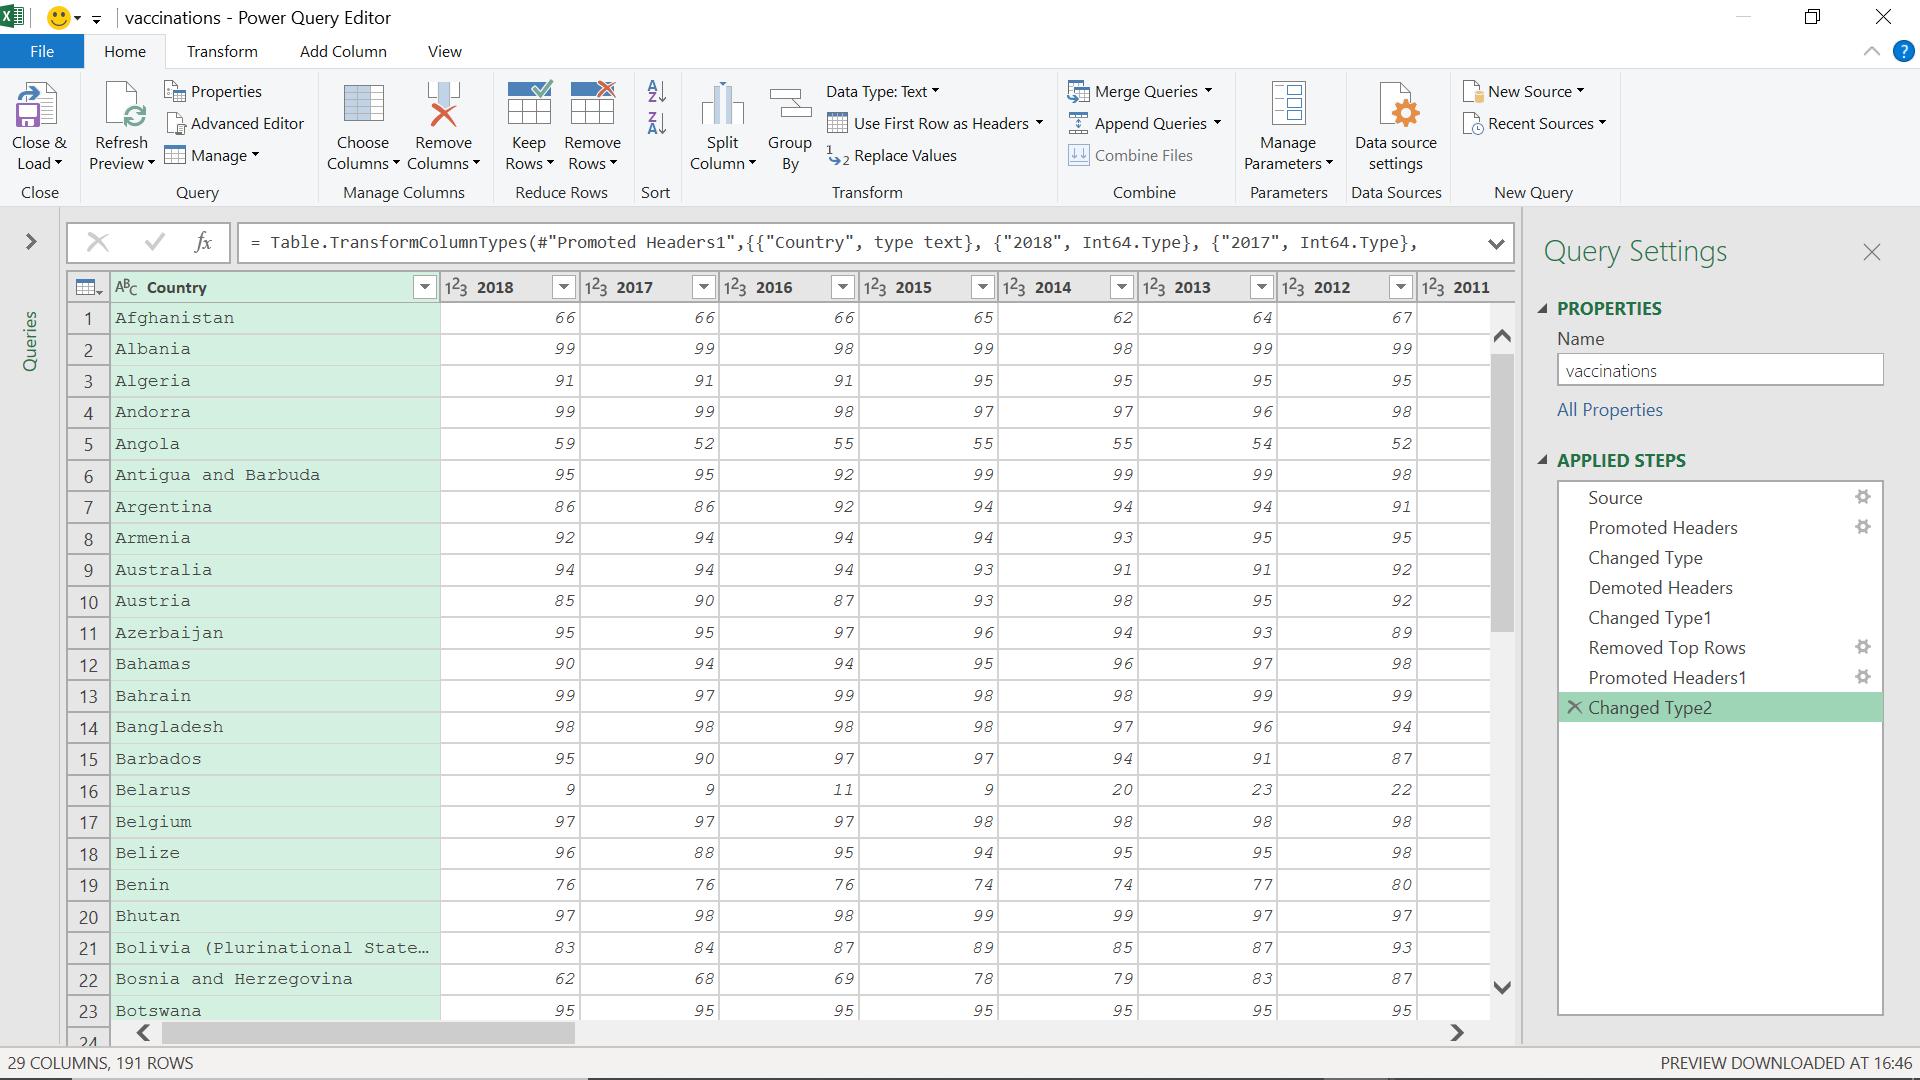
I promote the new top row into headers using the ‘Use First Row as Headers’ option.
I close and load this query as ‘connection only’ since I do not need the overhead of loading it to the workbook.
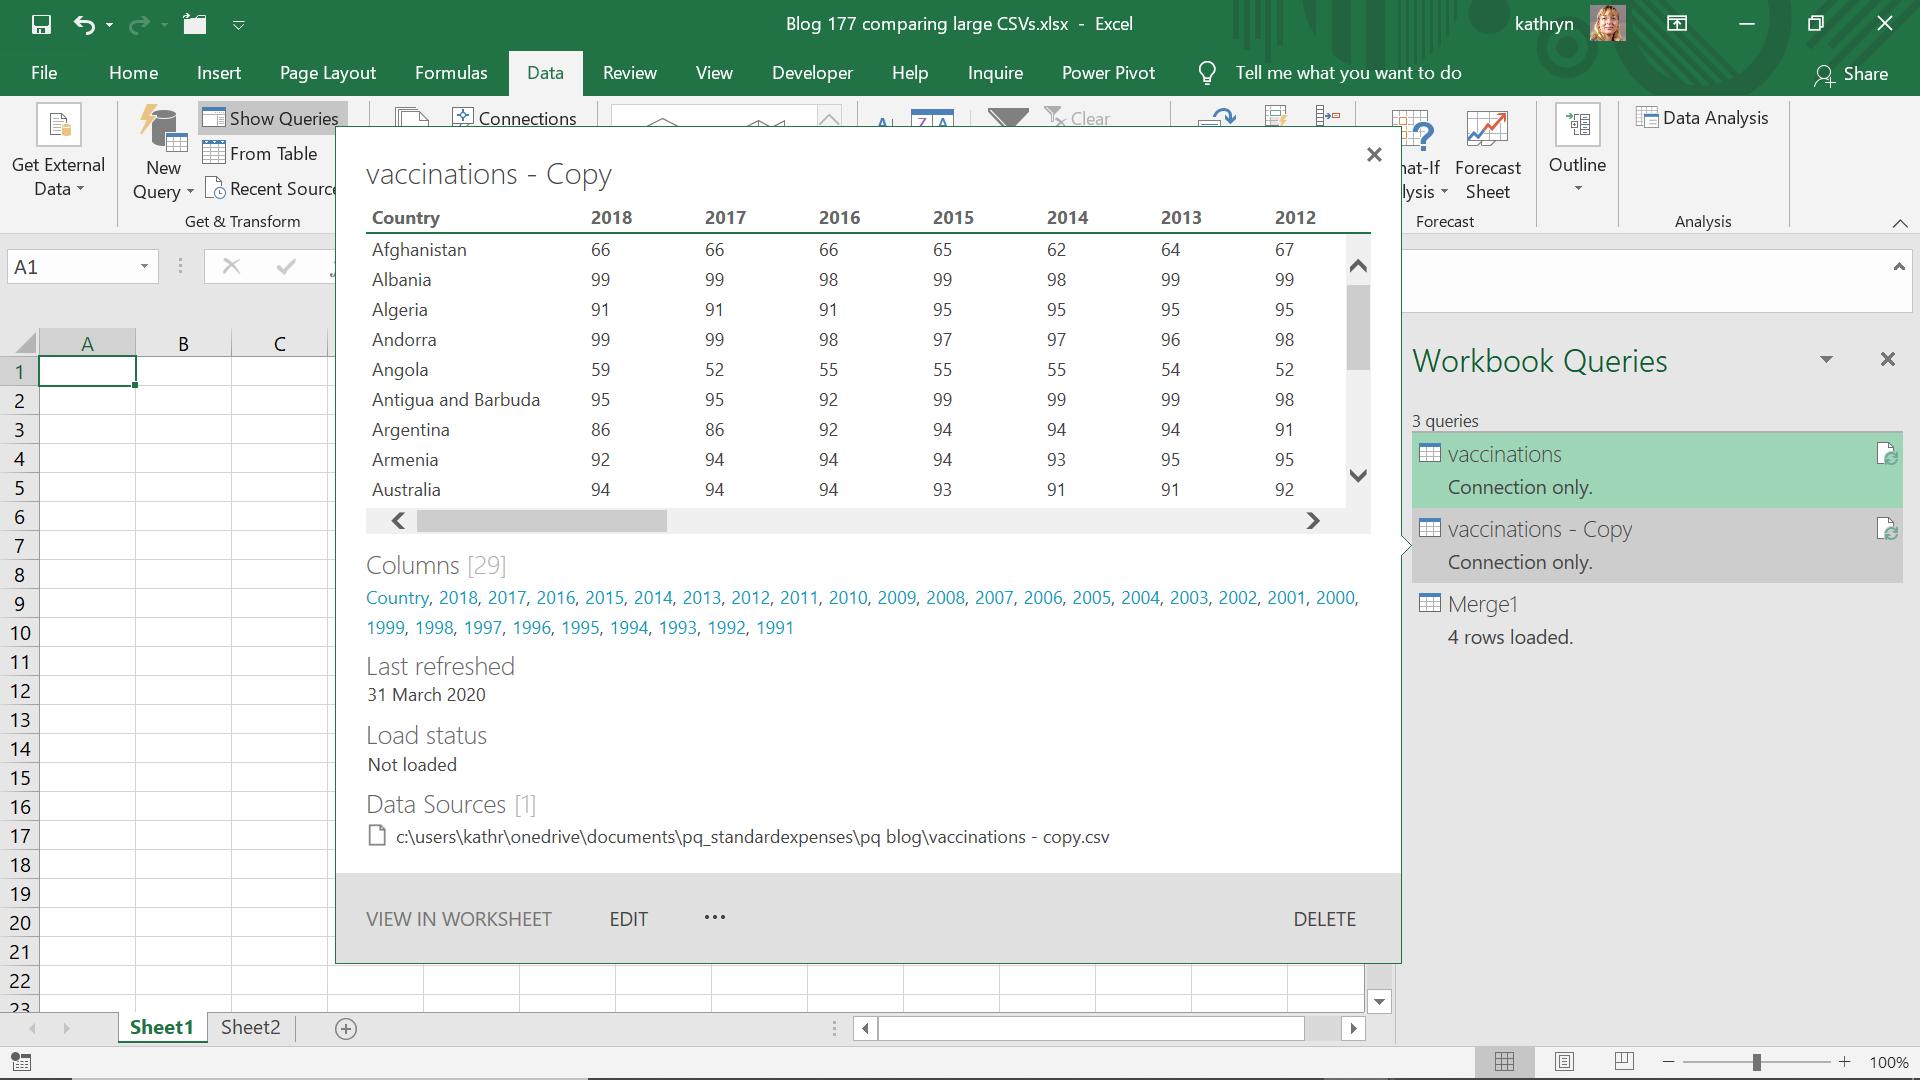
I create a similar query for the ‘vaccinations – Copy’ CSV.
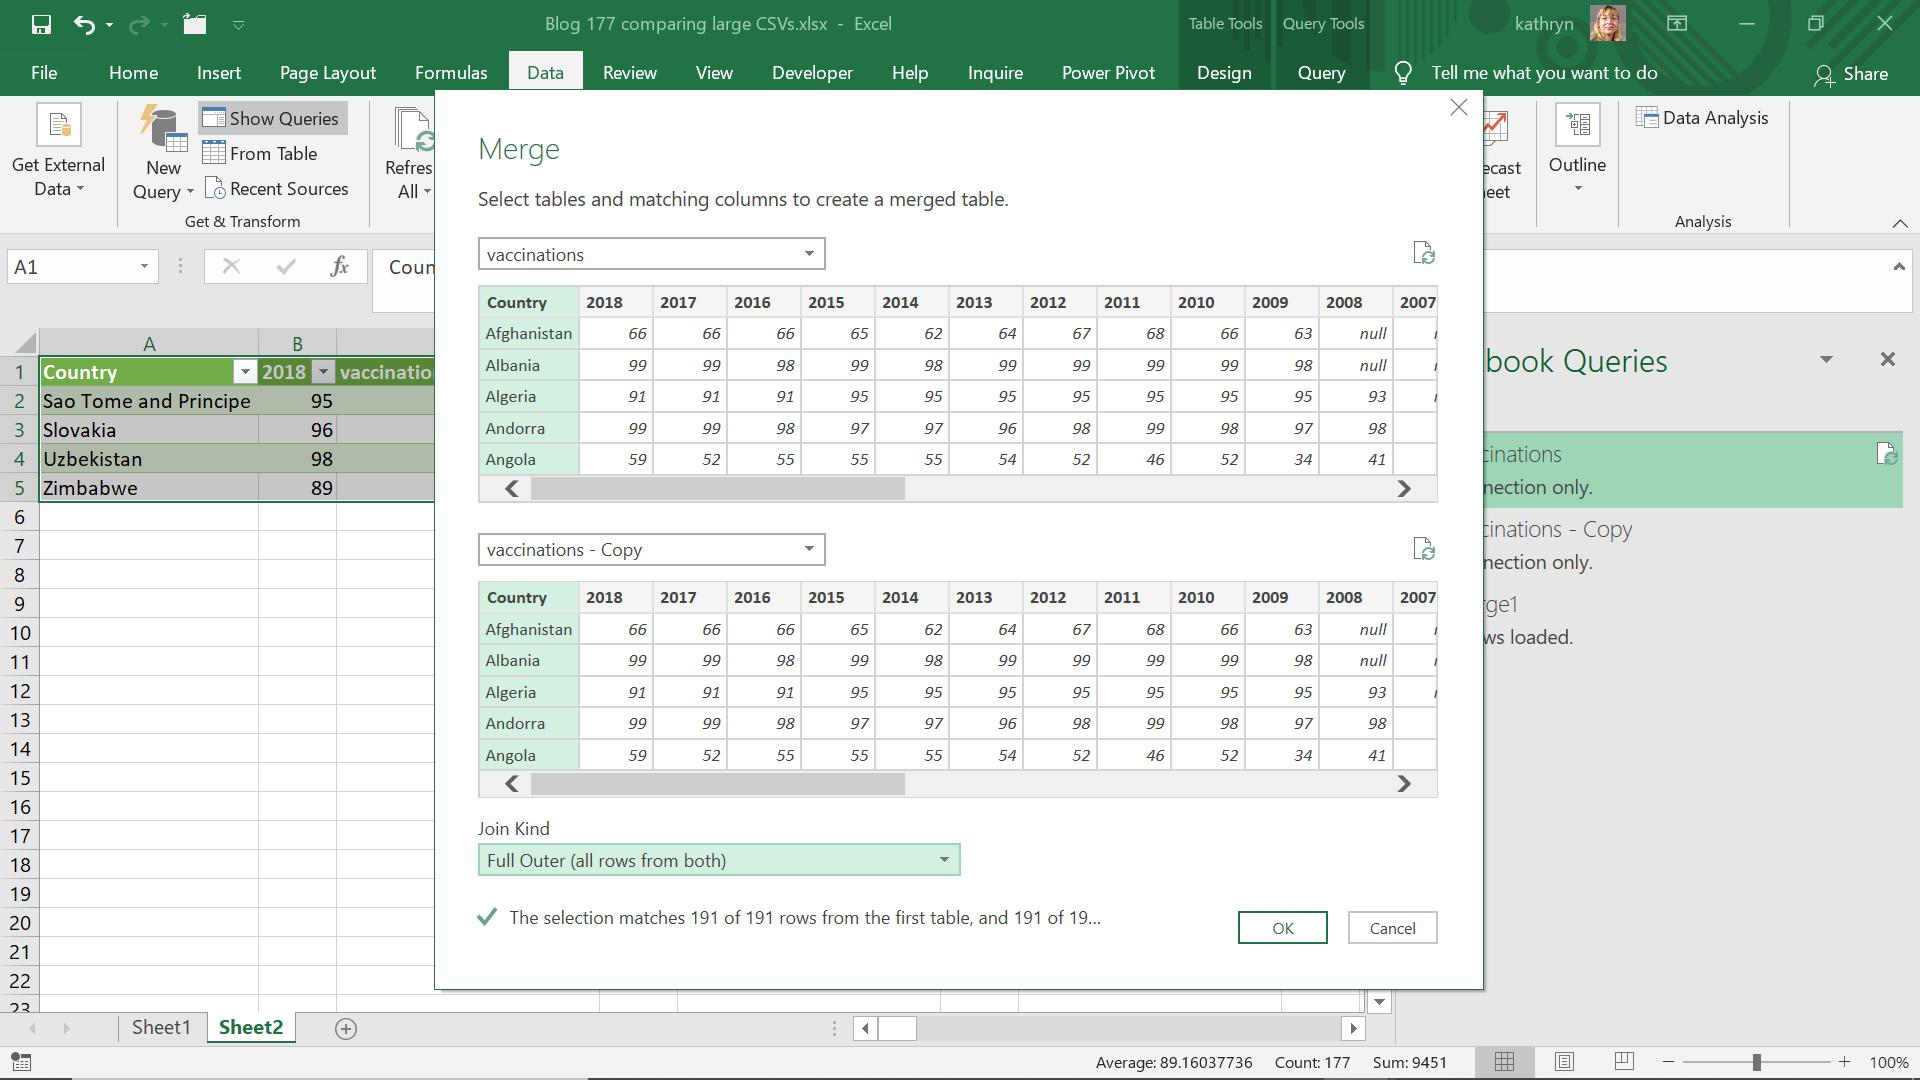
I merge my queries using a full outer join so that I have all rows in case any exist in one query but not the other. I use Country to merge my queries.
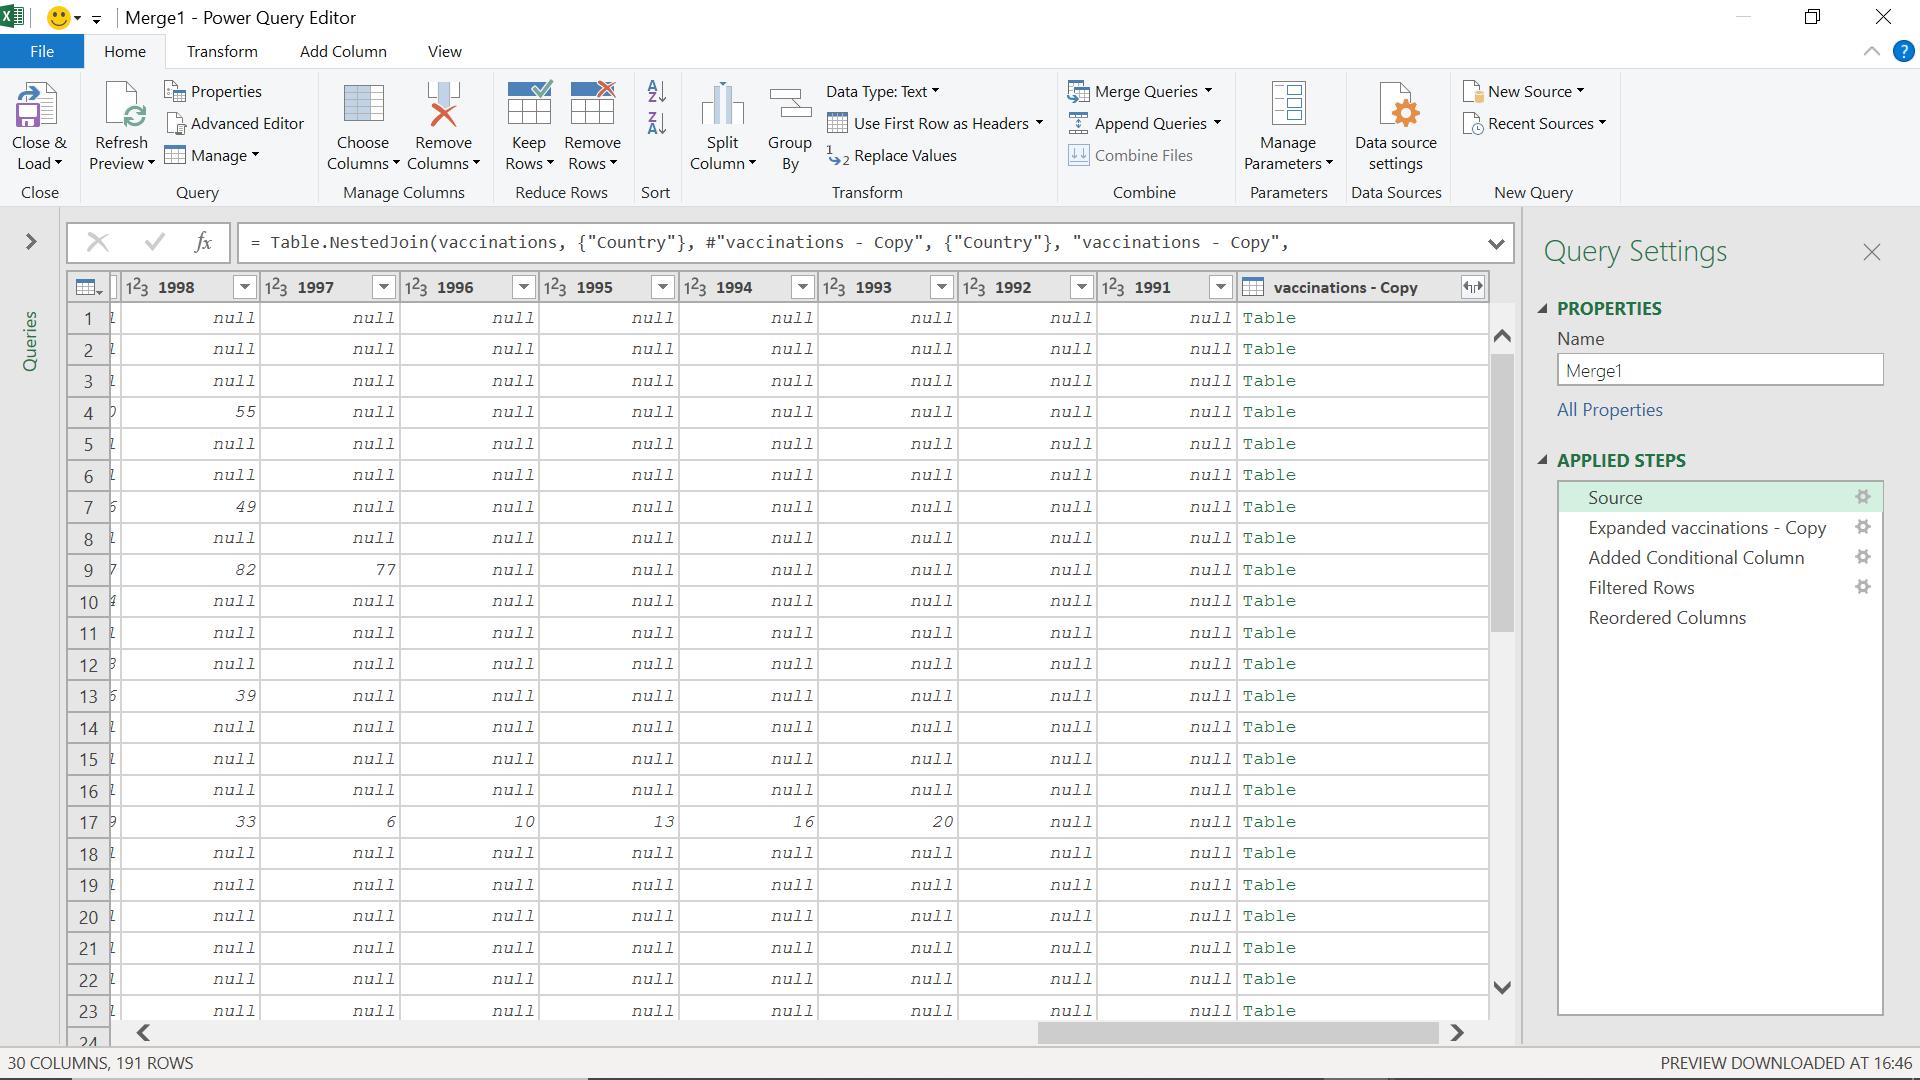
This gives me all rows of ‘vaccinations’ and a column linking to ‘vaccinations – Copy’.
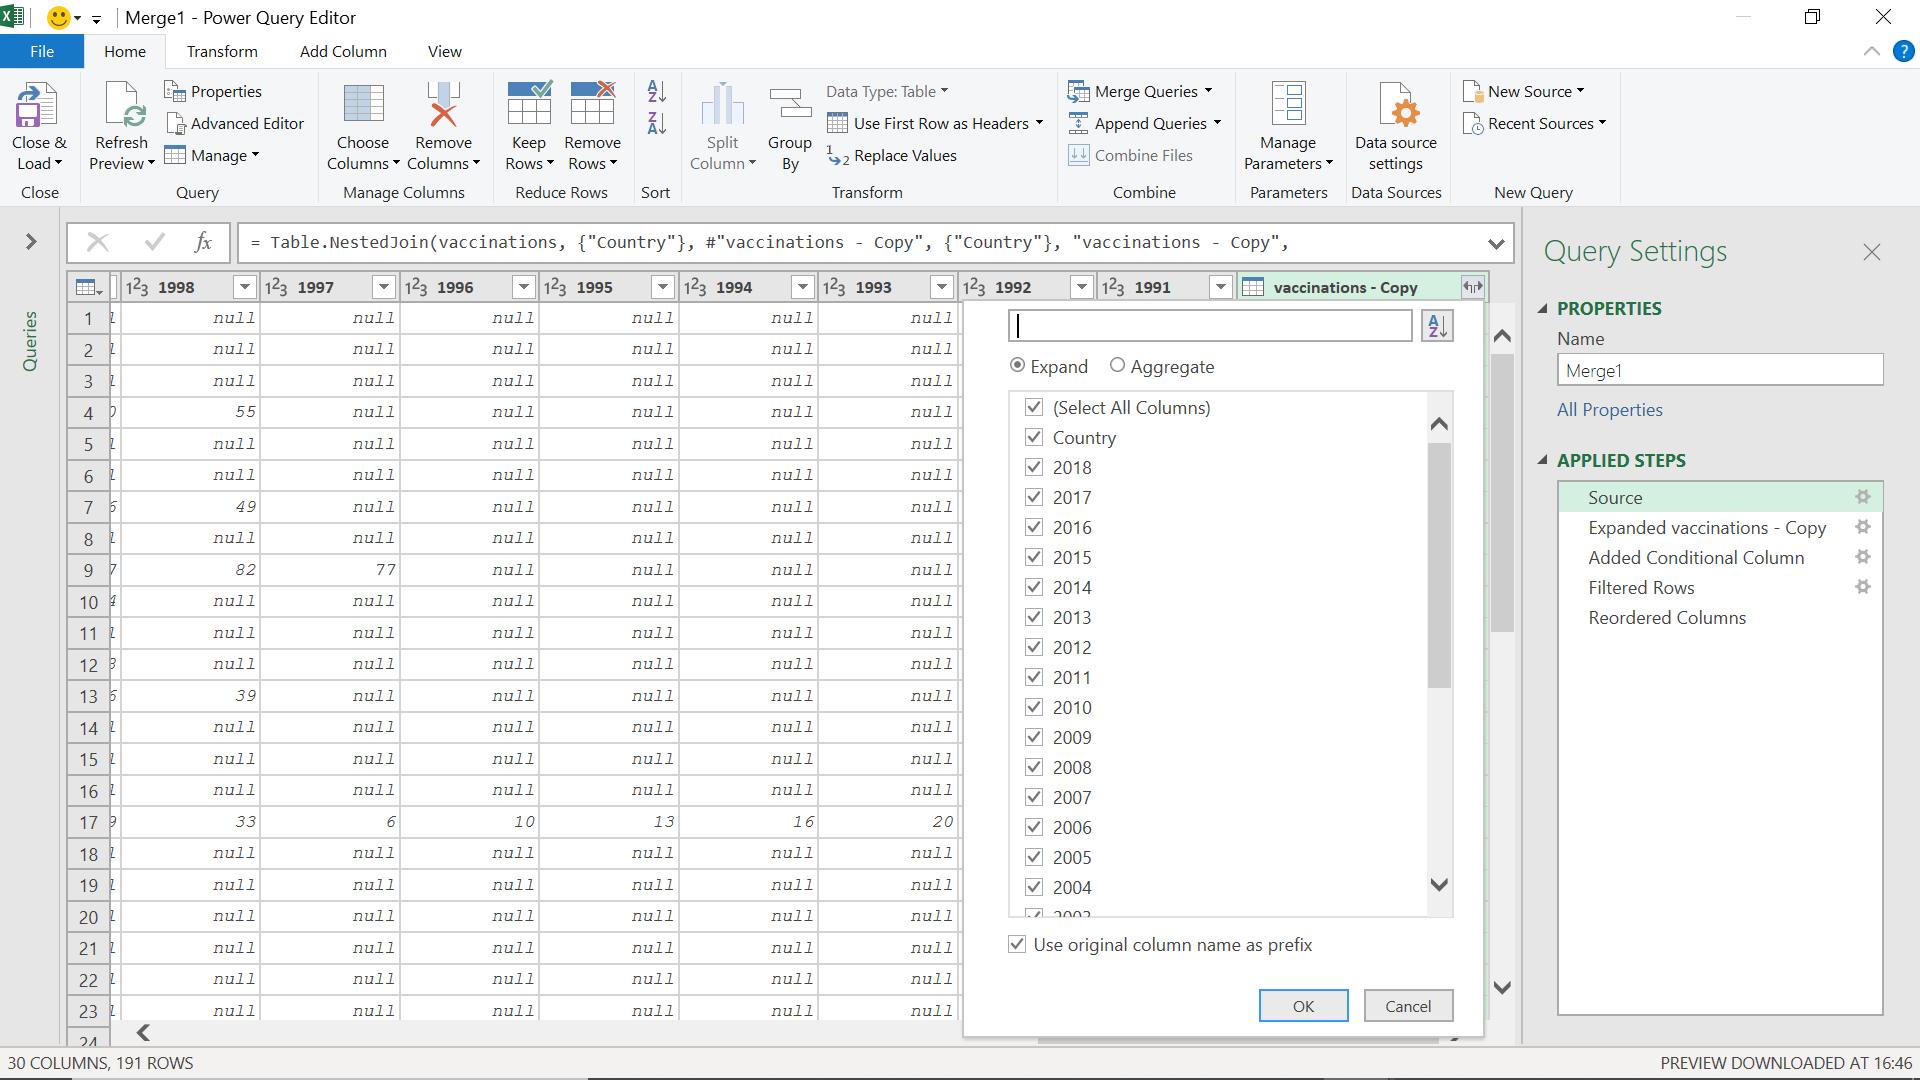
I expand vaccinations – Copy, using the column name as a prefix so I can distinguish between my similar columns.
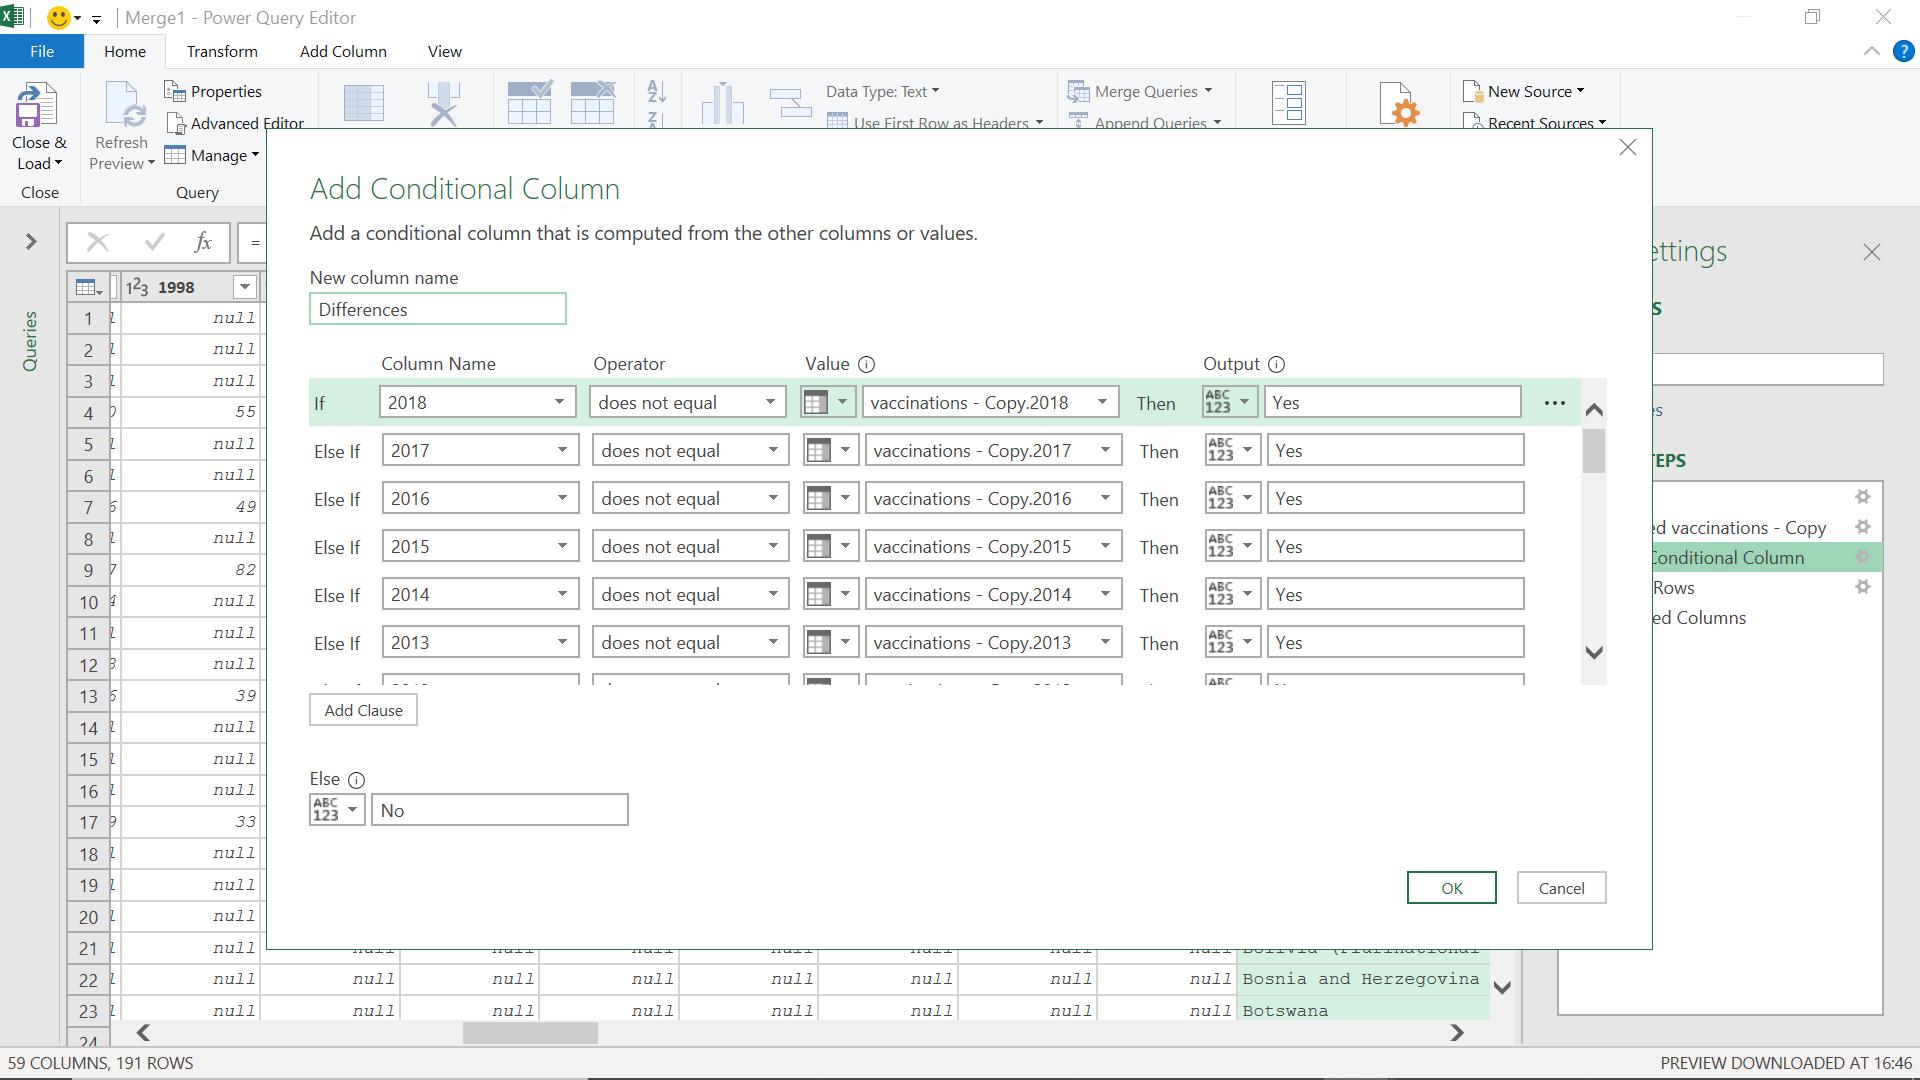
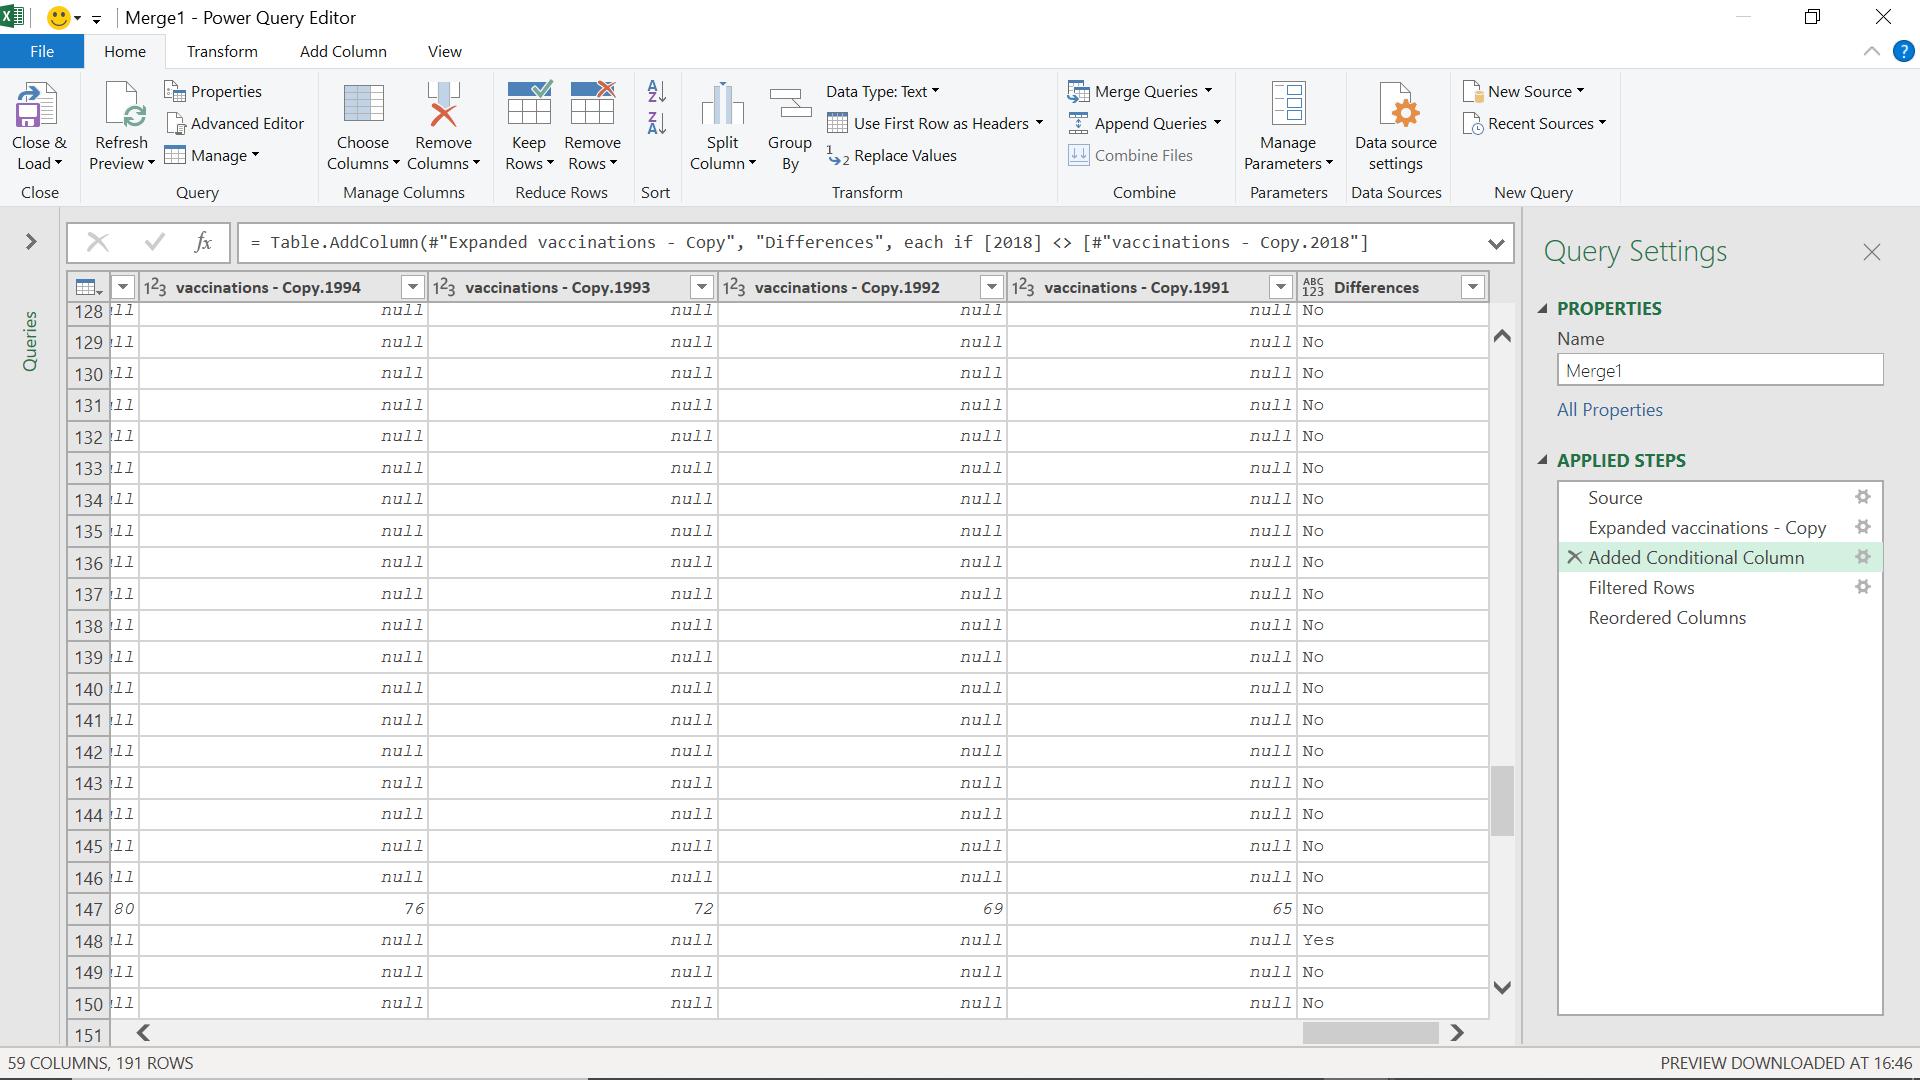
I need a column which will tell me if any of the year’s totals don’t match, so I add a conditional column from the ‘Add Column’ tab.
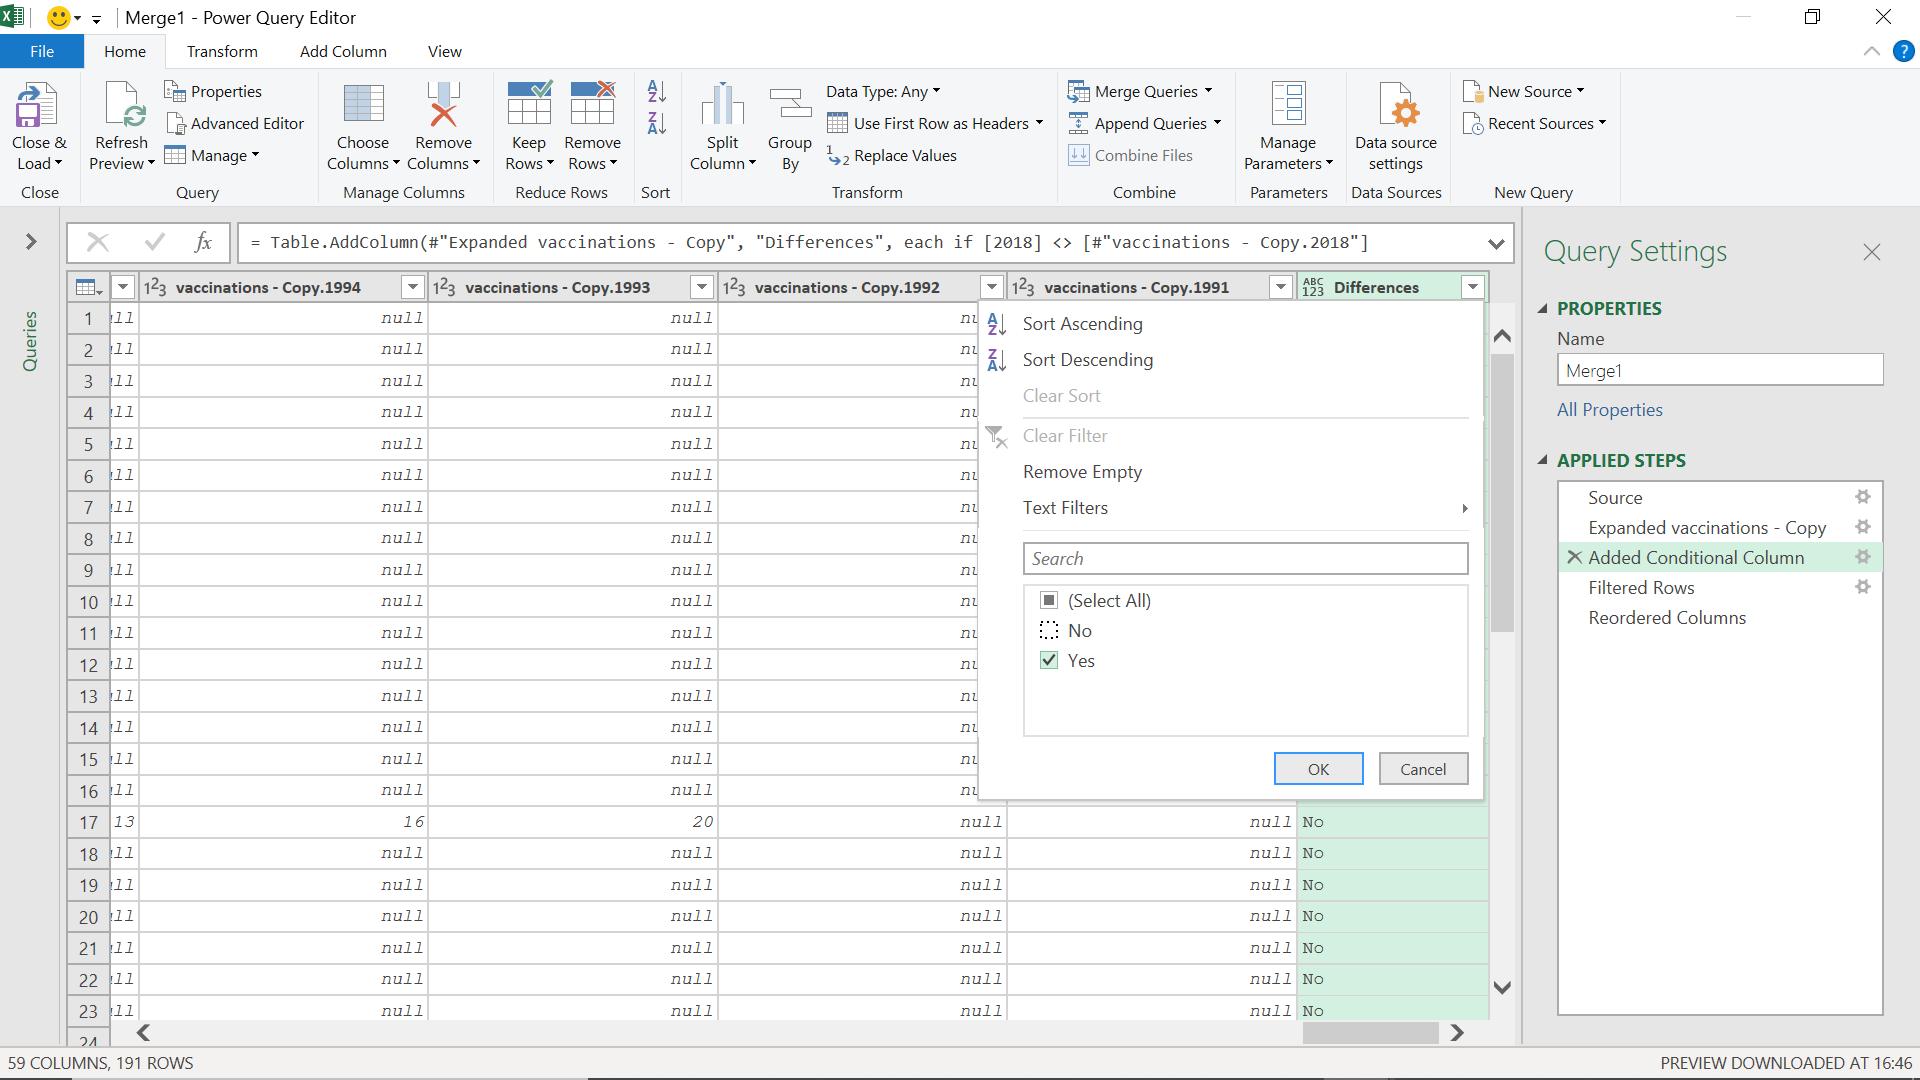
In order to see which rows have differences, I filter on Differences to select those rows where the value is ‘Yes’.
Once I have my rows, I reorder the columns to make it easier to see which columns have differences:
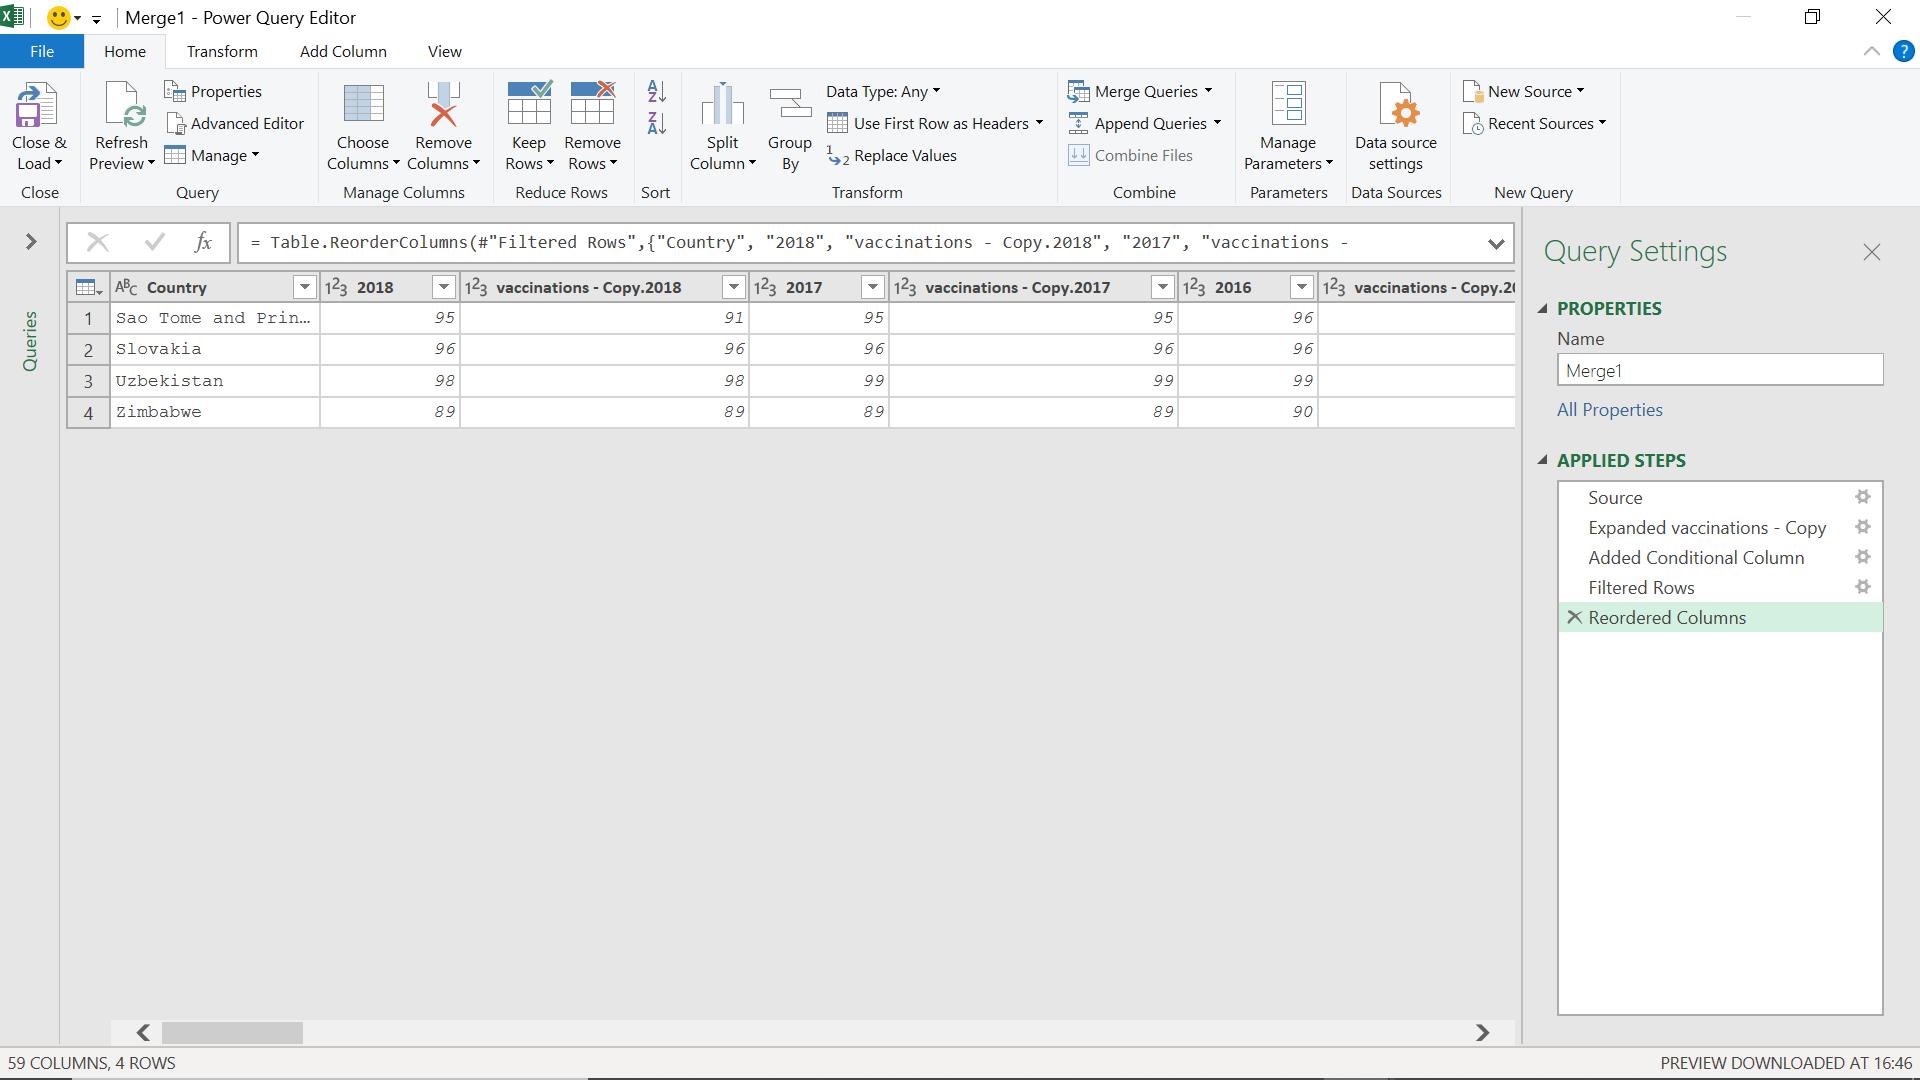
I can now see where the differences occur.
Come back next time for more ways to use Power Query!