
Power Query: Group Text
5 May 2021
Welcome to our Power Query blog. This week, I look at how to modify a grouping statement to accommodate text fields.
I have some data for my imaginary salespeople:
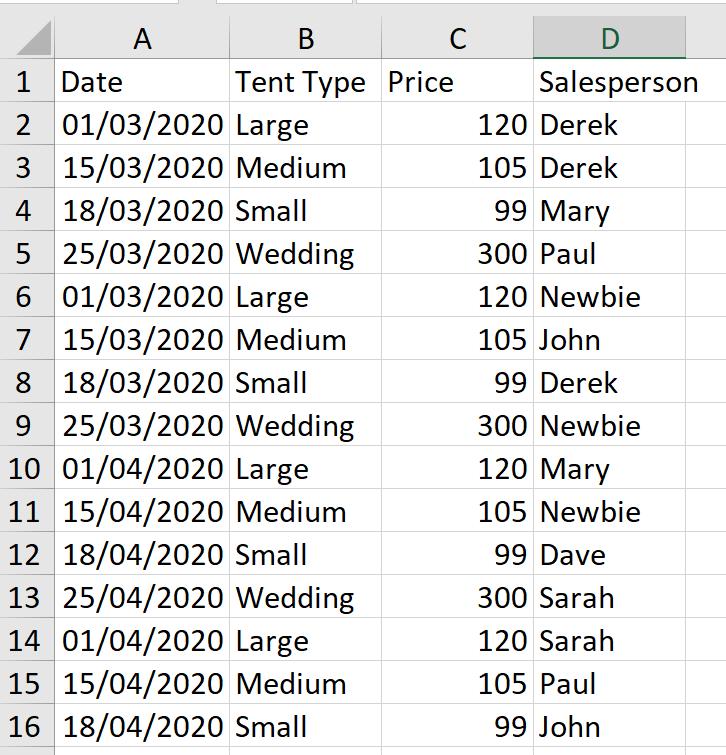
They have been selling off some of the old stock, and I want to see the sales figures for each tent type and who has sold it. I start by extracting my data into Power Query using ‘From Table / Range’ in the ‘Get & Transform Data’ section of the Data tab.
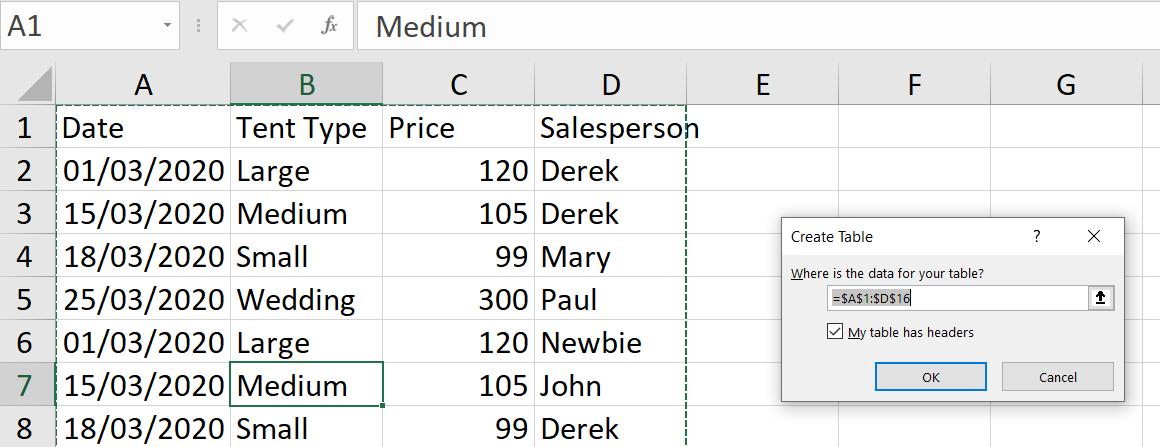
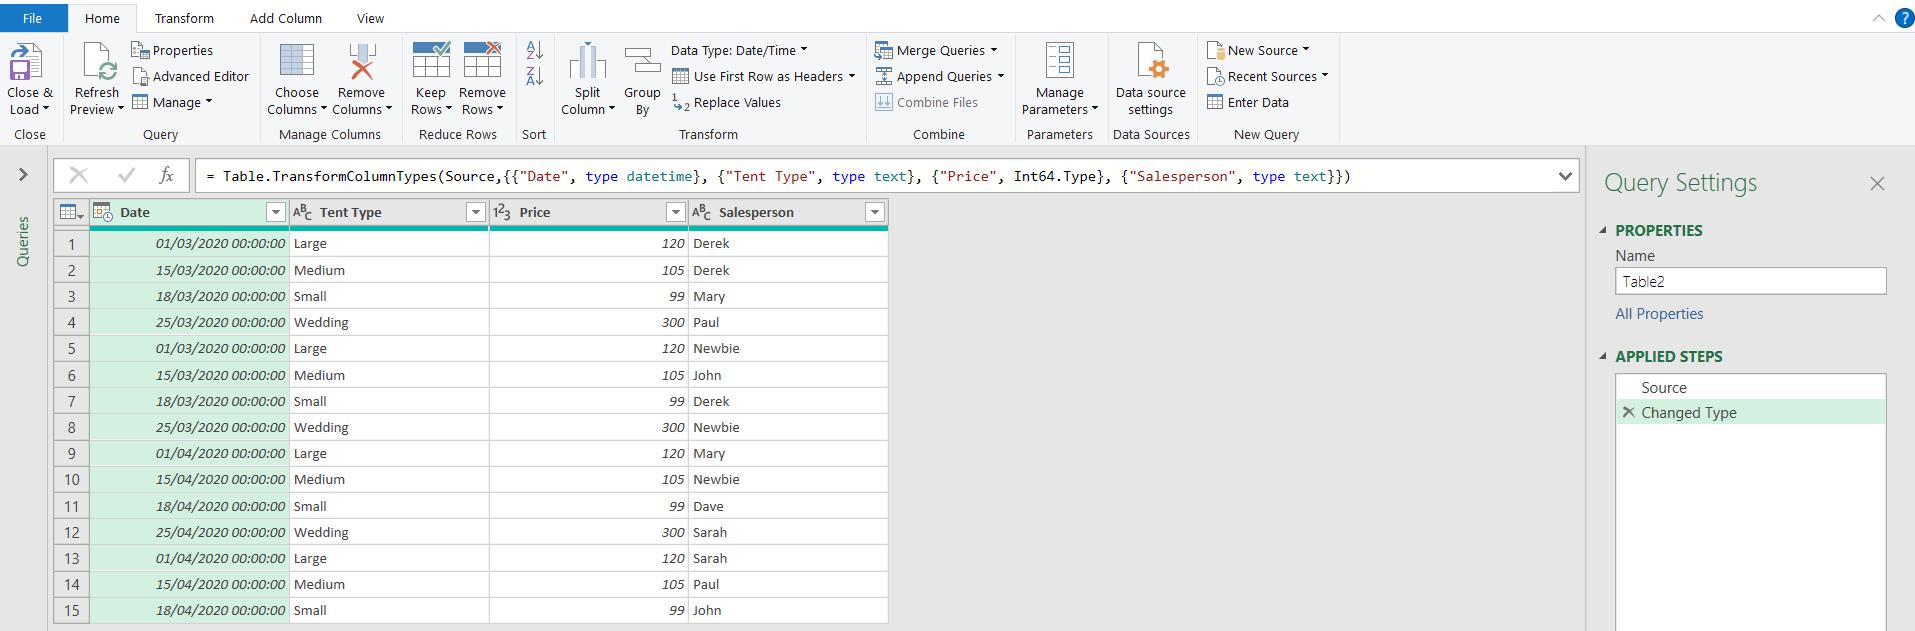
I accept the ‘Create Table’ defaults and view my data in the Power Query Editor.
I am going to group my data using the ‘Group By’ option on the Transform tab.
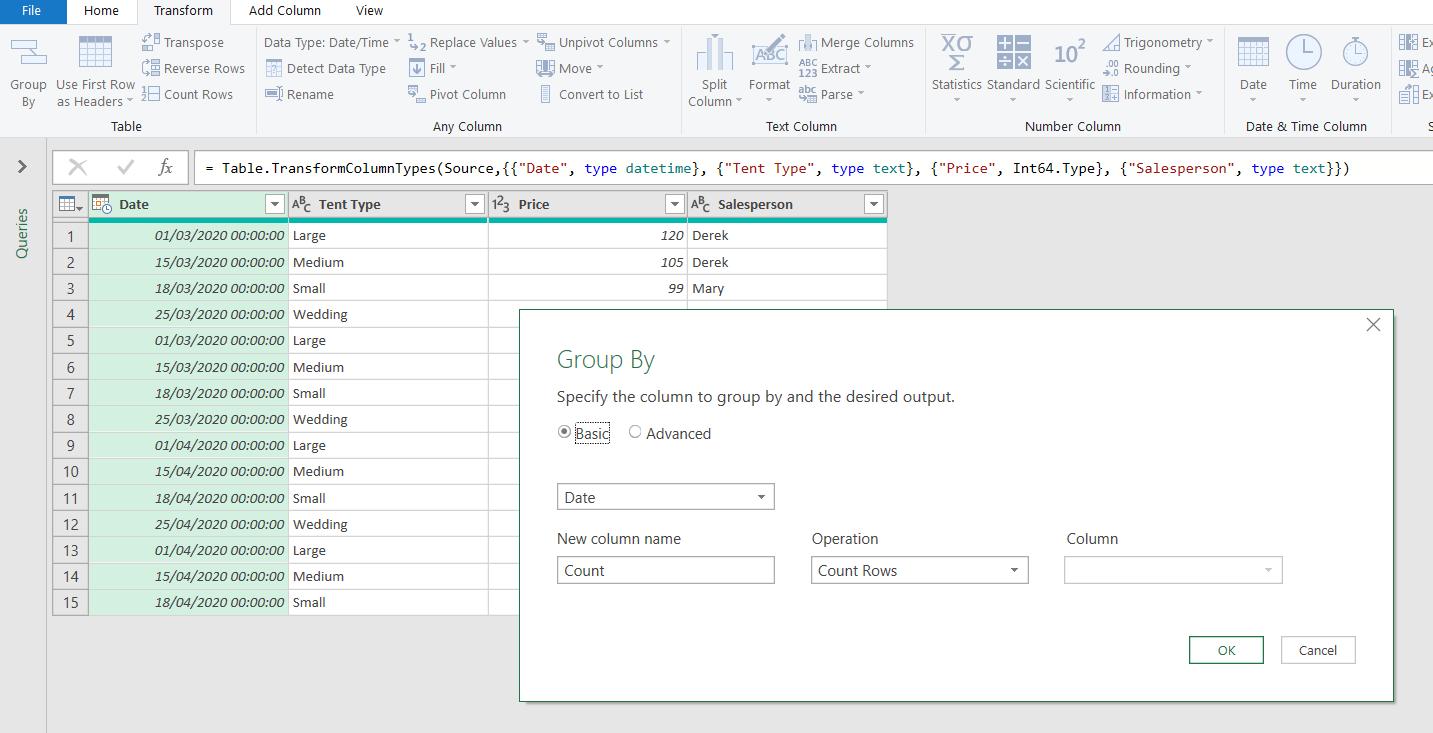
I want to group by Tent Type. To begin with, I want to see the sales totals:
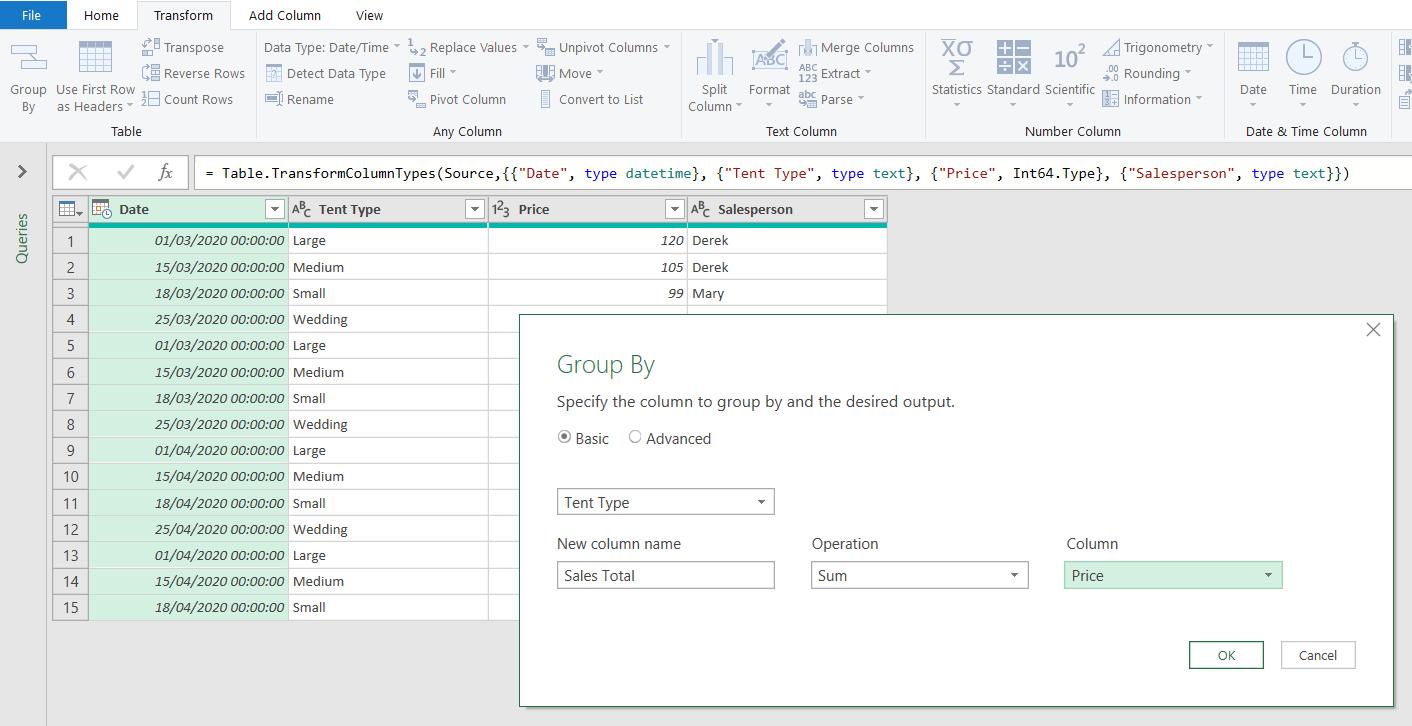
I can achieve this by grouping on Tent Type and summing Price.
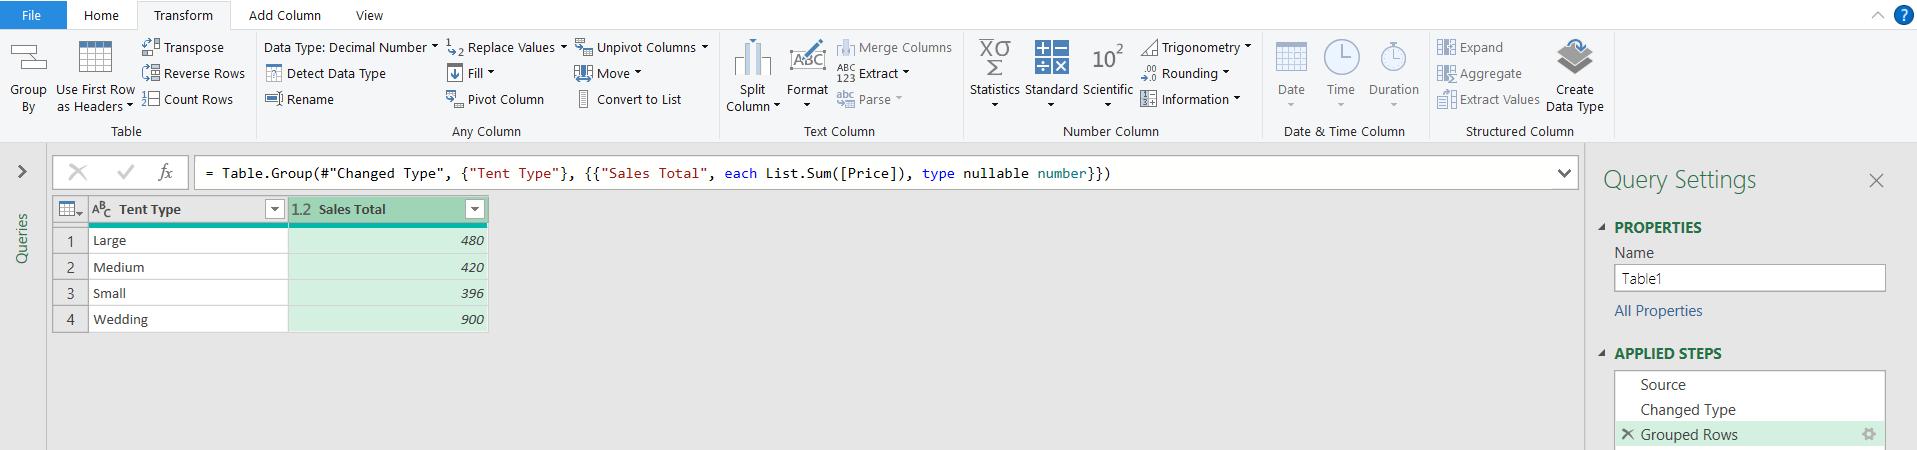
I also want to see which salespeople sold the tents. I go back to the ‘Grouped Rows’ step.
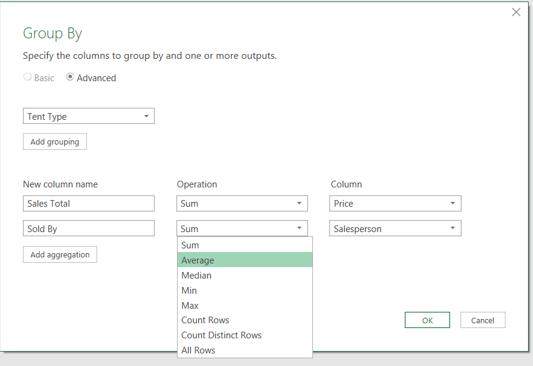
If I go into the ‘Advanced’ options, I can add another aggregation, but all the operations are aimed at numerical values. However, I am going to go ahead and use a sum, and then amend the M code produced.
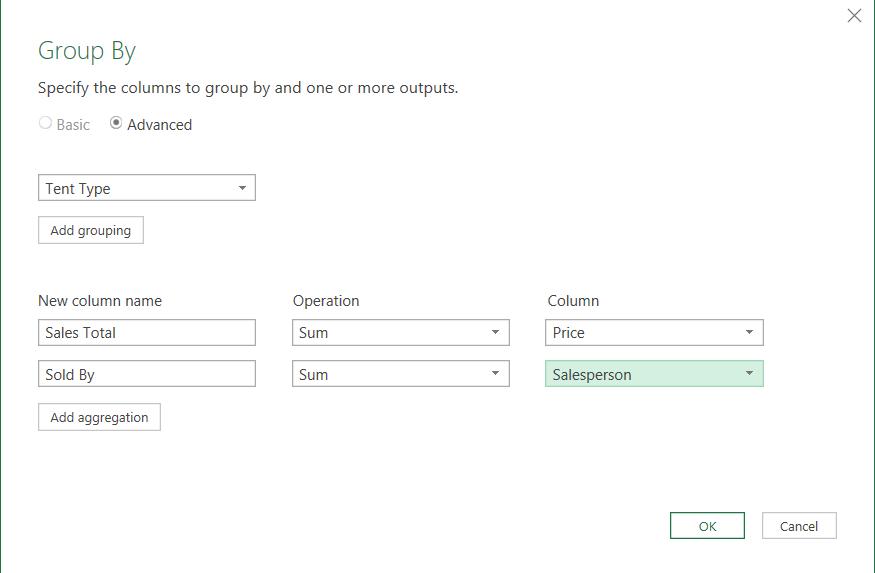
This gives me an error, which is not surprising since I am trying to add up text values!
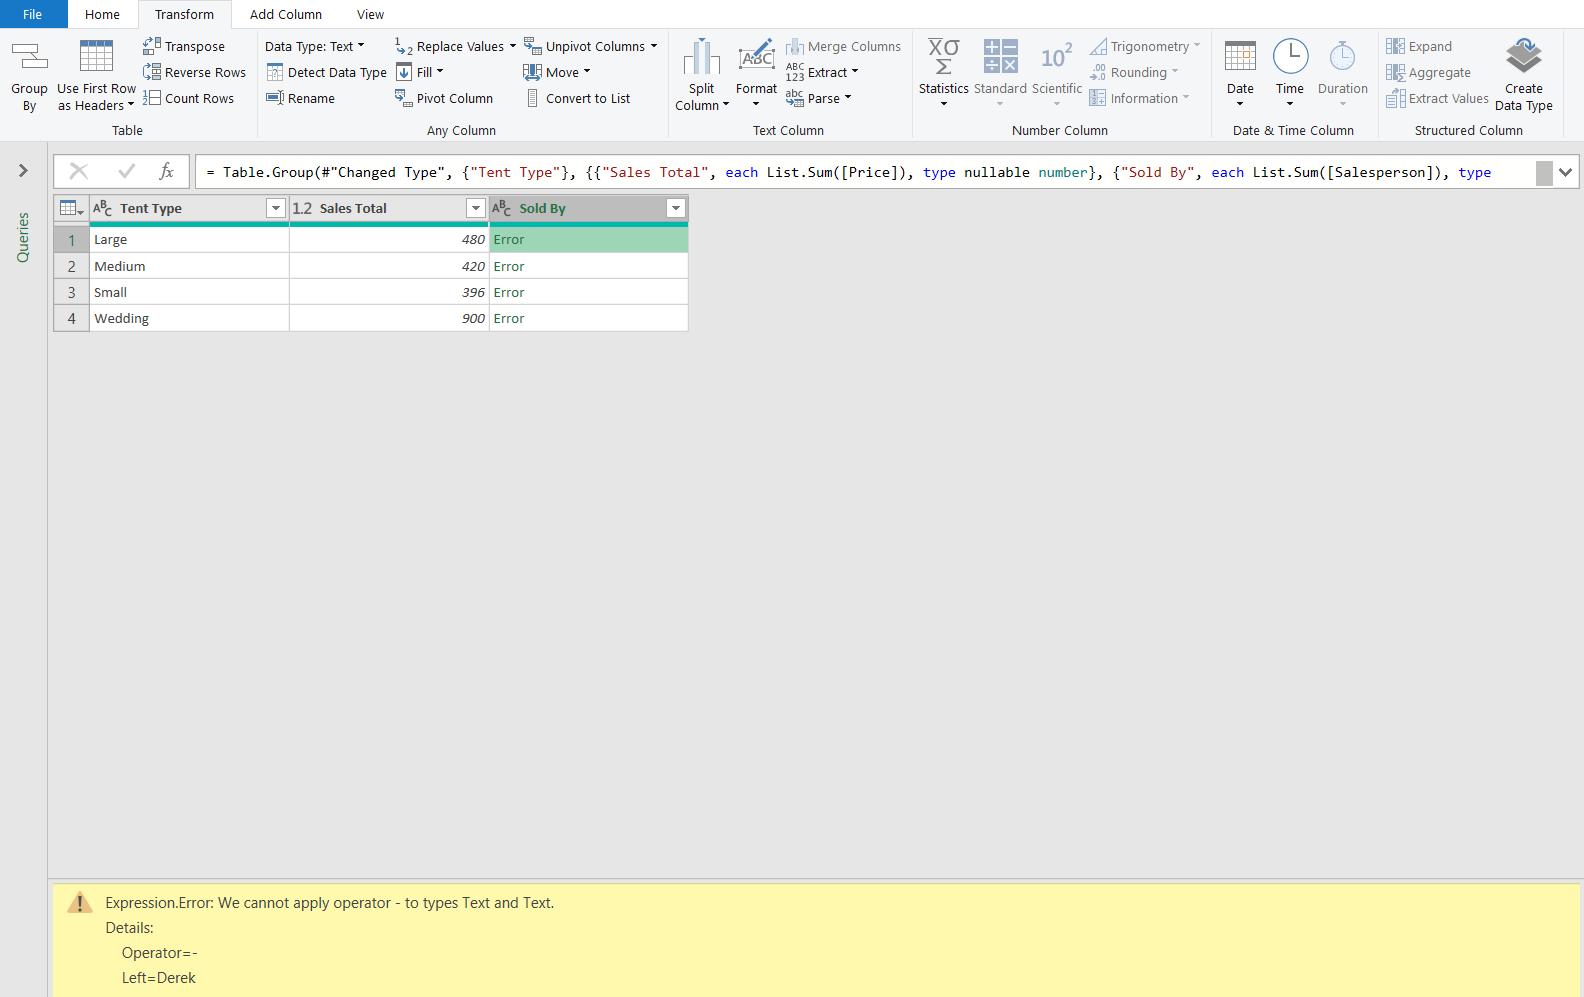
Having failed to add up Derek, I look at the M code produced:
= Table.Group(#"Changed Type", {"Tent Type"}, {{"Sales Total", each List.Sum([Price]), type nullable number}, {"Sold By", each List.Sum([Salesperson]), type nullable text}})
I am interested in the code associated with the Sold By column.
{"Sold By", each List.Sum([Salesperson]), type nullable text}
This is currently using List.Sum() to add up the Salesperson column. If I am going to add up text, then I need a text function Text.Combine(). This will allow me to compile a list of the salespeople, separated by a separator of my choice.
{"Sold By", each Text.Combine([Salesperson], “, “), type nullable text}
I have chosen to separate the salespeople with a comma and a space. The full step now looks like this:
= Table.Group(#"Changed Type", {"Tent Type"}, {{"Sales Total", each List.Sum([Price]), type nullable number}, {"Sold By", each Text.Combine([Salesperson], “, “), type nullable text}})
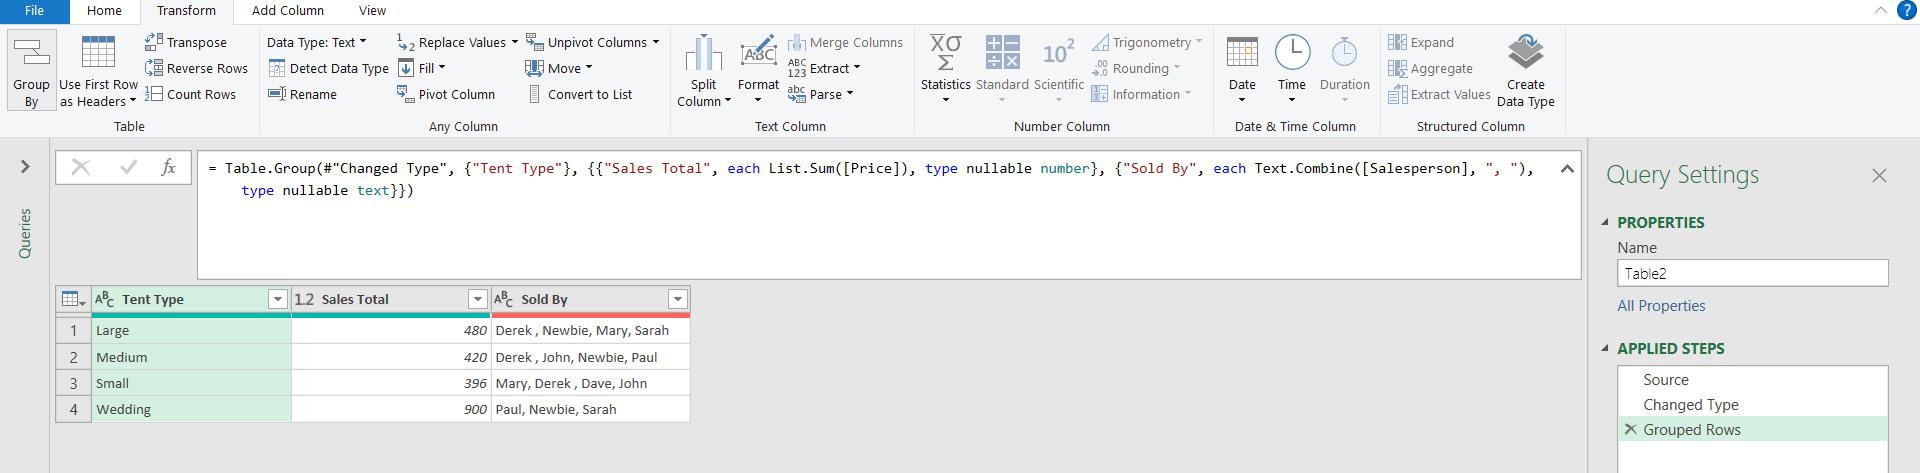
I now have a list of salespeople in the Sold By column.
Come back next time for more ways to use Power Query!