Power Query: M-Powered
8 March 2017
Welcome to our new Power Query blog. The built-in functionality of Power Query means that many tasks can be accomplished at the press of a button. But what if there isn’t a button for what needs to be done? Then it’s time to delve into M, the programming language behind Power Query.
For users already familiar with Power Pivot and Data Analysis eXpressions (DAX, the associated programming language), it might seem logical that Power Query would use a similar language and perhaps even the same formulae. Not so. Power Query has its own language, M, and its own formula syntax. There’s not even a clever reason why the language is called M, it was just the next available letter. So, having abandoned any expectation of familiarity, I need a good place to start looking at M language (after L?). I will create a custom column and look at a formula that can be associated with that new column.
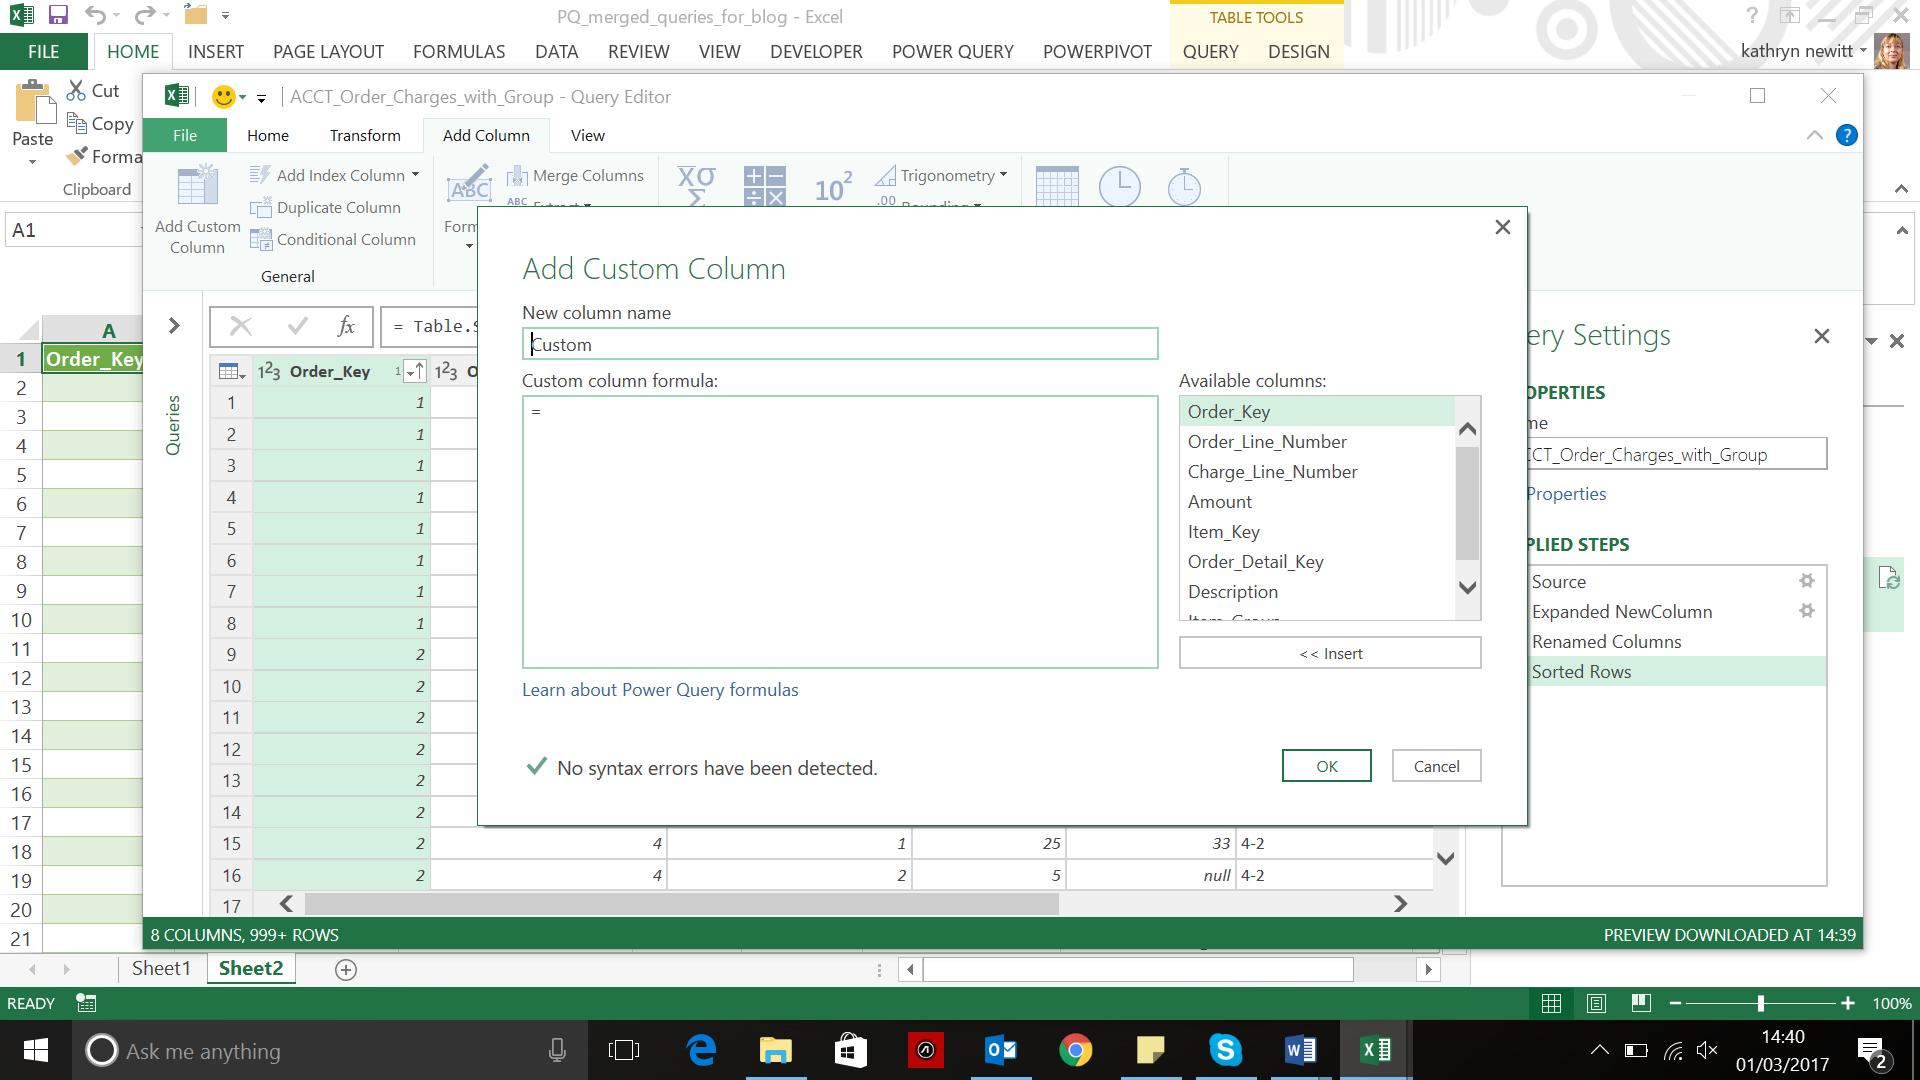
I start out in the worksheet for the merged query I created in Two (Queries) Become One and open ACCT_Order_Charges_with_Group to access the query editor. On the ‘Add Column’ tab I choose to ‘Add Custom Column’:

The dialog box has a large section for the formula beneath the name I choose for my new custom column. Available columns in the query are shown and double clicking them adds them to the formula (or I can select and then choose to ‘Insert’ them).
Notice the option to ‘Learn about Power Query formulas’ at the bottom of the dialog box. This is the best place to find out what formulae are available in Power Query. Clicking here will take me to the Microsoft help page, which has a links to find out lots about Power Query M language and the functions available.
Having said that the formulae do not tend to match those for Power Pivot, there are some functions that are reassuringly familiar from Excel, as I will show now by concatenating two existing columns.
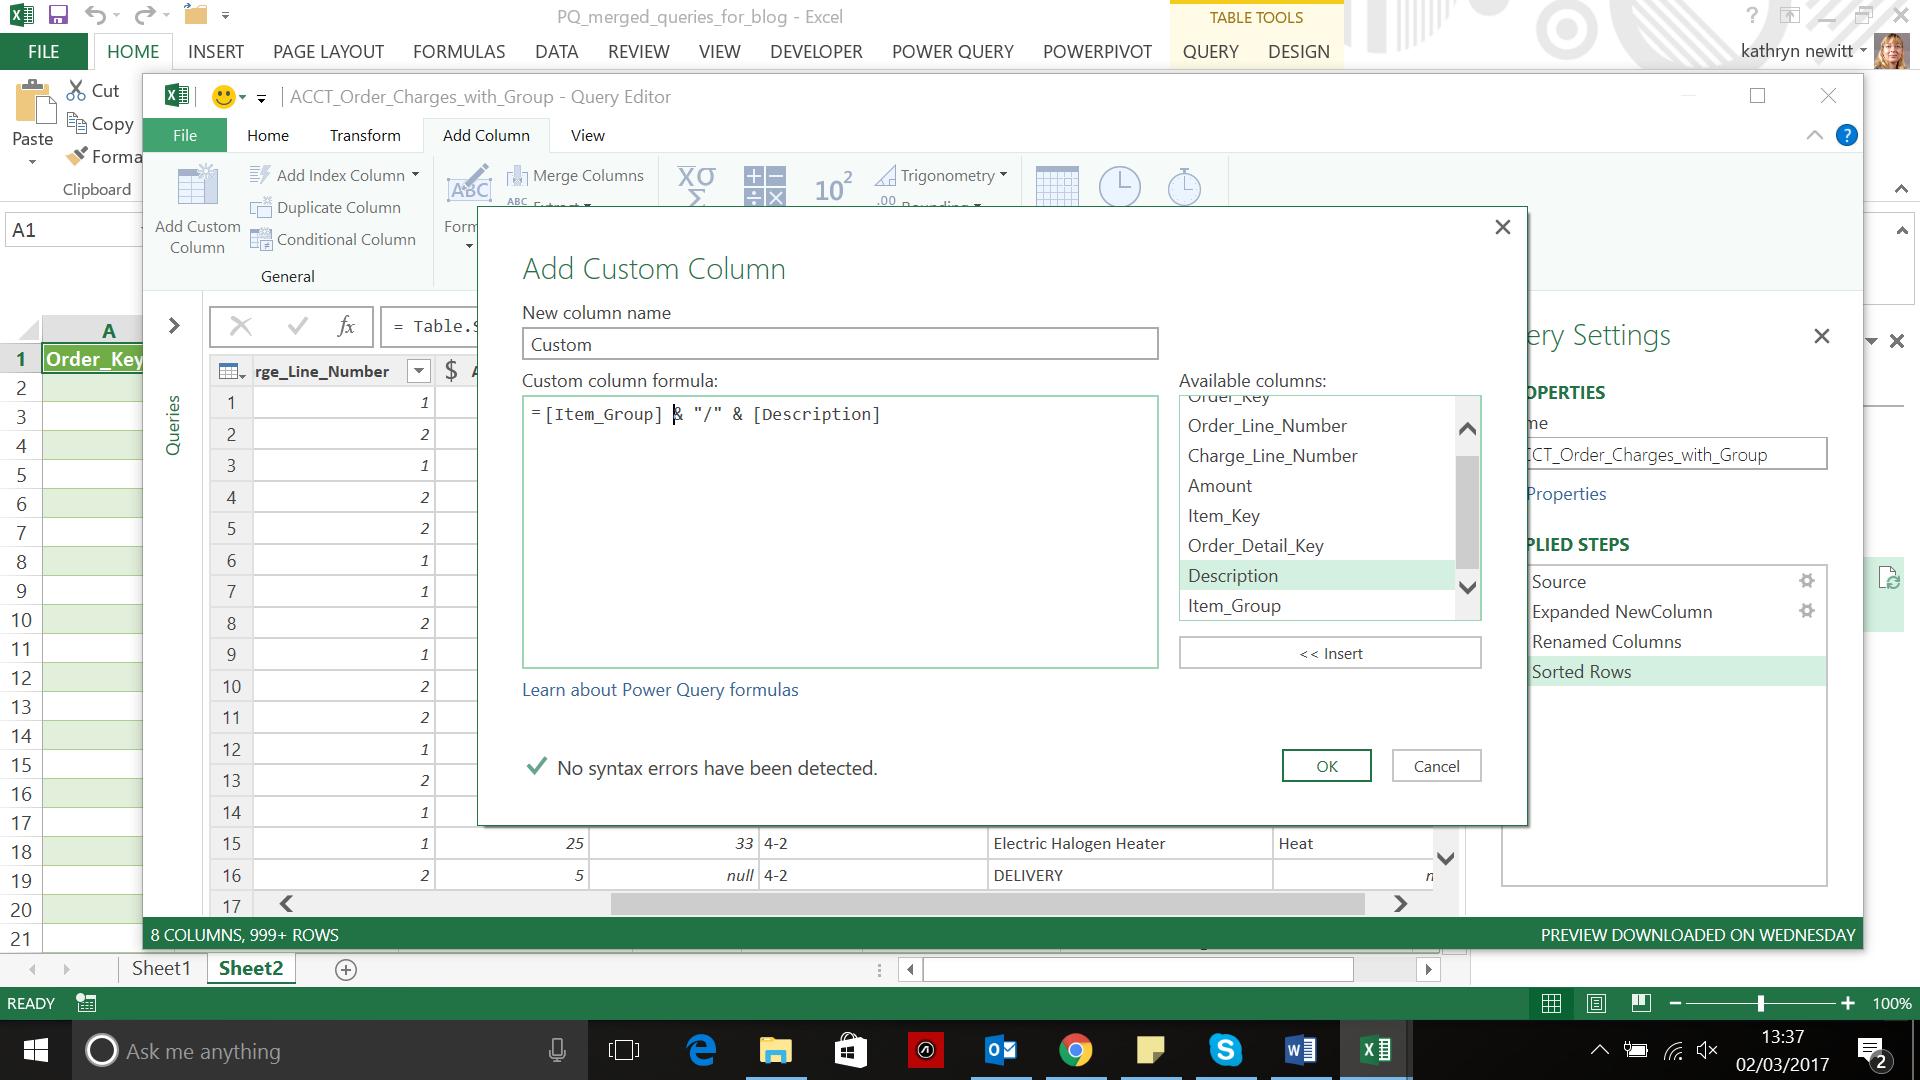
I decide to create a column that combines the Item_Group and the Description columns by double clicking each column (or using ‘Insert’). I type in an ‘&’ between the columns, which is the same as I would do in an Excel formula, and include a ‘/’ to separate the data in the column to make it easier to read:

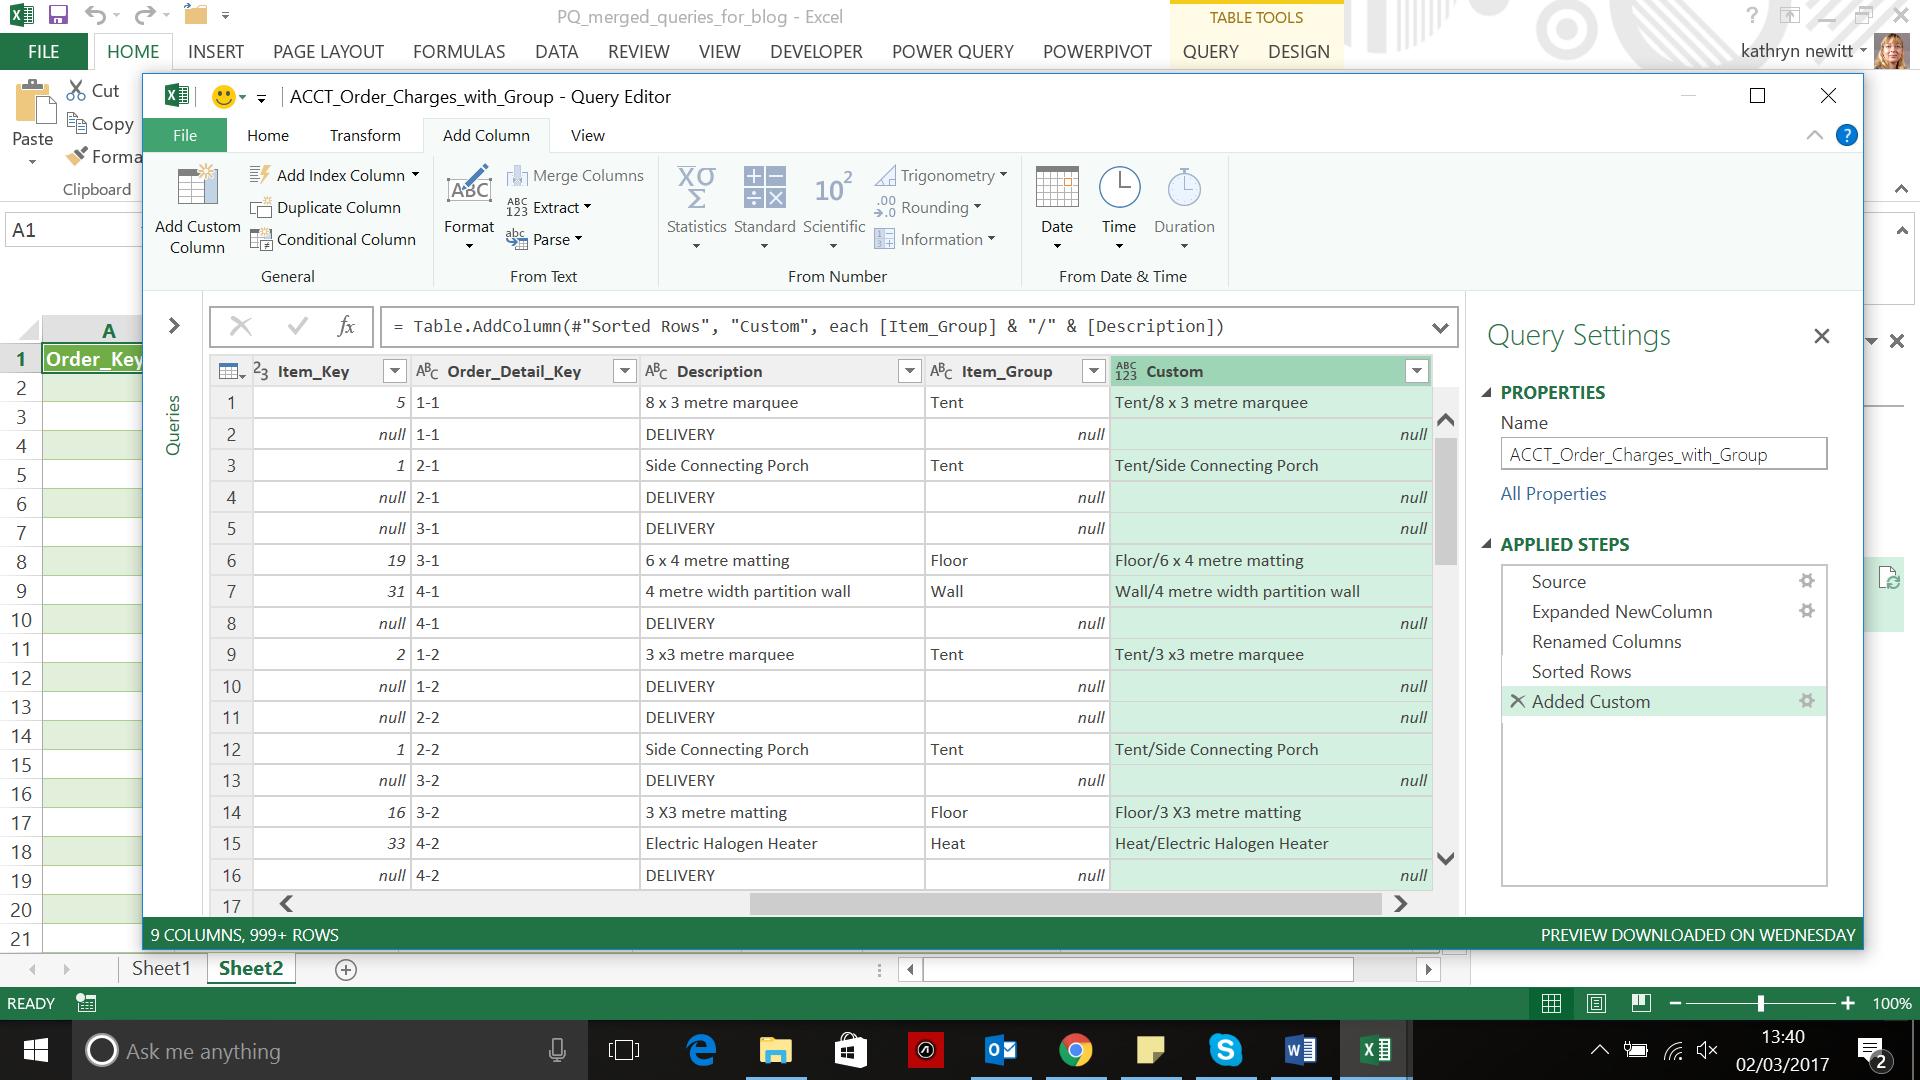
I click ‘OK’ and my custom column is generated, ready to be loaded to my worksheet.

There are other similarities with Excel: the symbols ‘+’, ’-‘, ’*’ and ‘/’ are used for add, subtract, multiply and divide respectively too.
There are however some points to bear in mind when comparing Power Query formulae with Excel:
- Excel formulae are not case sensitive, but Power Query formulae are
- Excel counts using a base of 1 (e.g. the first letter in a string is at position 1), but Power Query uses a base of 0 (zero) (so the same letter would be at position 0)
- Excel will automatically convert data (e.g. concatenating a text column to a numerical column will work as Excel converts them to text automatically). Power Query will not (e.g. trying to concatenate text to a value will give errors in the new column – the value must be converted to text first). This is why I picked two text columns for my example above.
Having imparted some good news and some bad news about the way that Power Query and M language compares with Excel, next time I will look in more detail at how M language is constructed.
Want to read more about Power Query? A complete list of all our Power Query blogs can befound here. Come back next time for more ways to use Power Query!

