
Power Query: Merging Muddles
24 February 2021
Welcome to our Power Query blog. This week, I look at how to merge data when there is not a clear link between the tables.
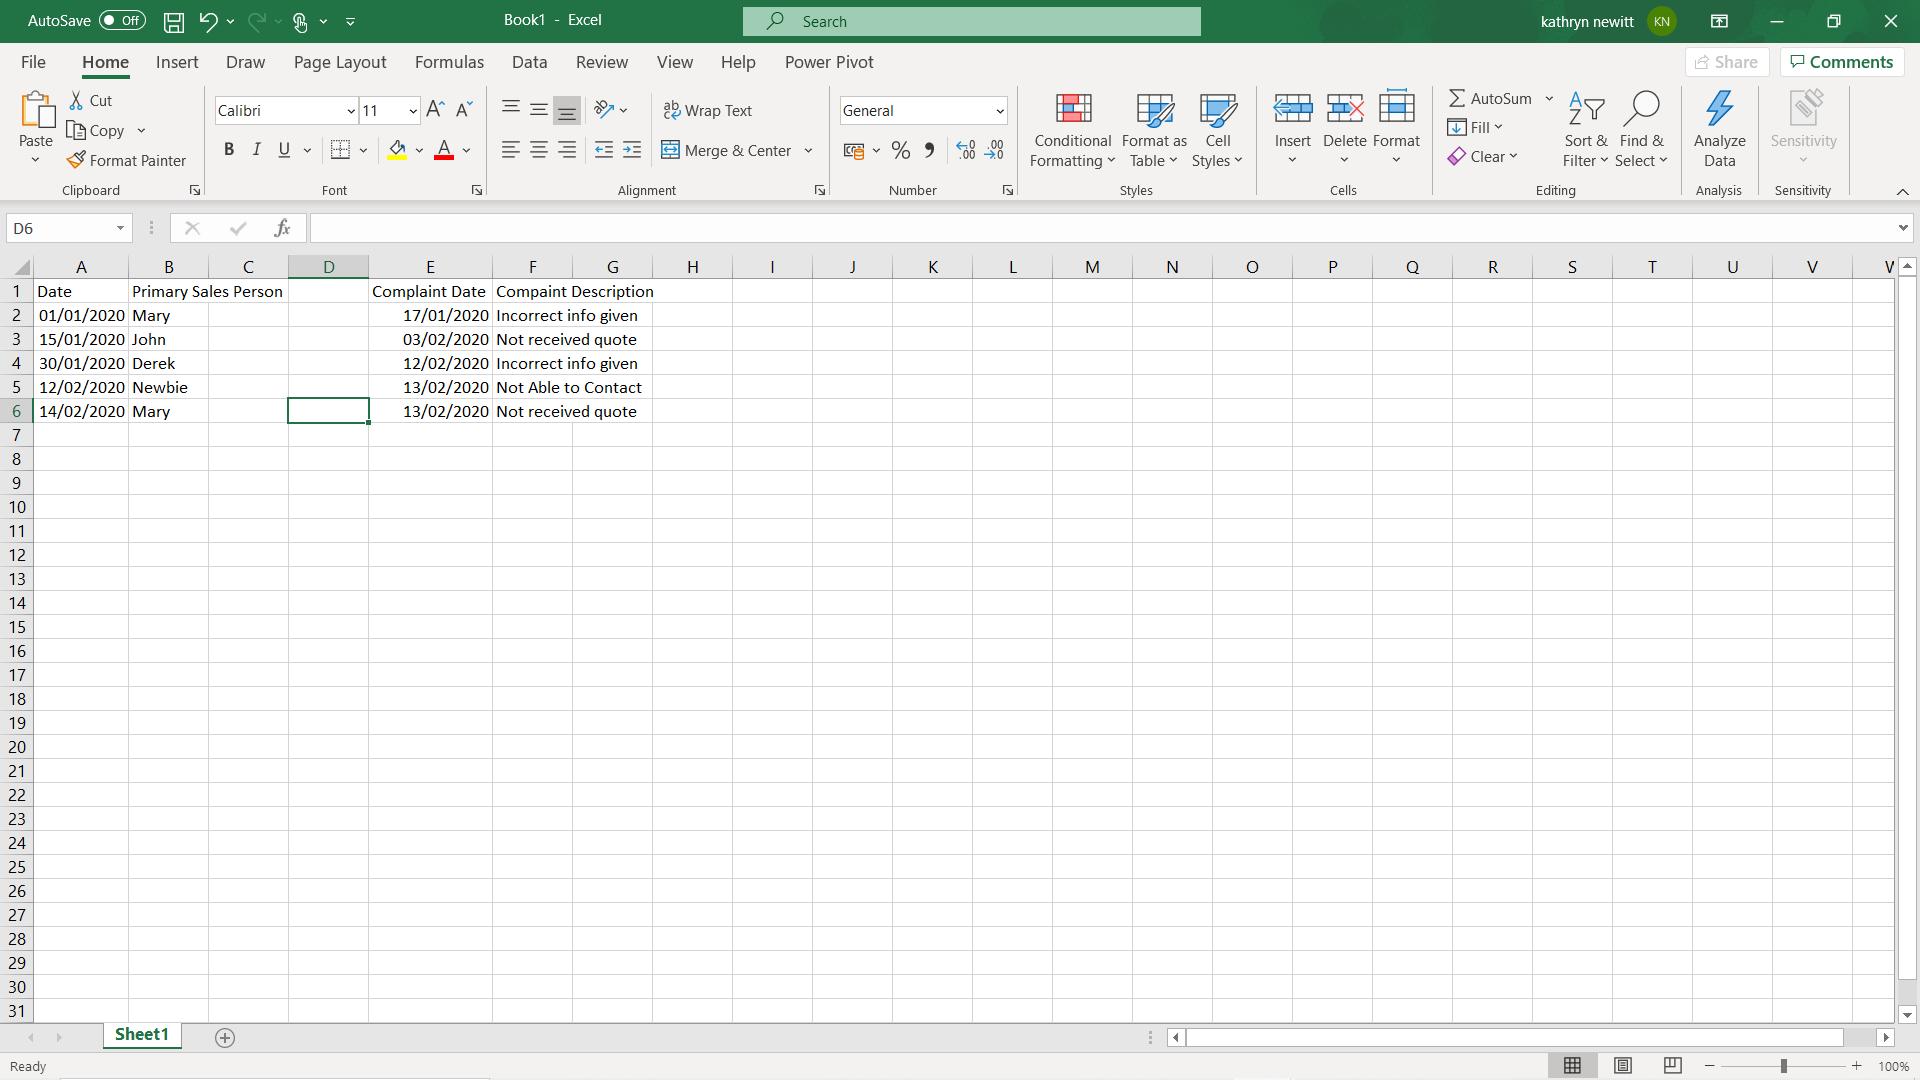
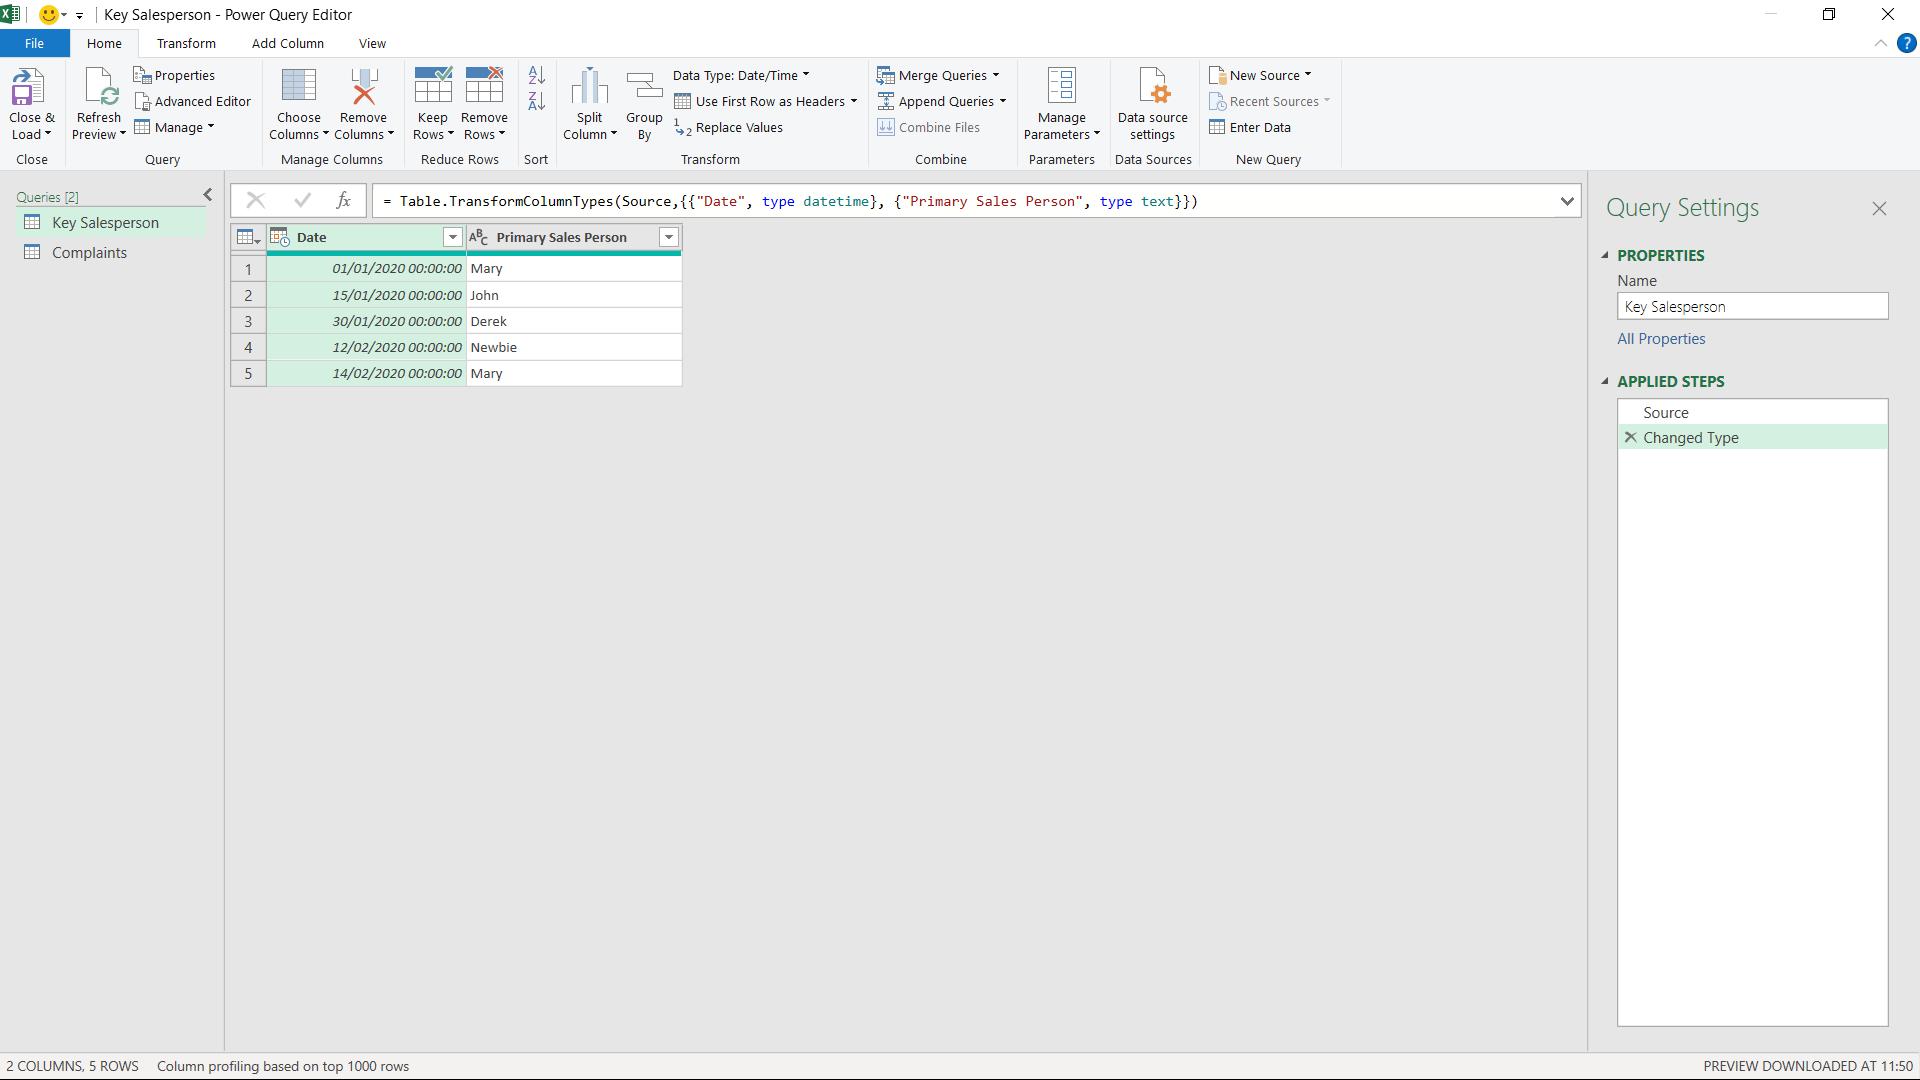
I have some sales contact data for my imaginary business. Unfortunately, I have some complaints and I want to allocate them to the correct salesperson. I have the date of the complaint and the date the salesperson took over as the primary, as follows:
I start by extracting my data and importing it into Power Query. I have two tables. I click somewhere in my first table and I choose ‘From Table/Range’ on the ‘Get & Transform’ section of the Data tab.
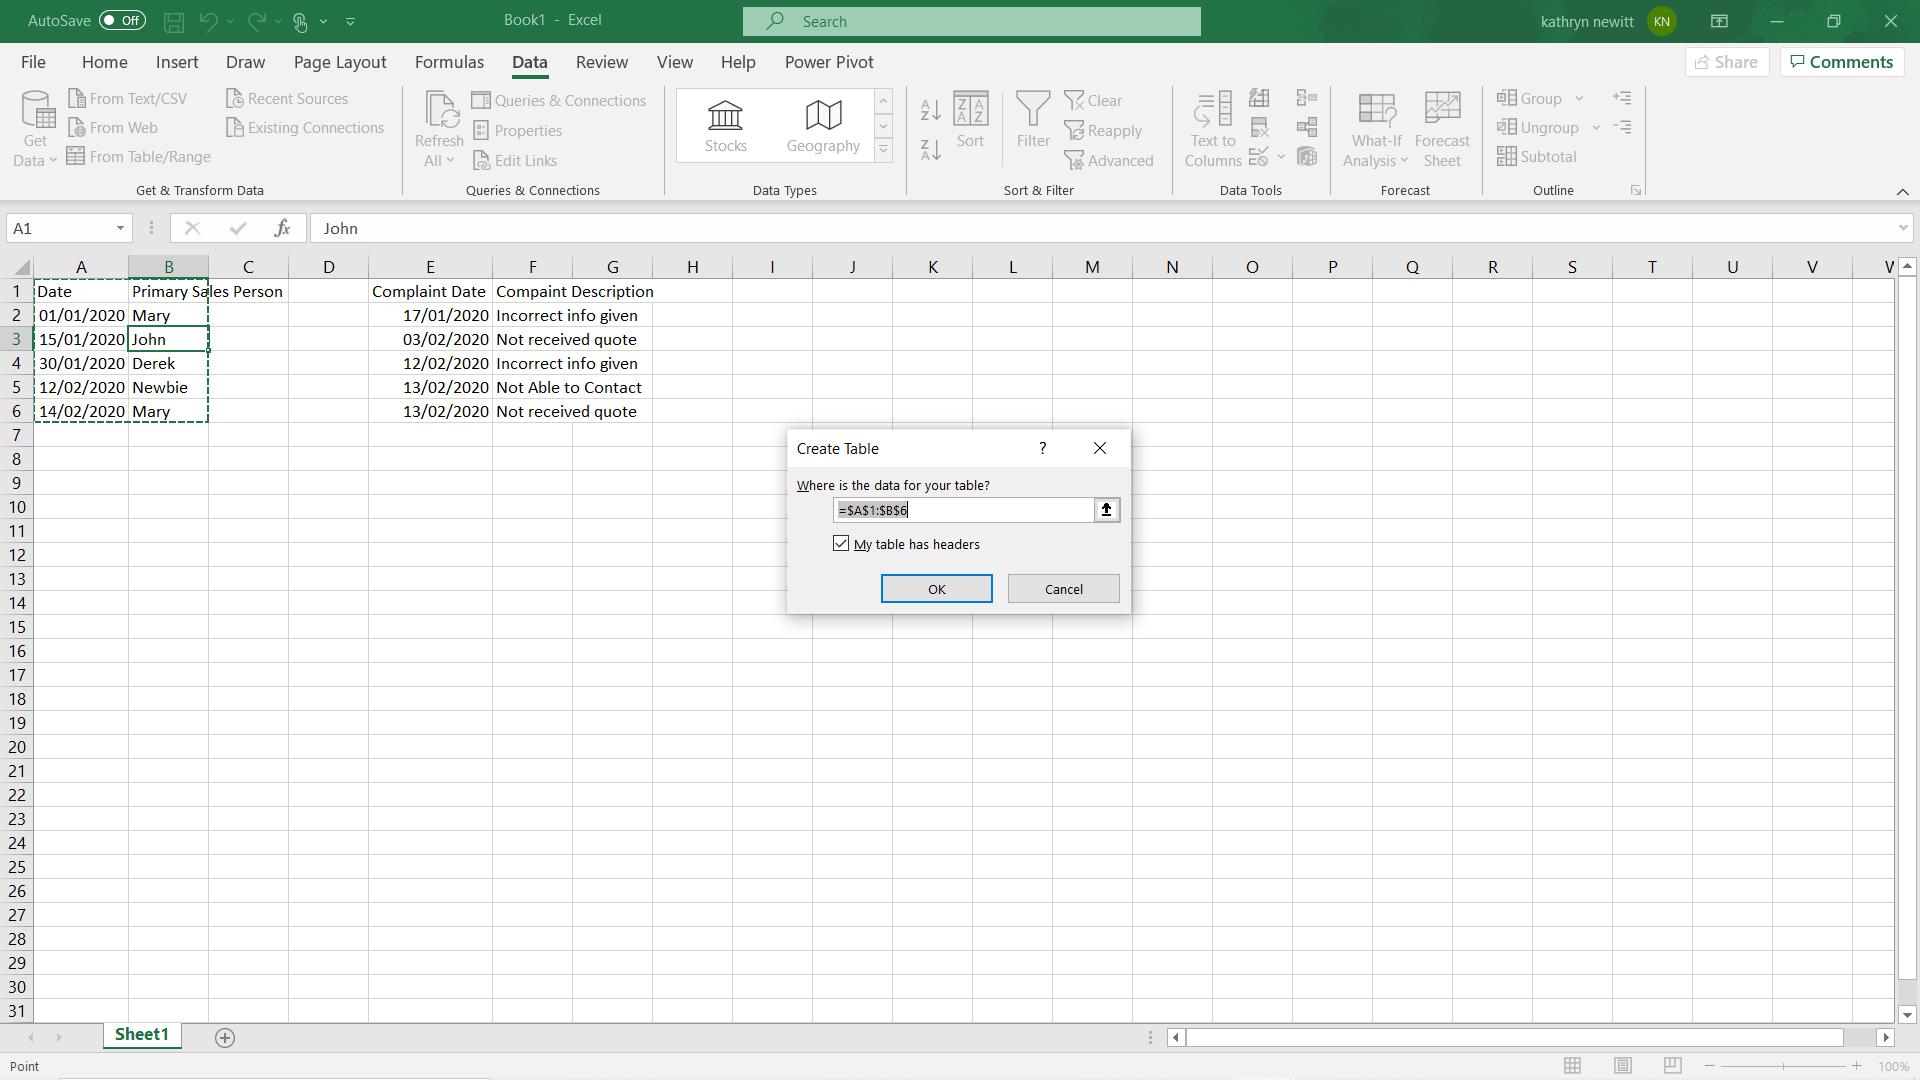
I accept the defaults (as usual!) and click OK.
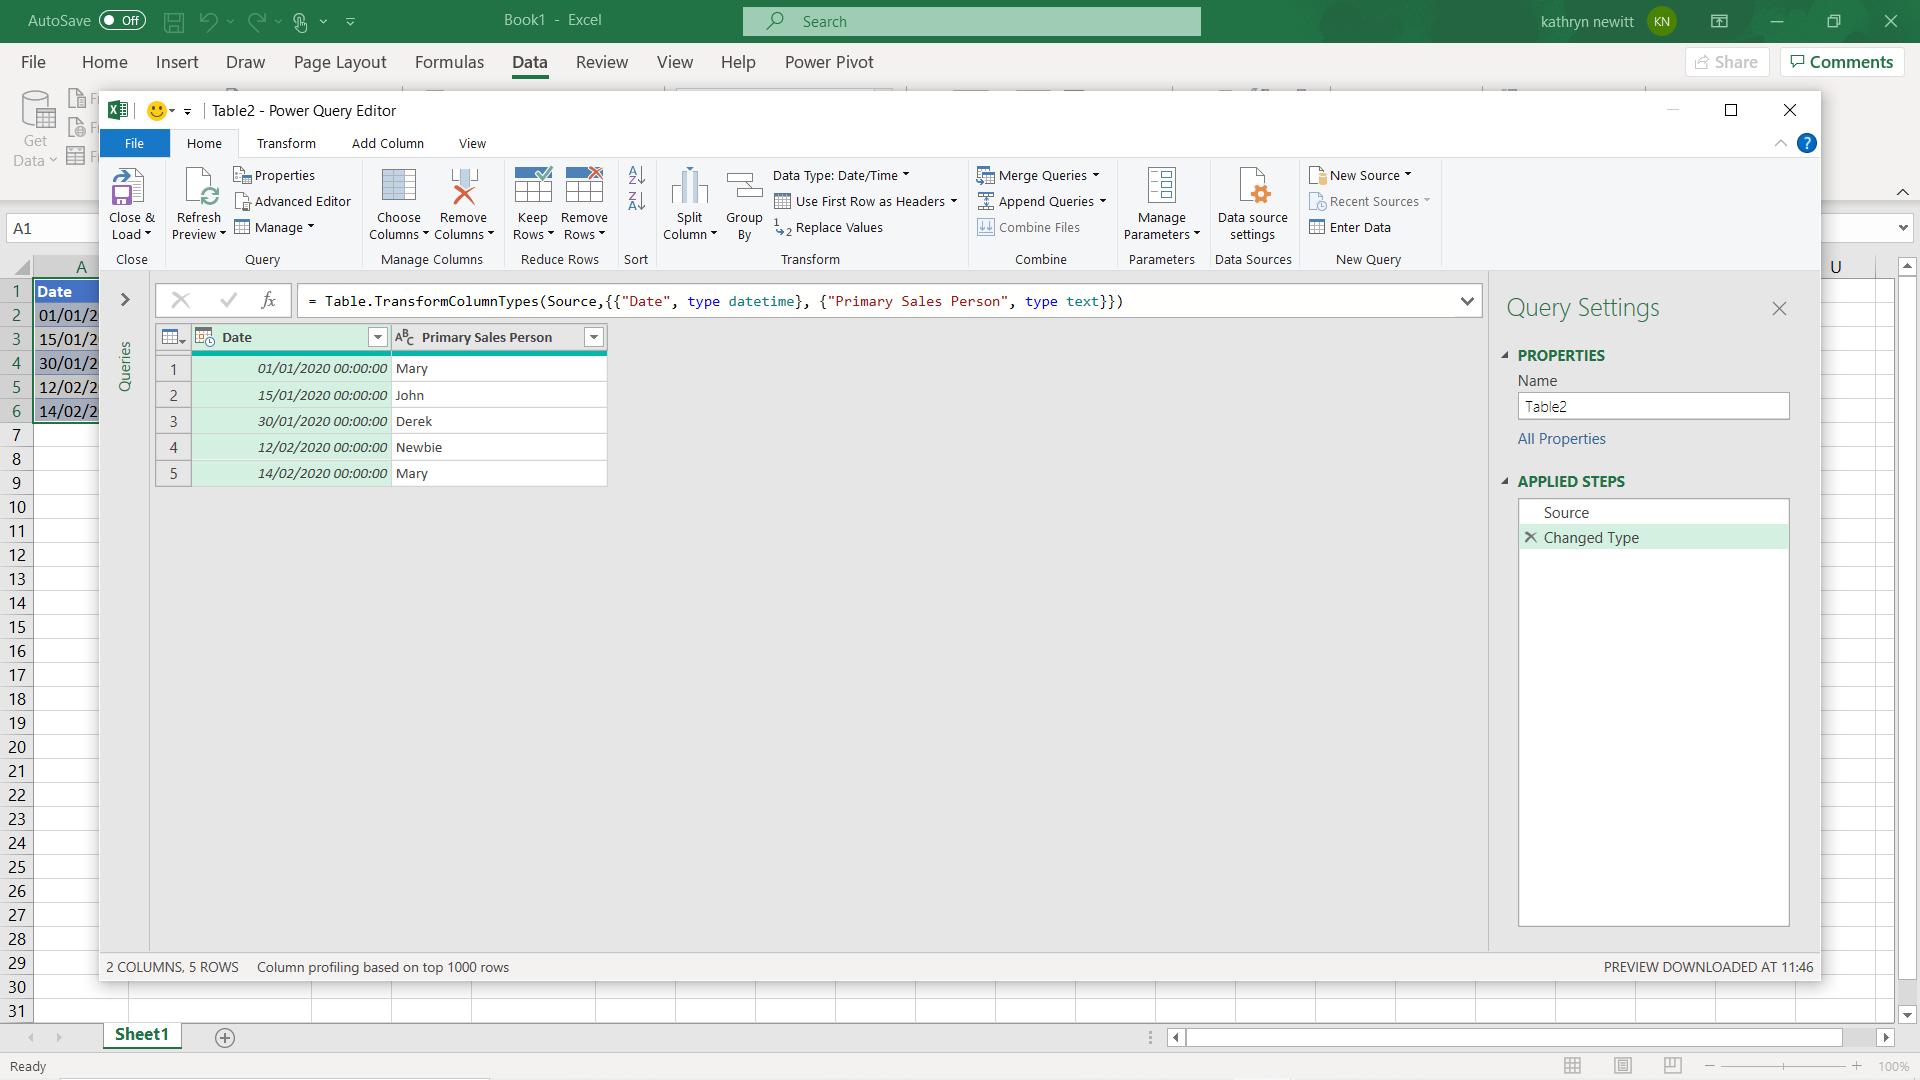
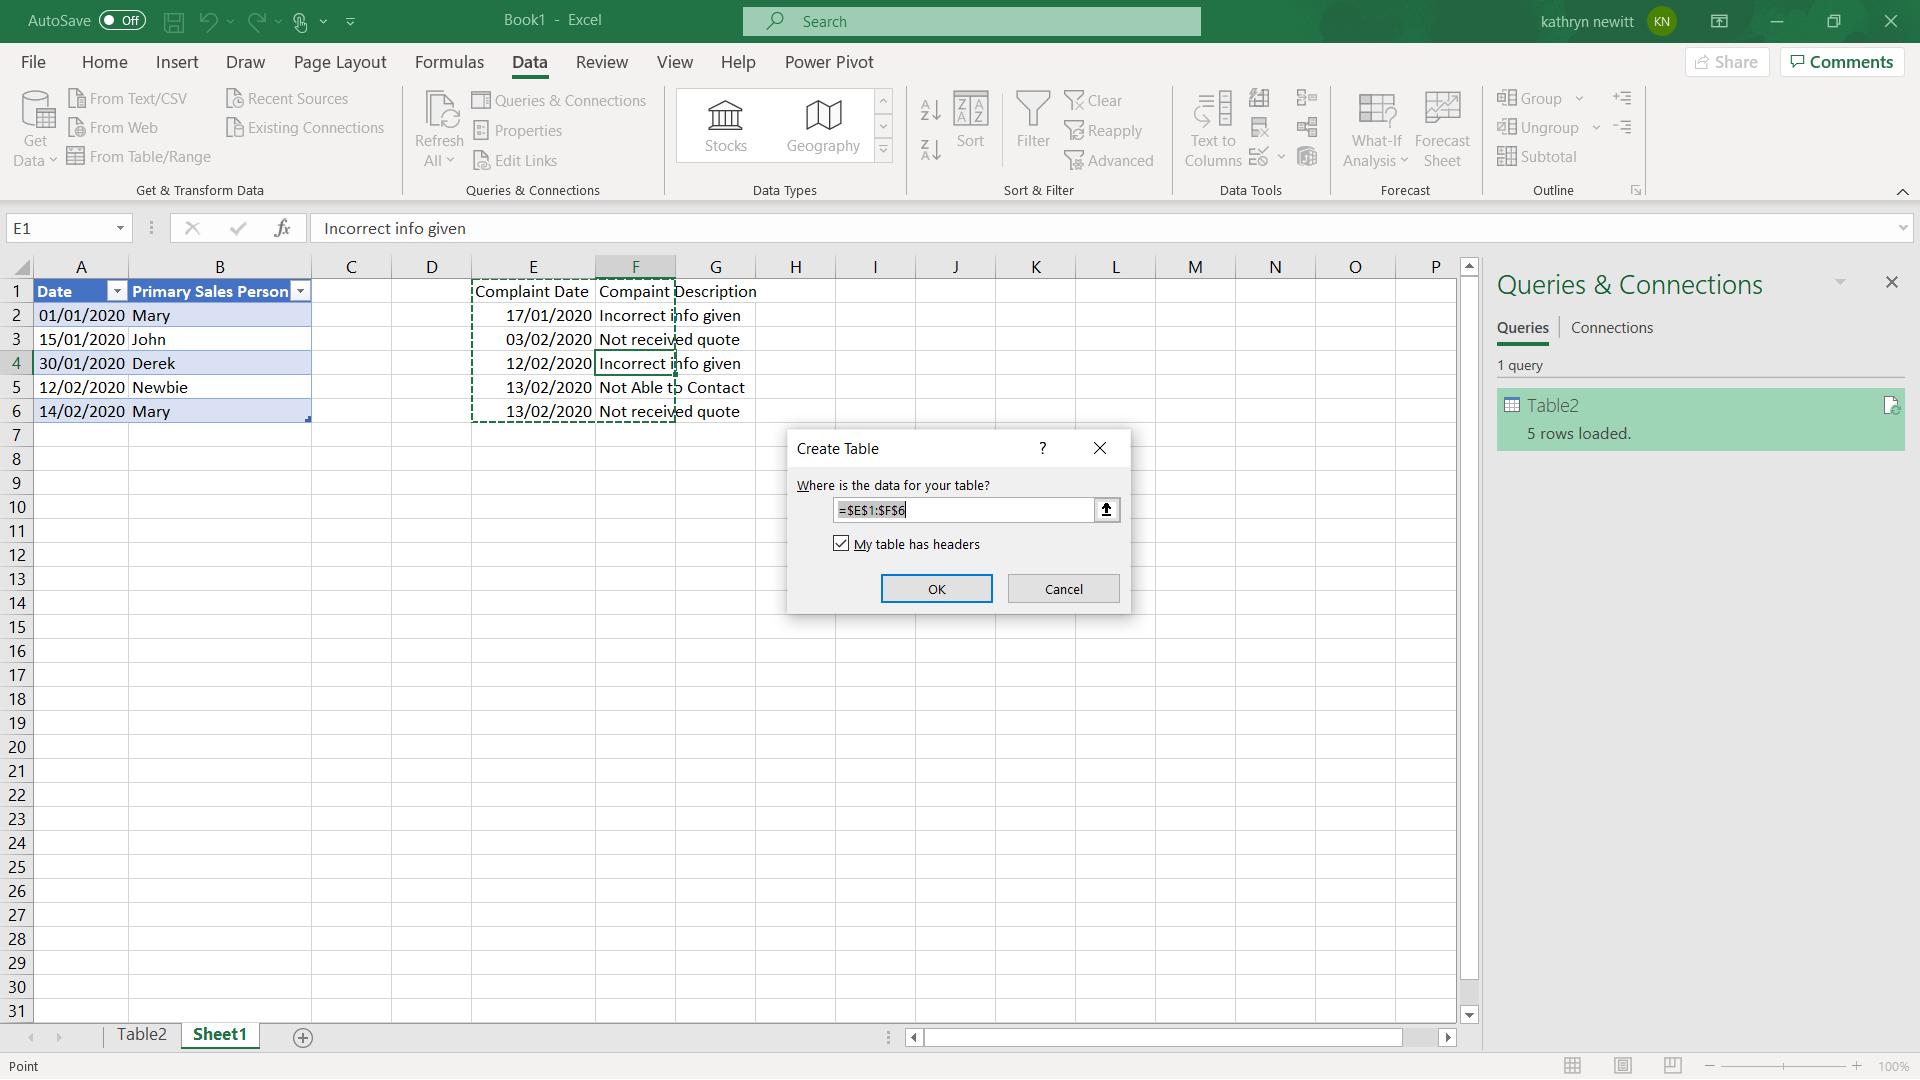
I ‘Close & Load’ my first table and repeat this process for the other table.
I now have two tables, which I have called ‘Key Salesperson’ and Complaints.
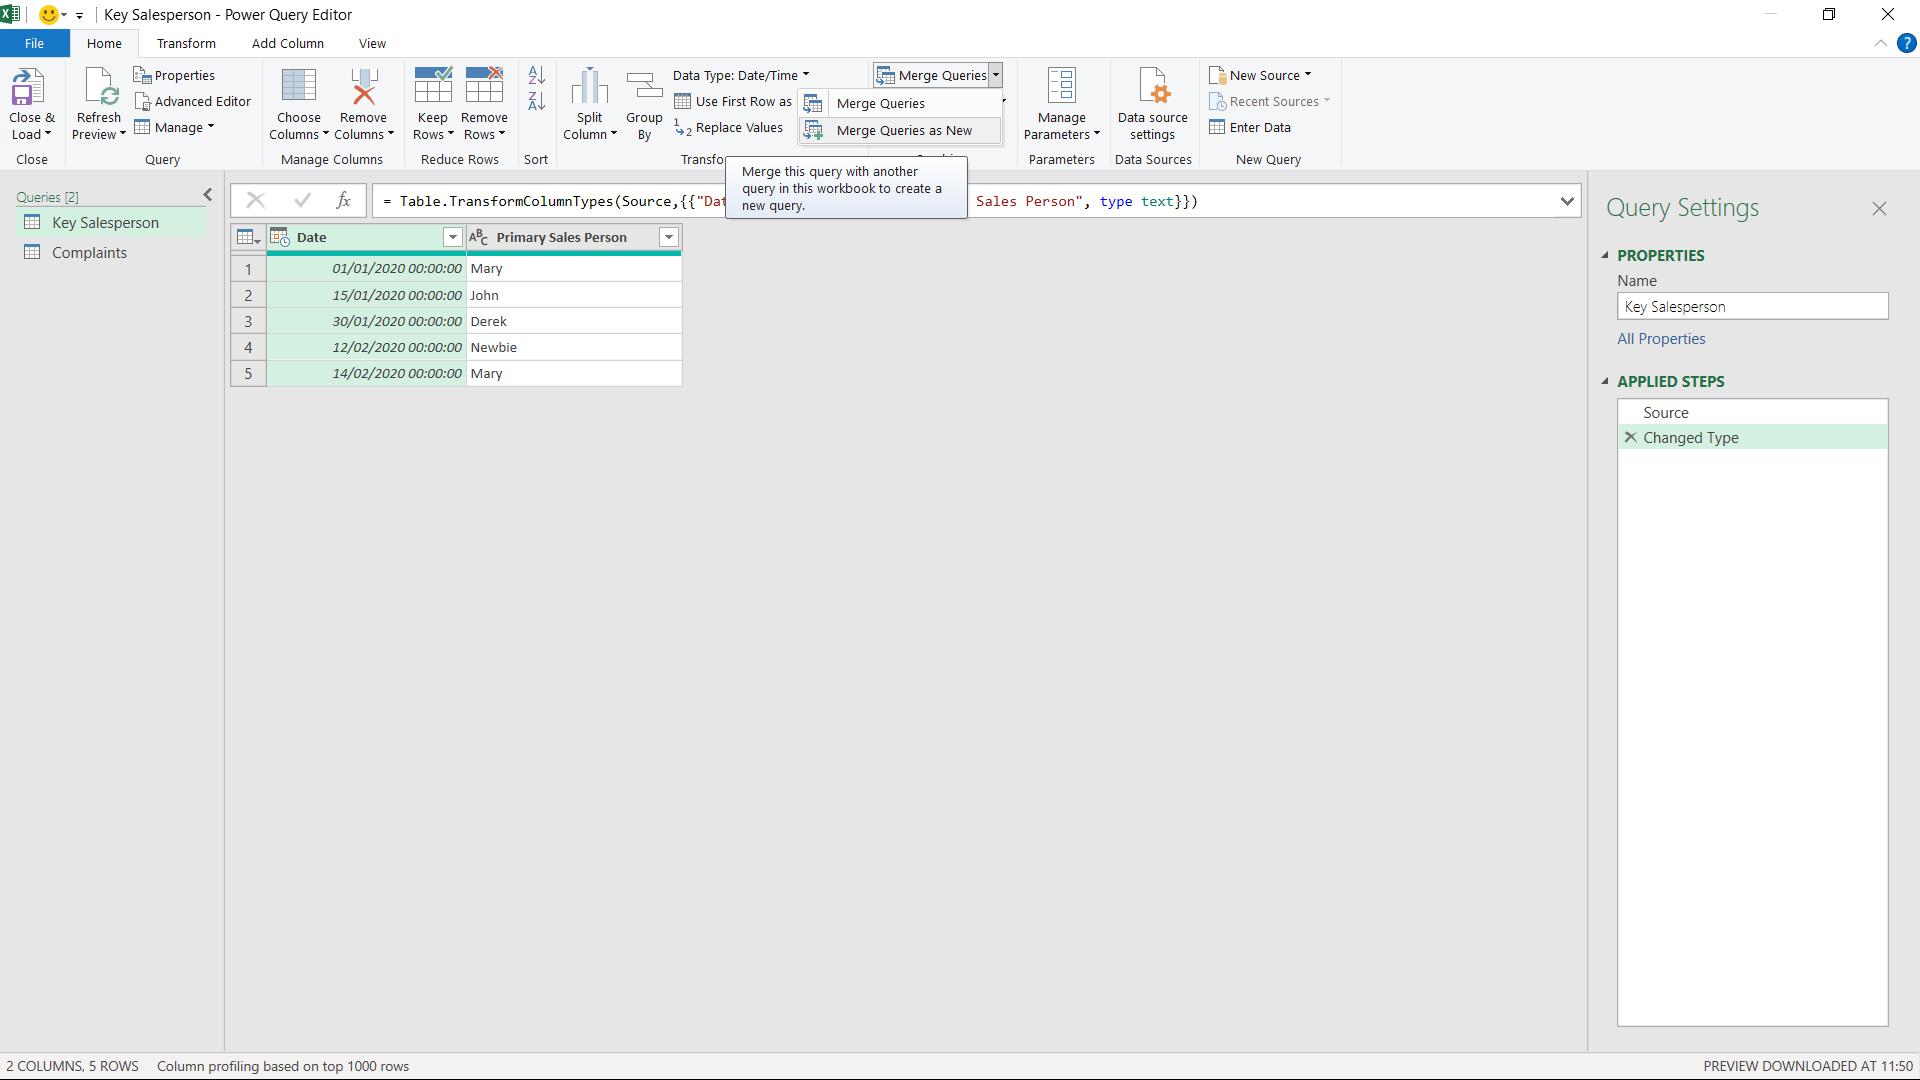
I am going to merge my tables, so I choose ‘Merge Queries’, then ‘Merge Queries as New’, from the Combine section on the Home tab. I choose to create a new table because I am going to join my tables in another way next time…
In the join options, I can see that the dates are not going to help me join my tables: I need to use a full outer join.
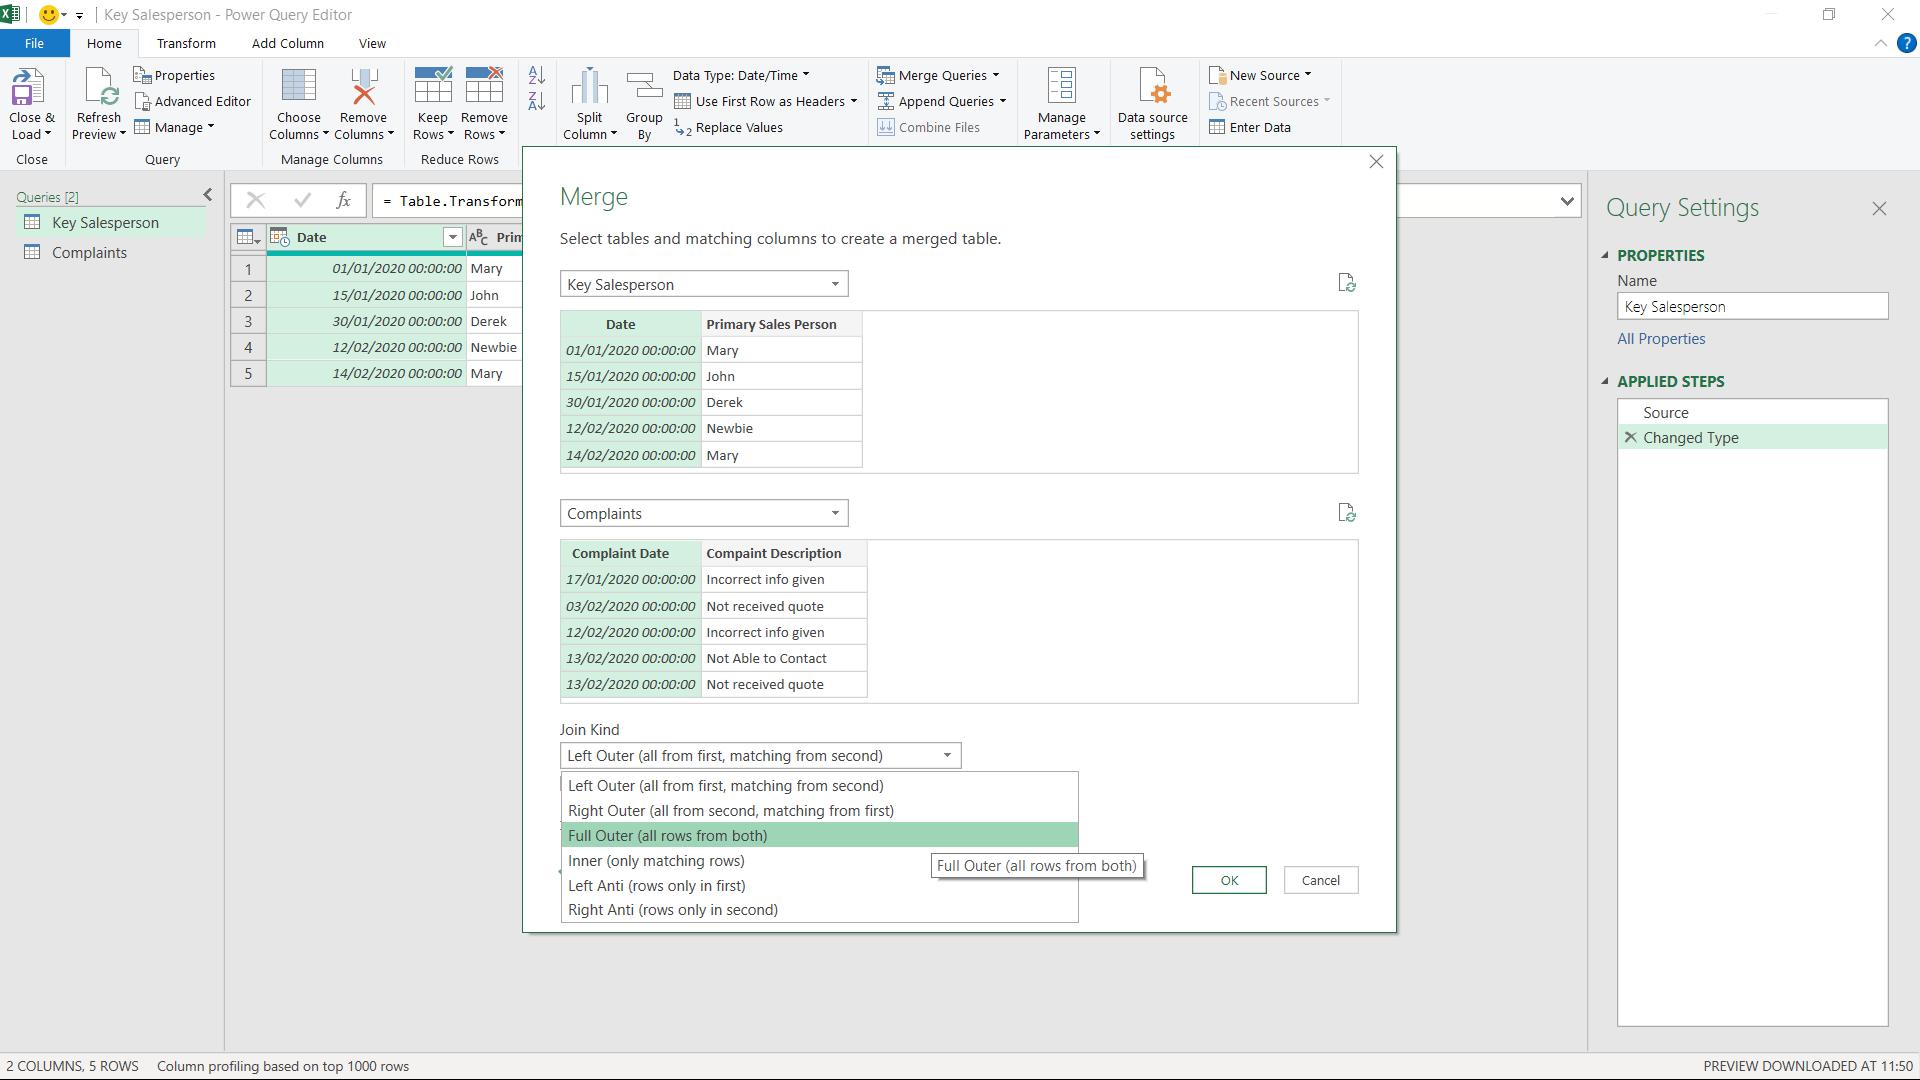
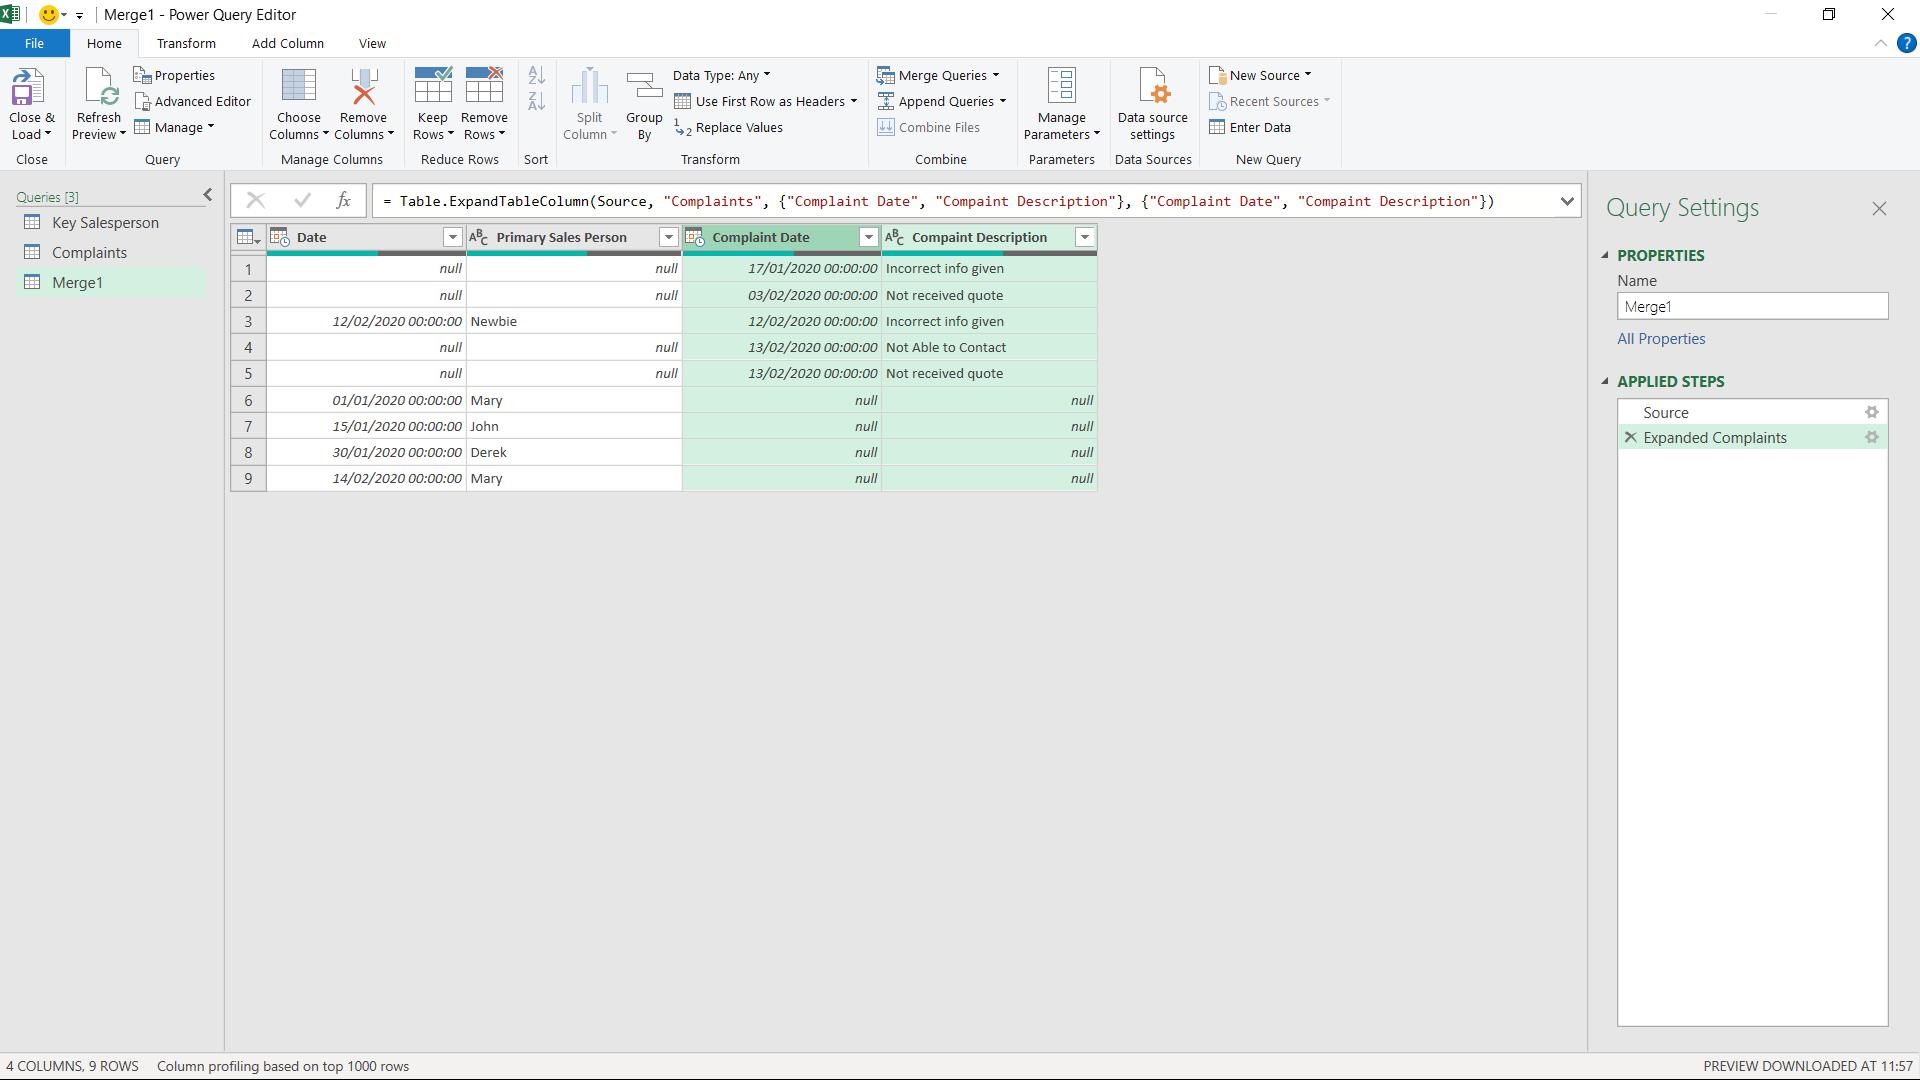
When I choose this, I can see there is more work to do to get the data into the format I require.
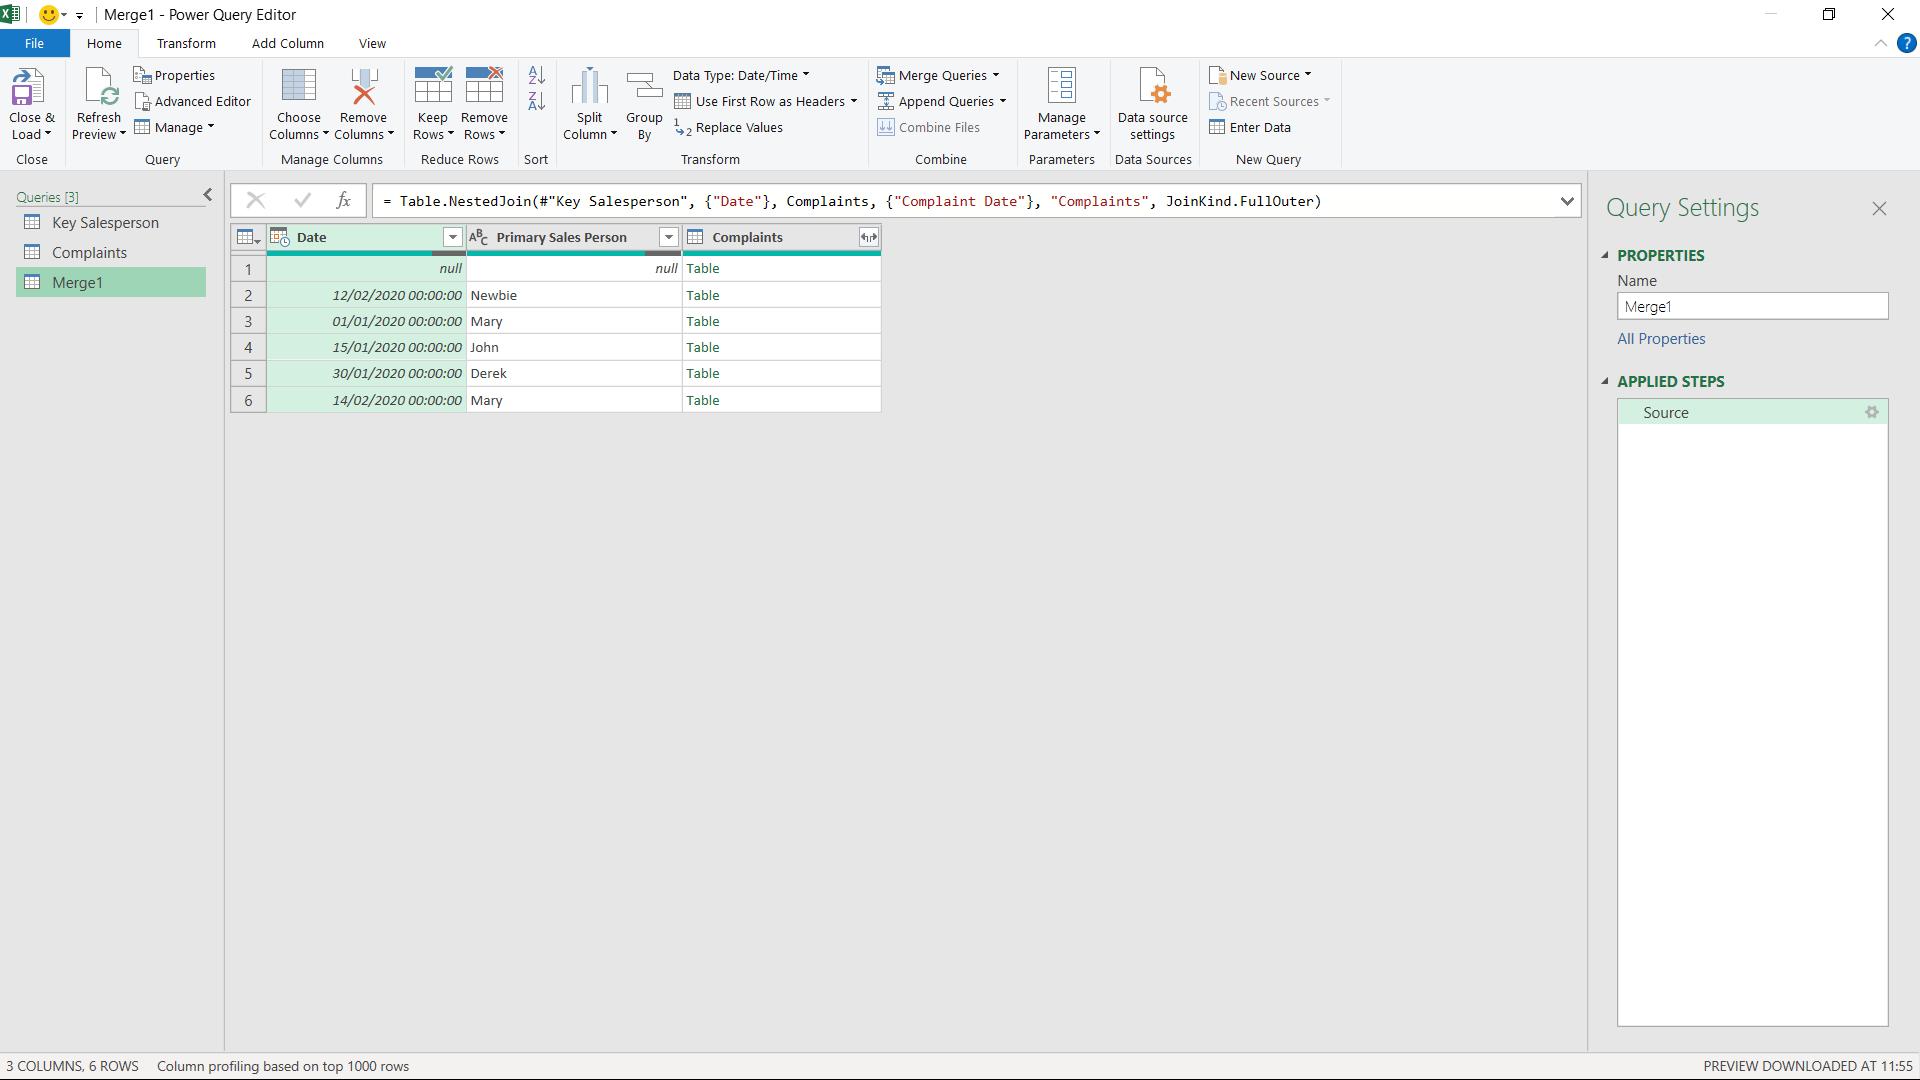
I start by expanding the Complaints table, using the icon next to the column heading.
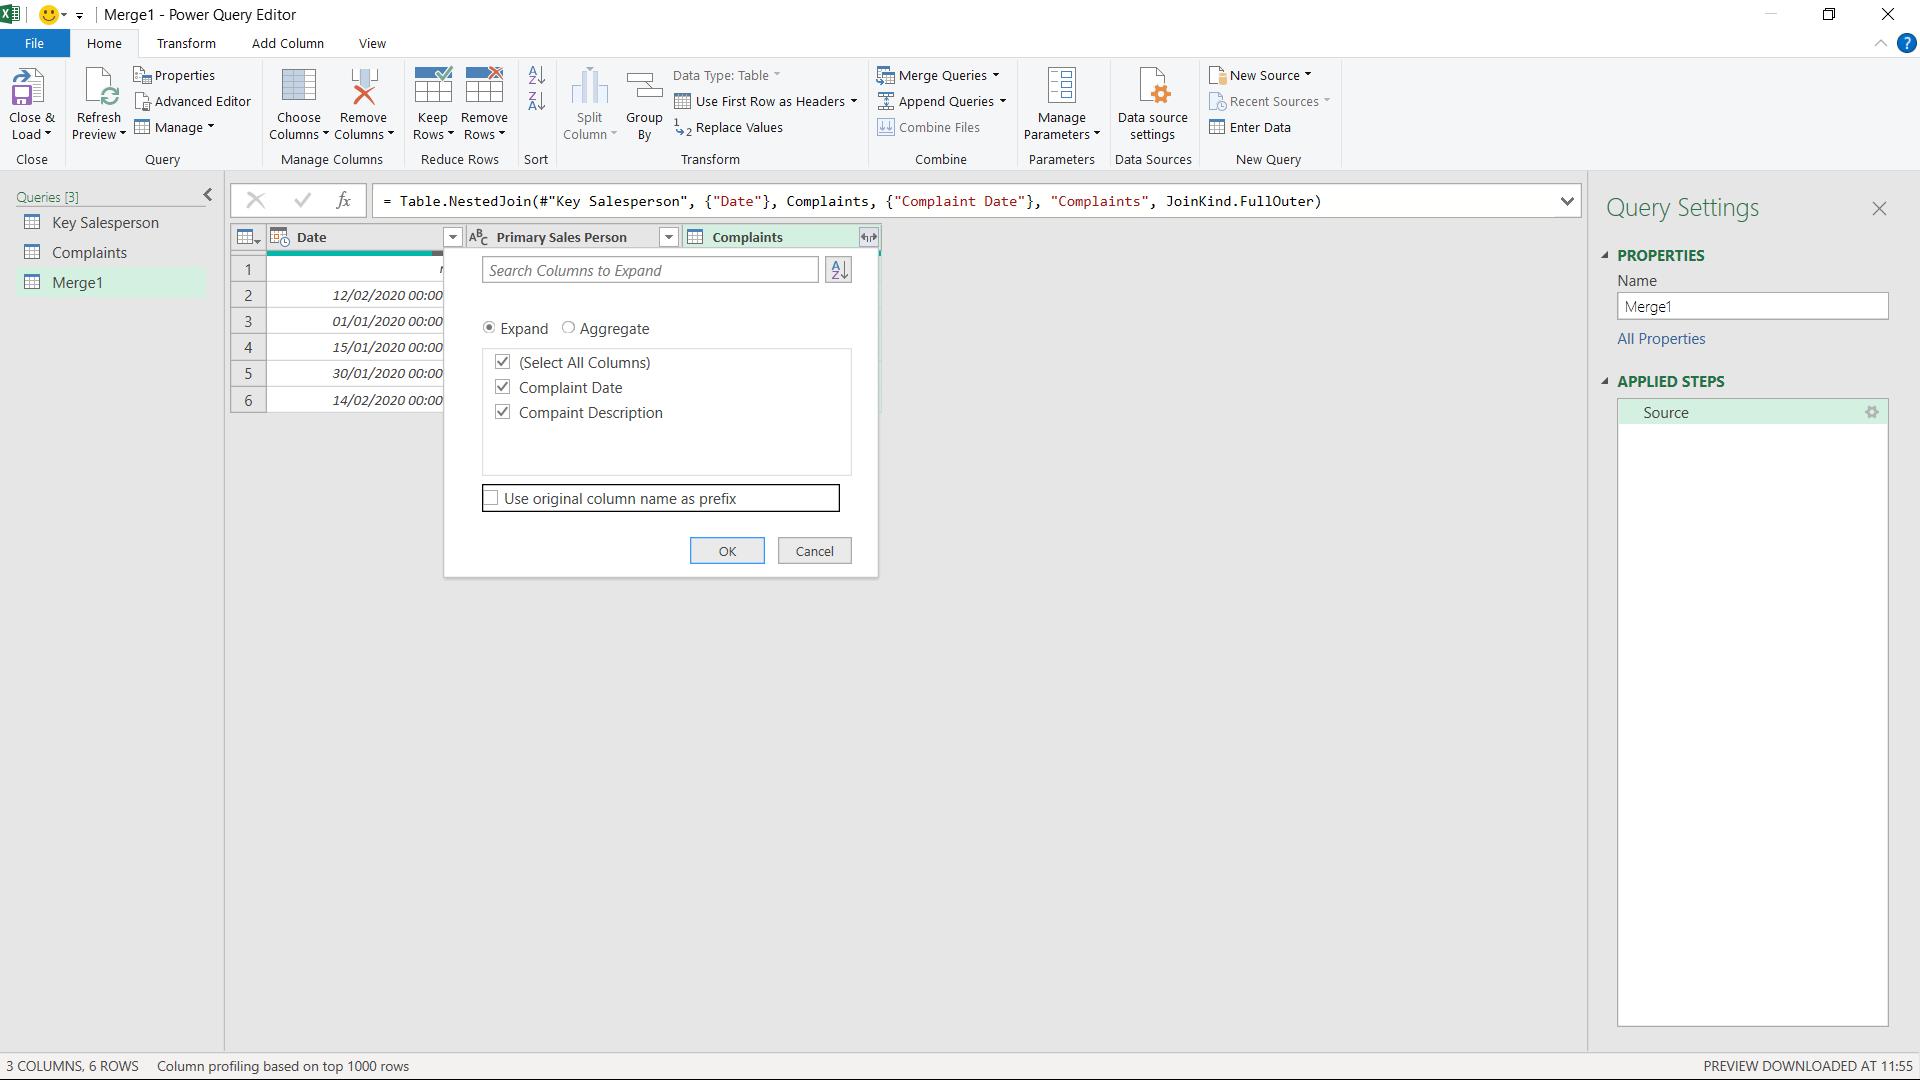
I don’t need to use the prefix option as my columns have unique names.
I create a new date column which will hold whichever date is populated.
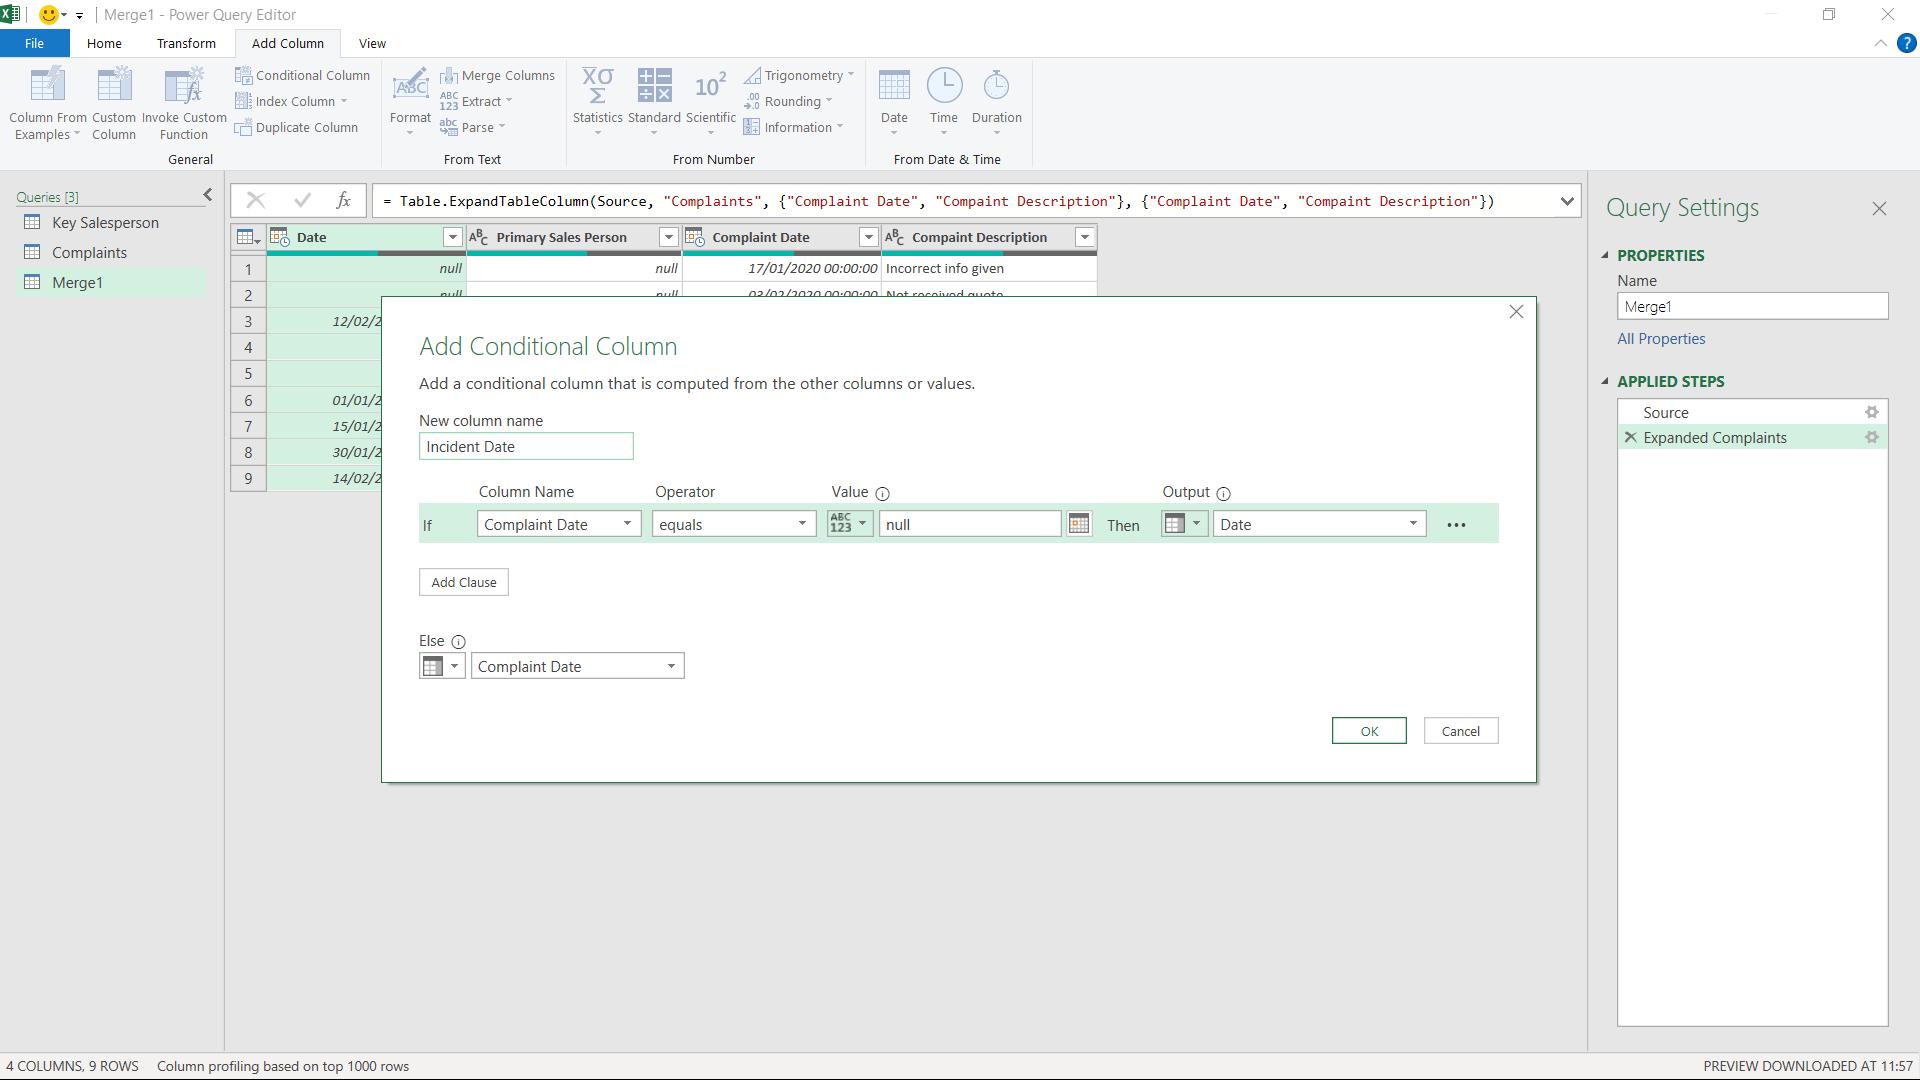
I click OK to create Incident Date.
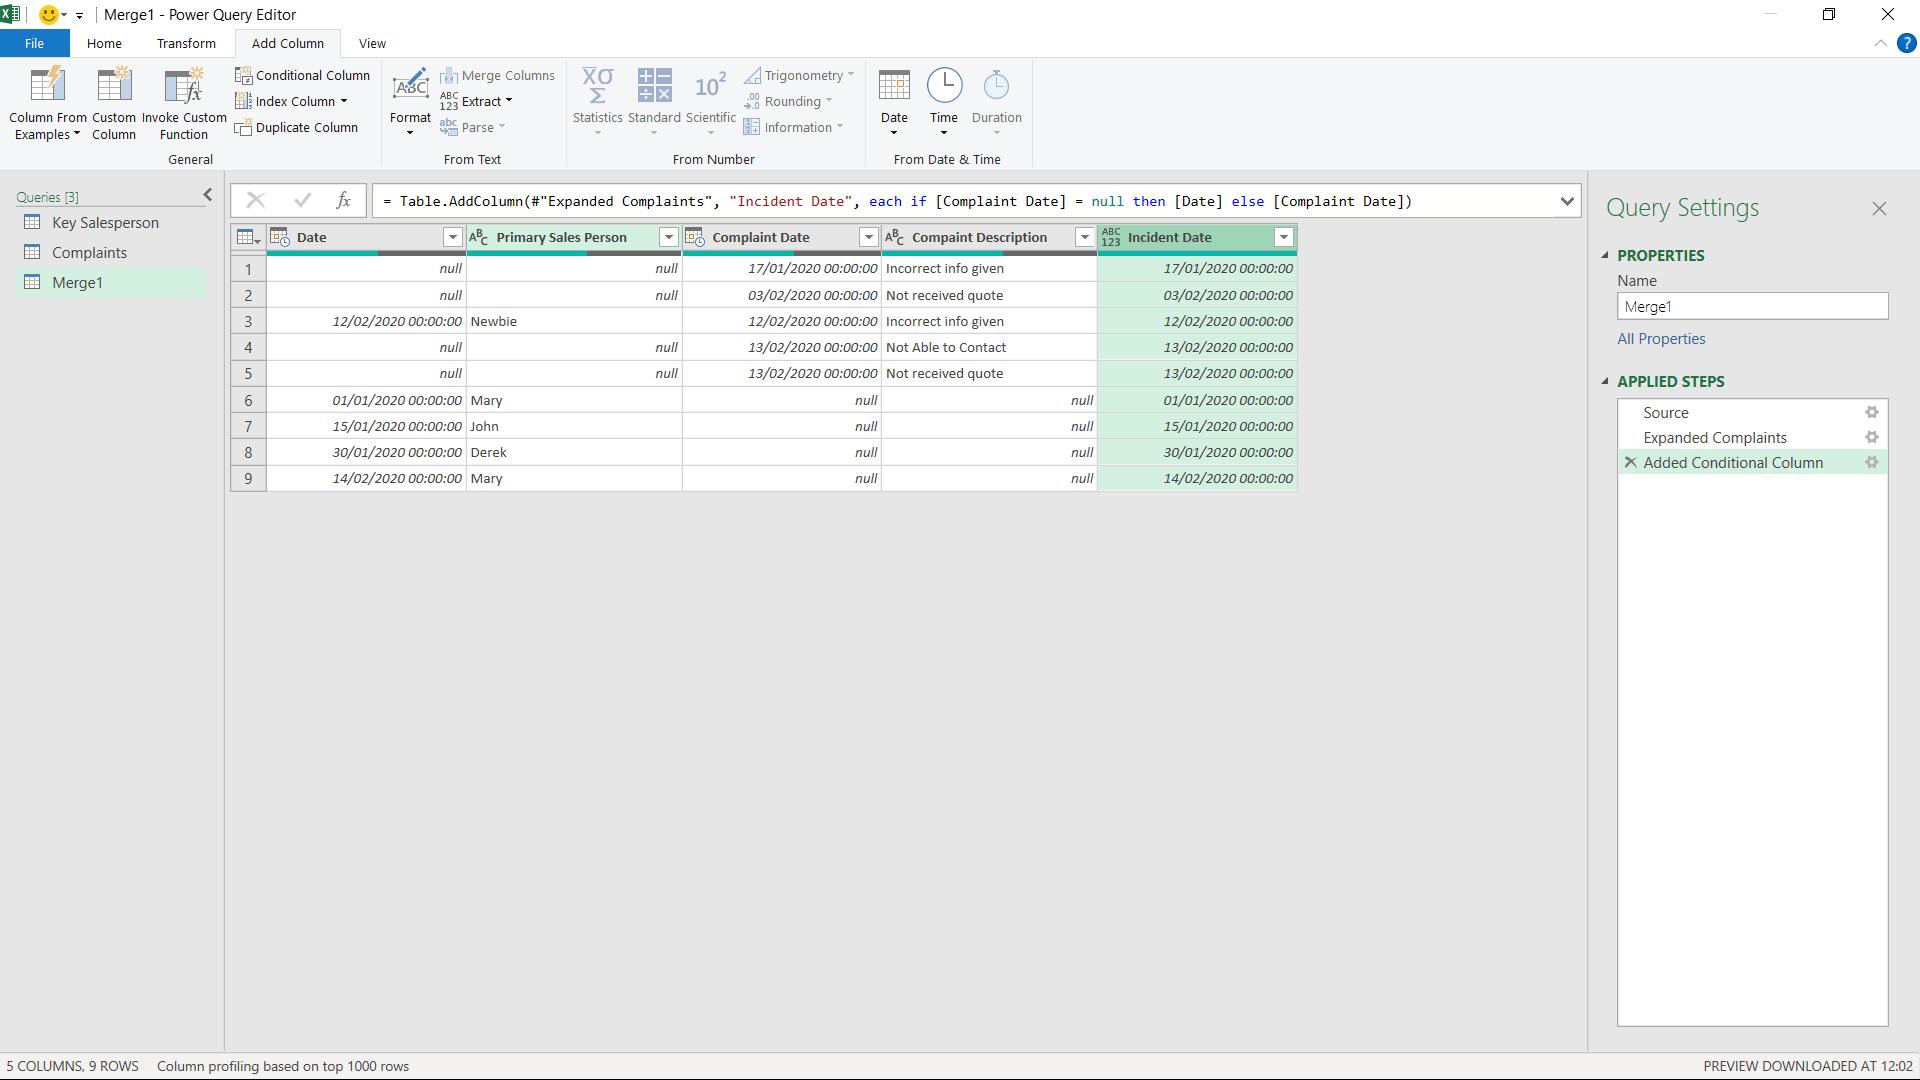
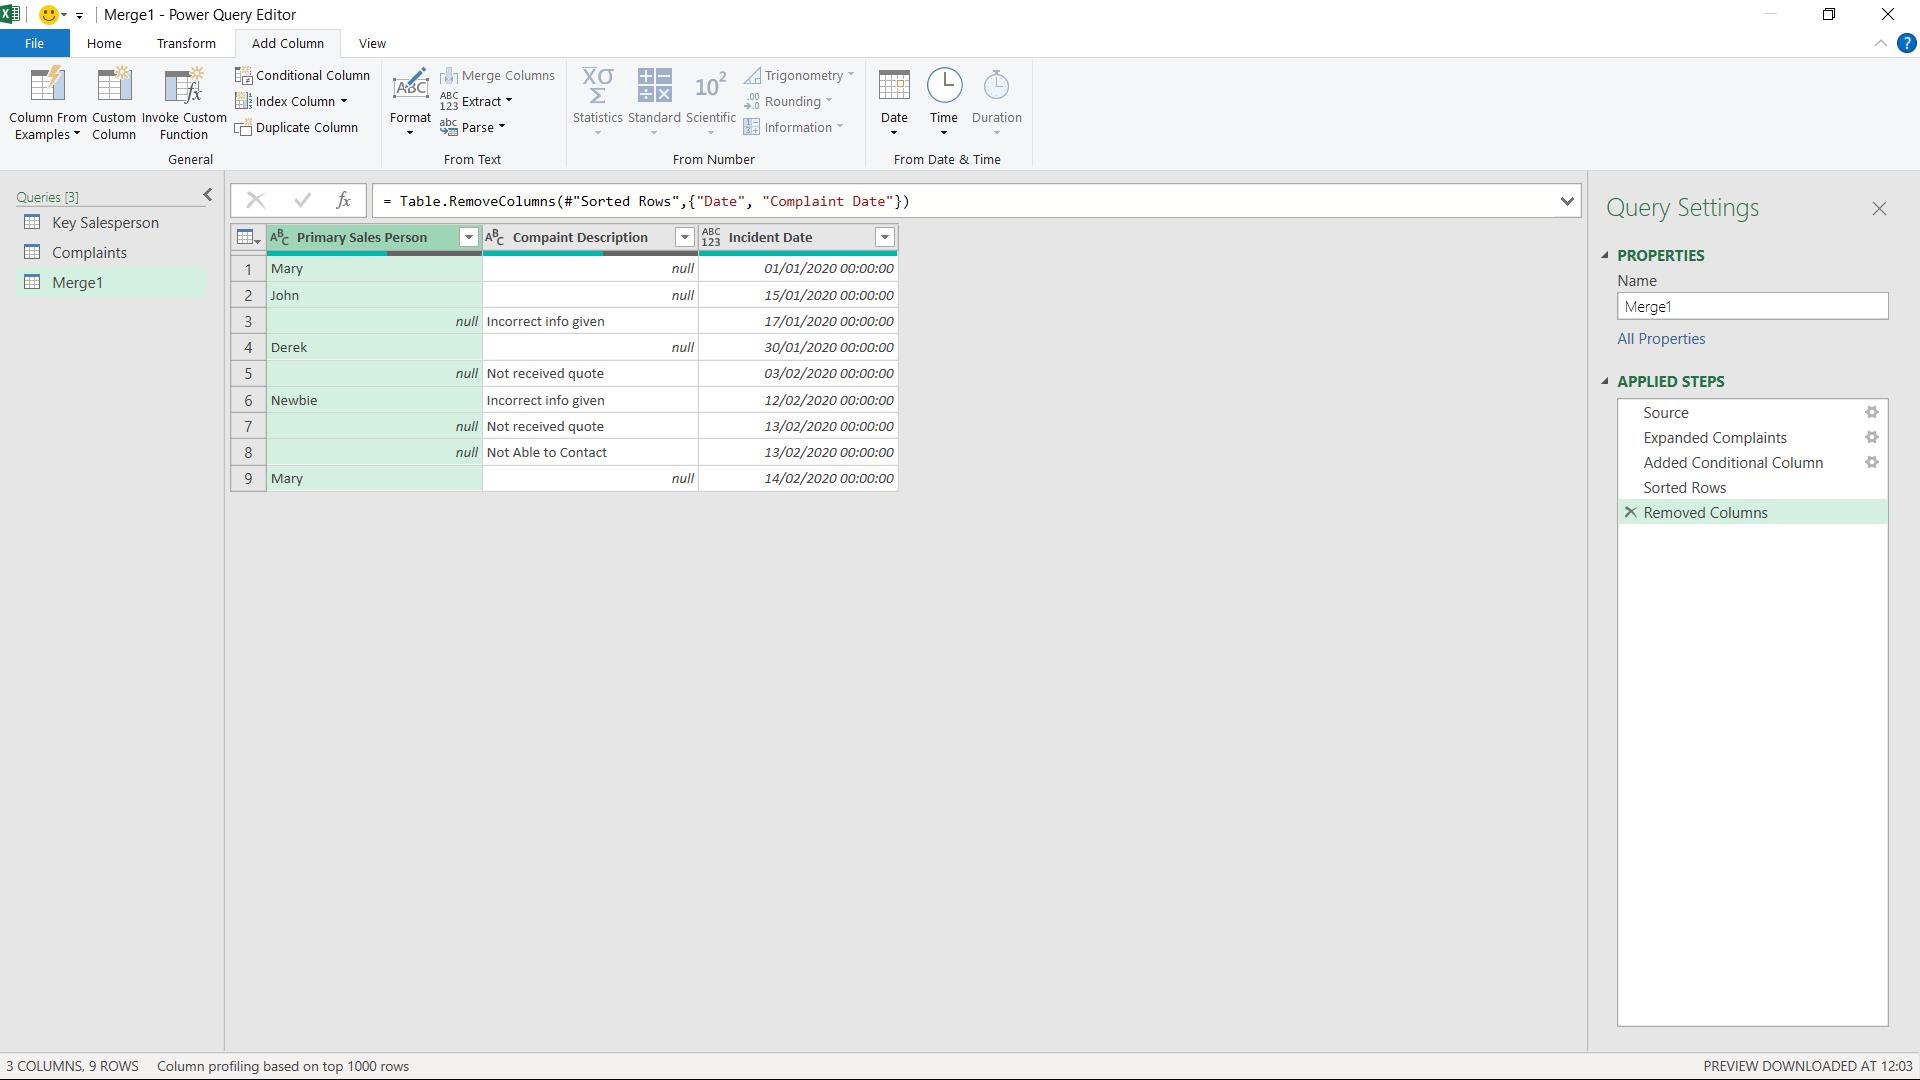
I remove the other date fields and sort on Incident Date.
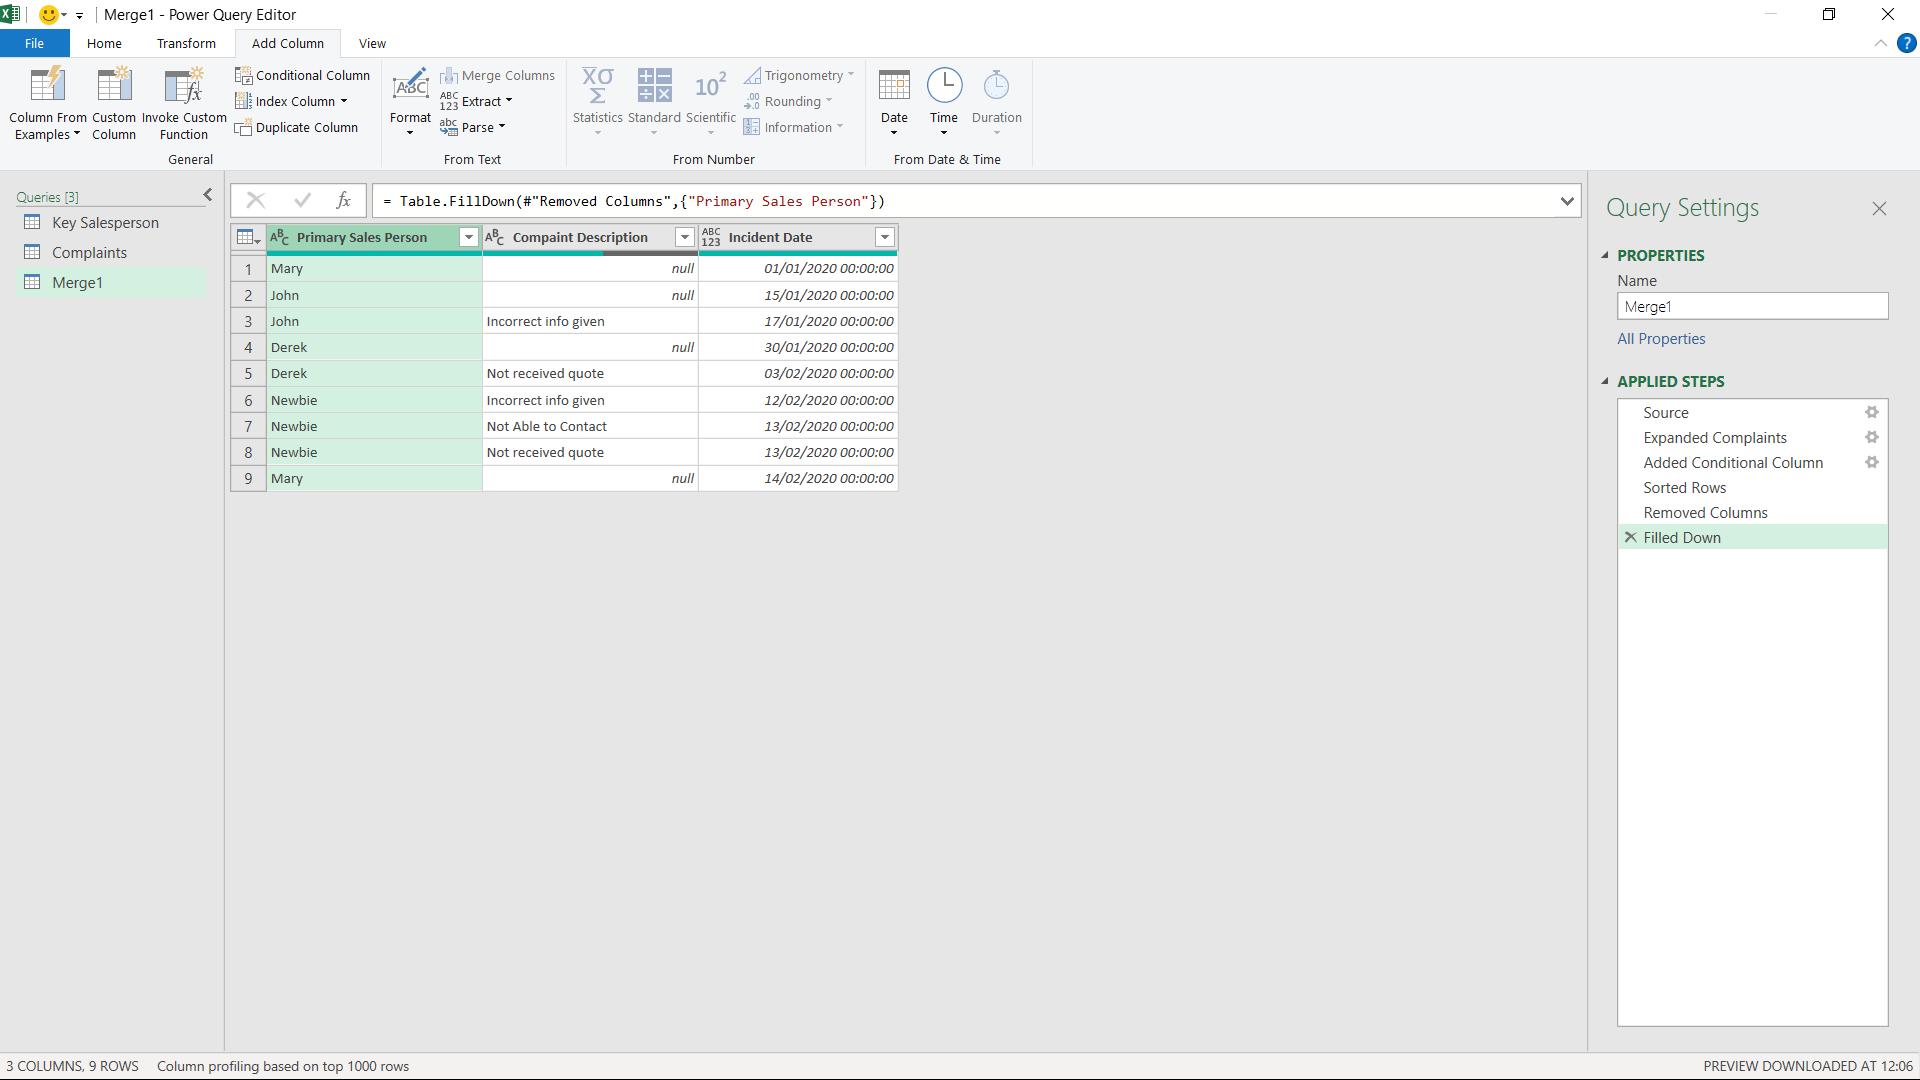
I fill down the salesperson name by selecting Primary Salesperson, right-clicking and selecting Fill and then ‘Fill Down’.
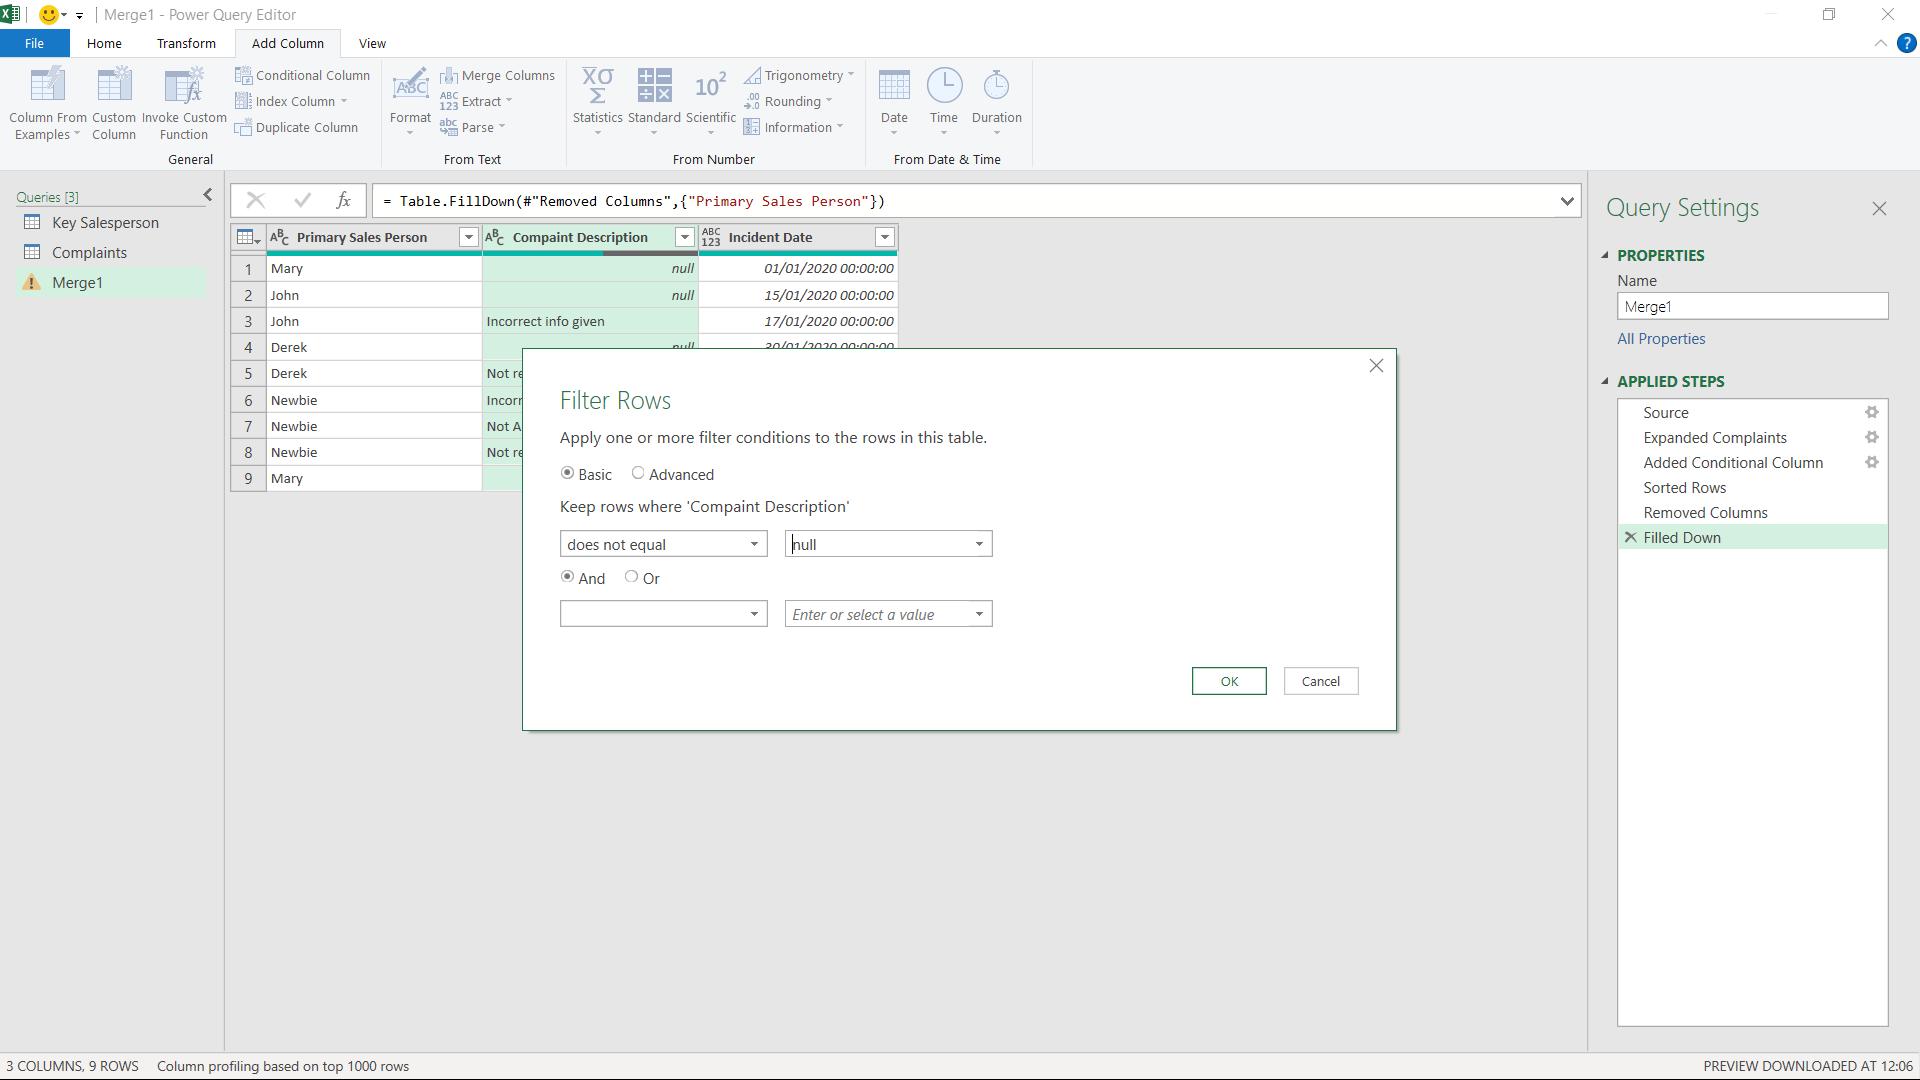
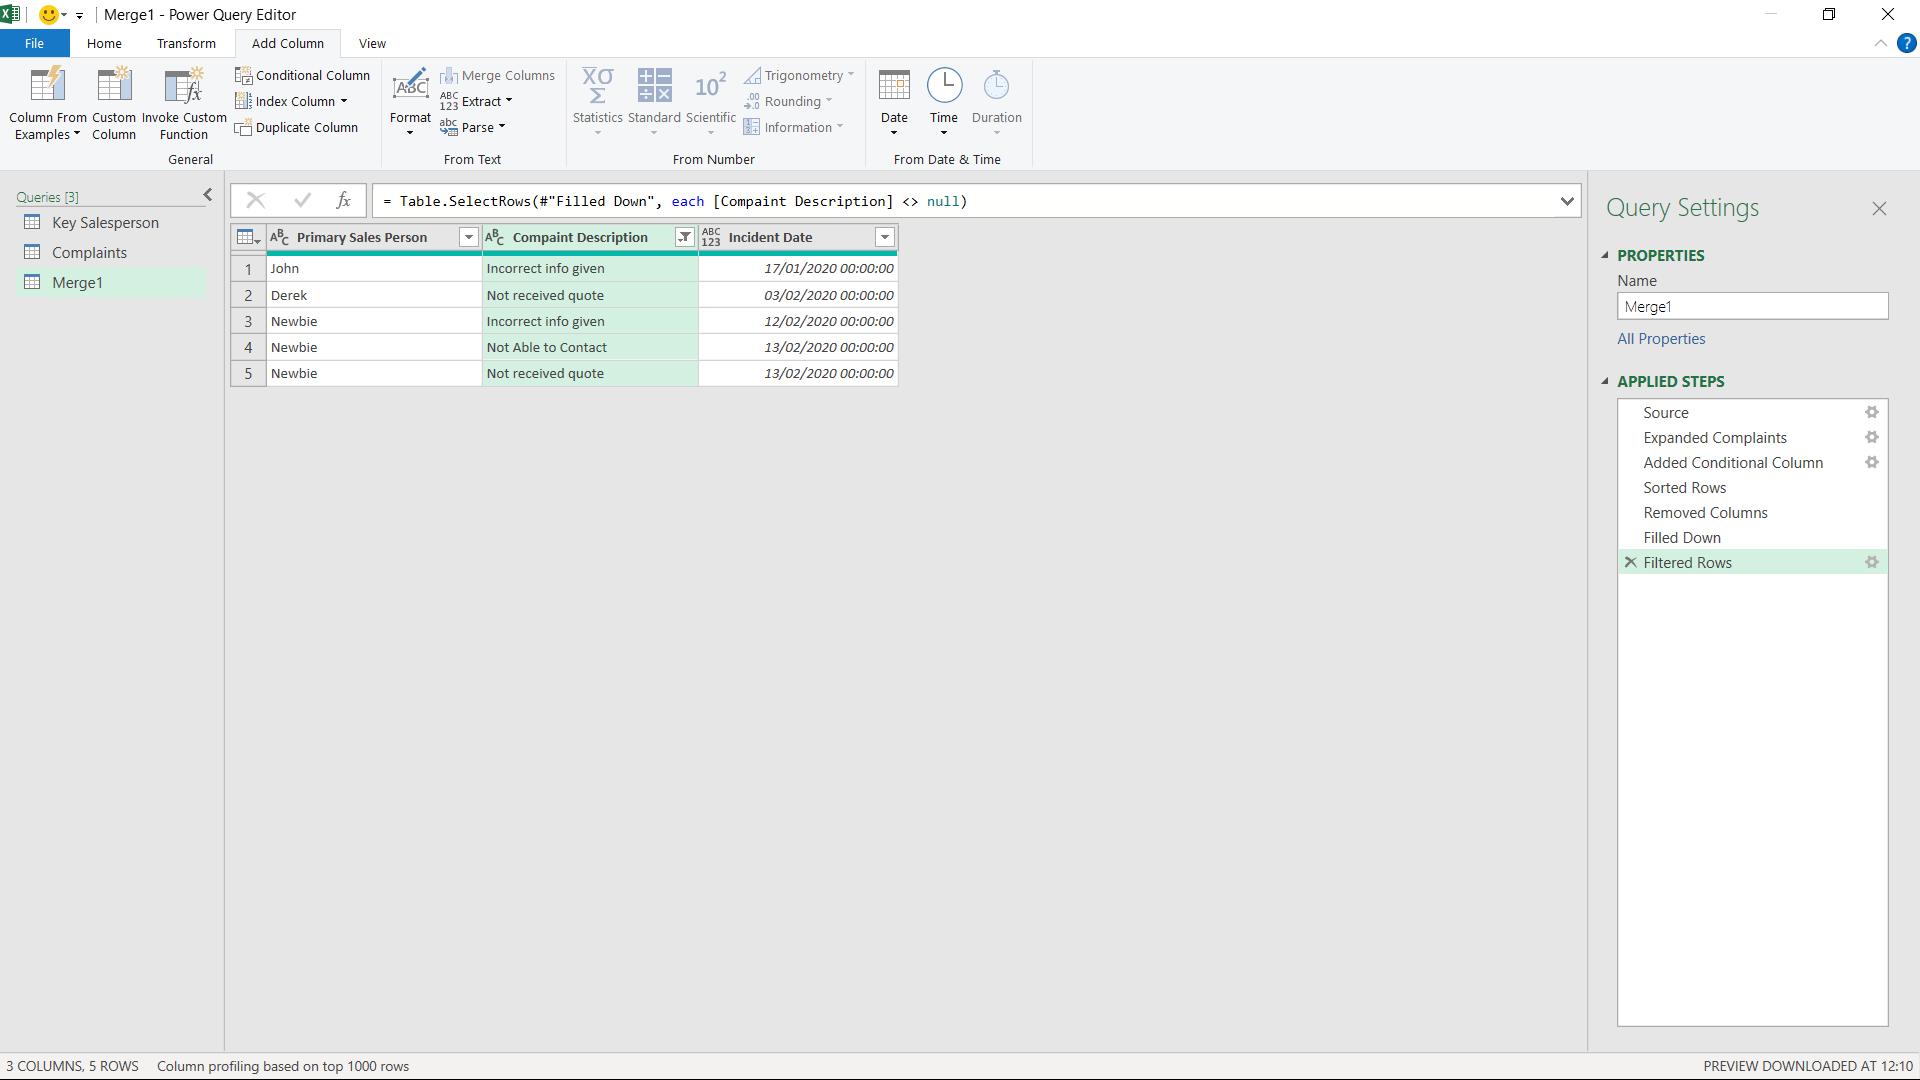
Finally, I select out rows where Complaint Description is null.
This gives me the data in the required format:
Next time, I’ll look at a much quicker way to achieve this result…
Come back next time for more ways to use Power Query!