
Power Query: More Fun with (Un)Pivot
18 December 2019
Welcome to our Power Query blog. This week, I look at another use for unpivoting.
John, my imaginary salesperson, has been creative with his accounts again.
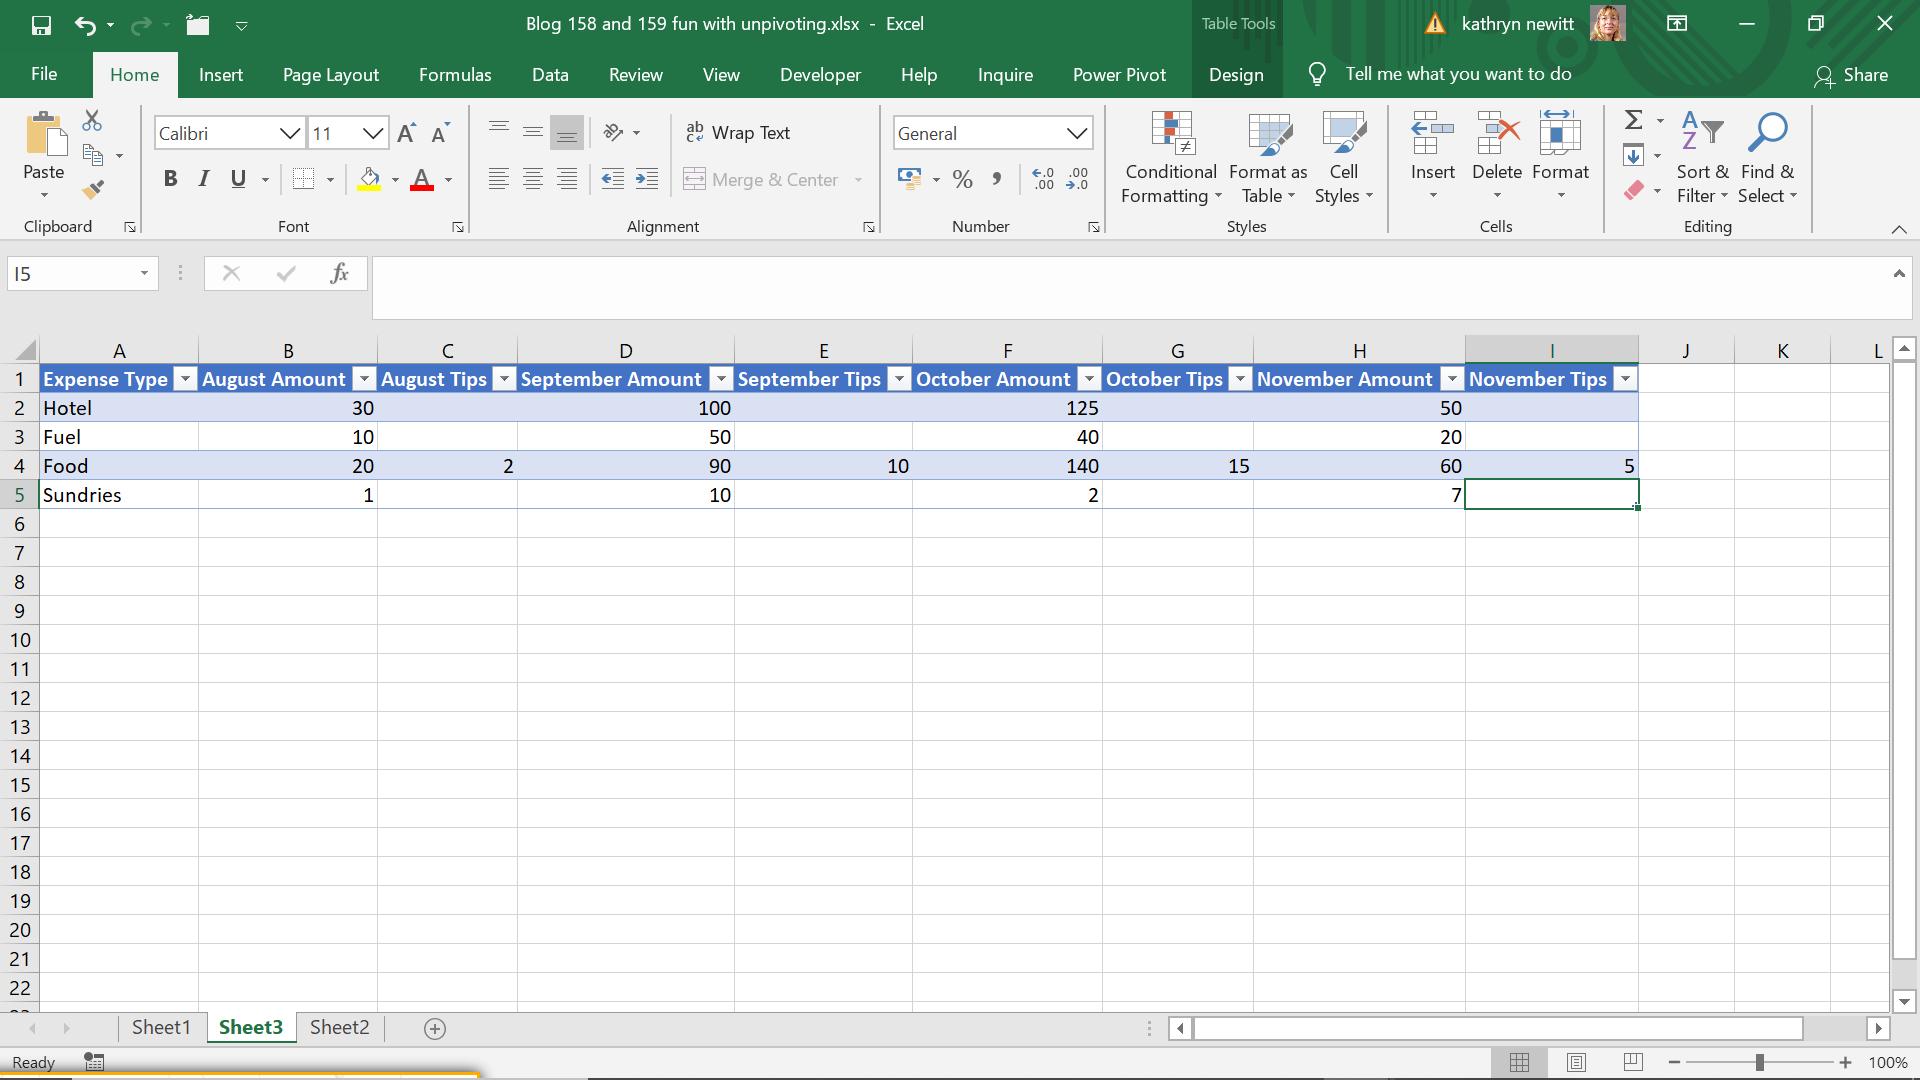
In this case, I’d like to see a column for months, a column for amounts, a column for expense category and for tips – that way, it’s much easier to add future data, as additional categories can be readily added.
I start by extracting the data into Power Query using the ‘From Table’ option on the ‘Get & Transform’ section of the ‘Data’ tab.
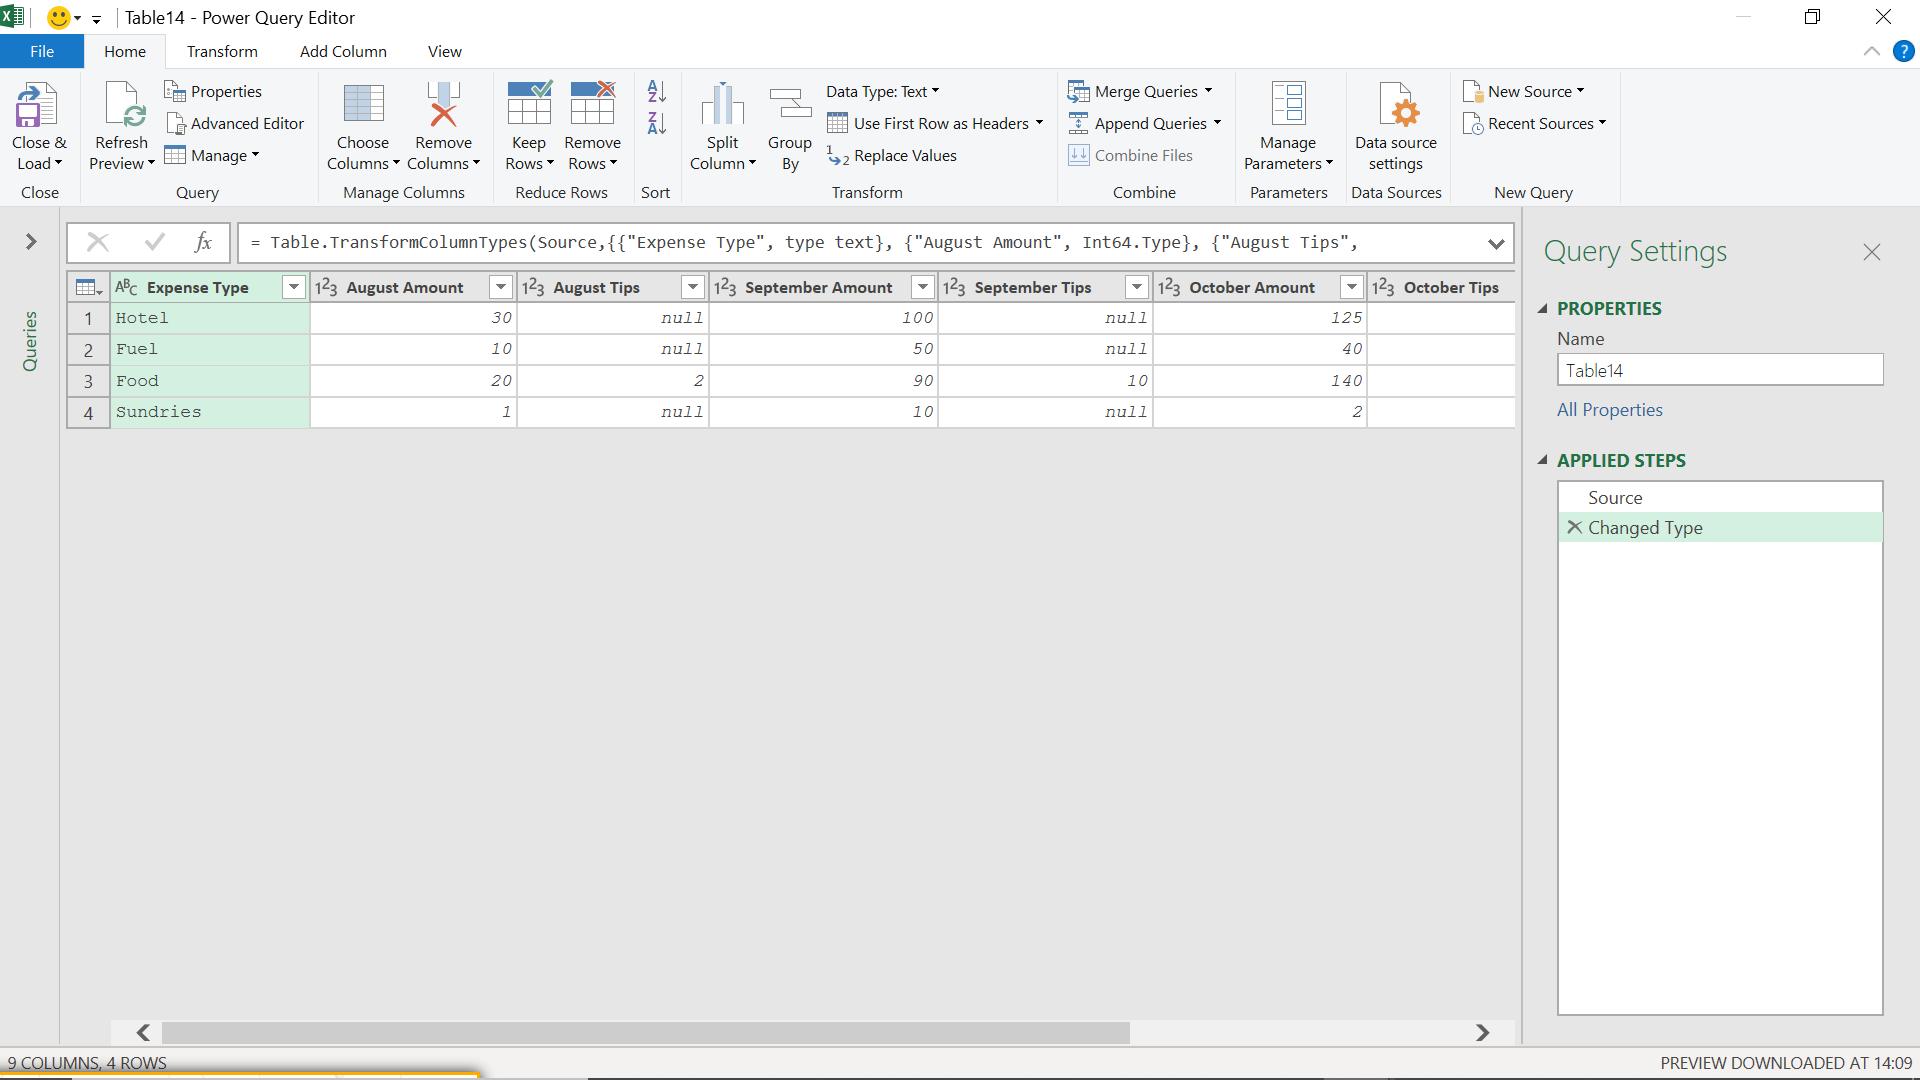
As with last week’s blog, I need to remove the ‘Changed Type’ step because it refers to specific month columns:
= Table.TransformColumnTypes(Source,{{"Expense Type", type text}, {"August Amount", Int64.Type}, {"August Tips", Int64.Type}, {"September Amount", Int64.Type}, {"September Tips", Int64.Type}, {"October Amount", Int64.Type}, {"October Tips", Int64.Type}, {"November Amount", Int64.Type}, {"November Tips", Int64.Type}})
I delete this step.
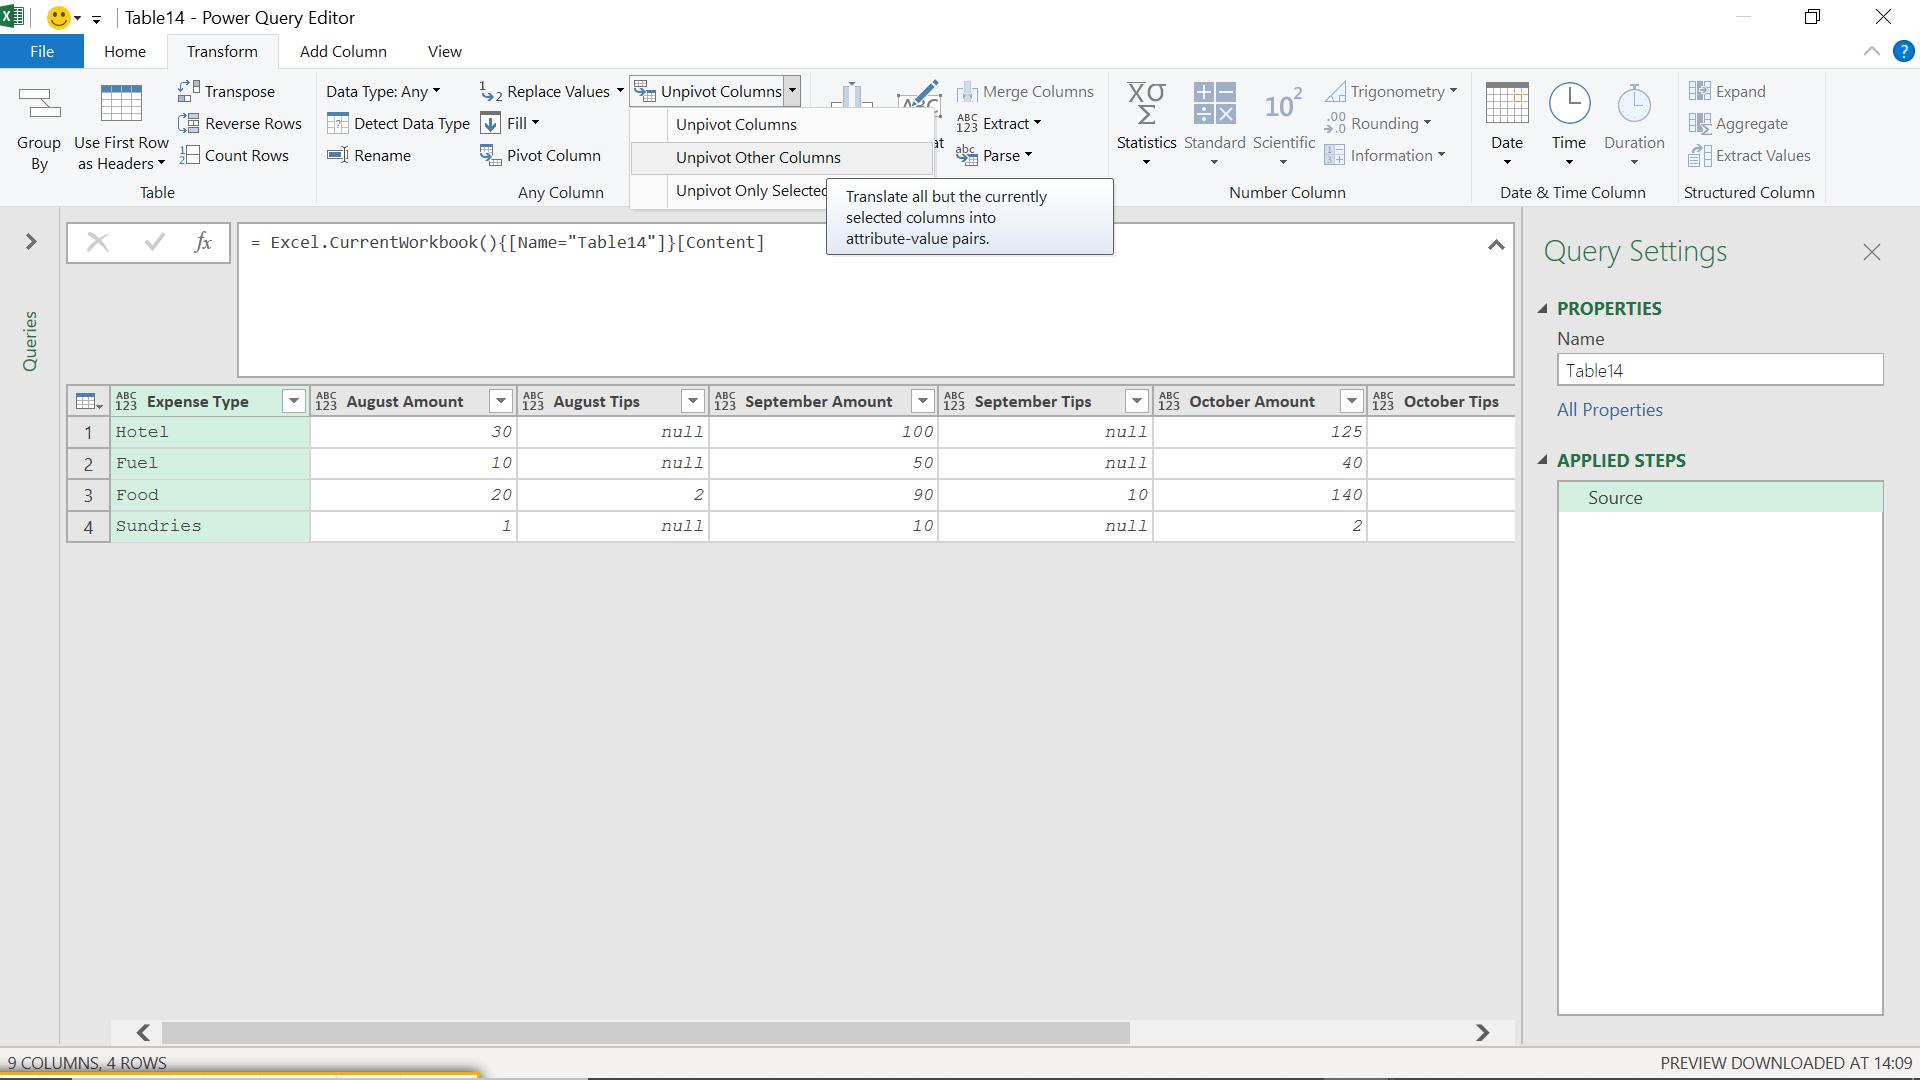
I need to avoiding referencing month names in the columns; to achieve this, I select the Expense Type column, and opt to unpivot the other columns.
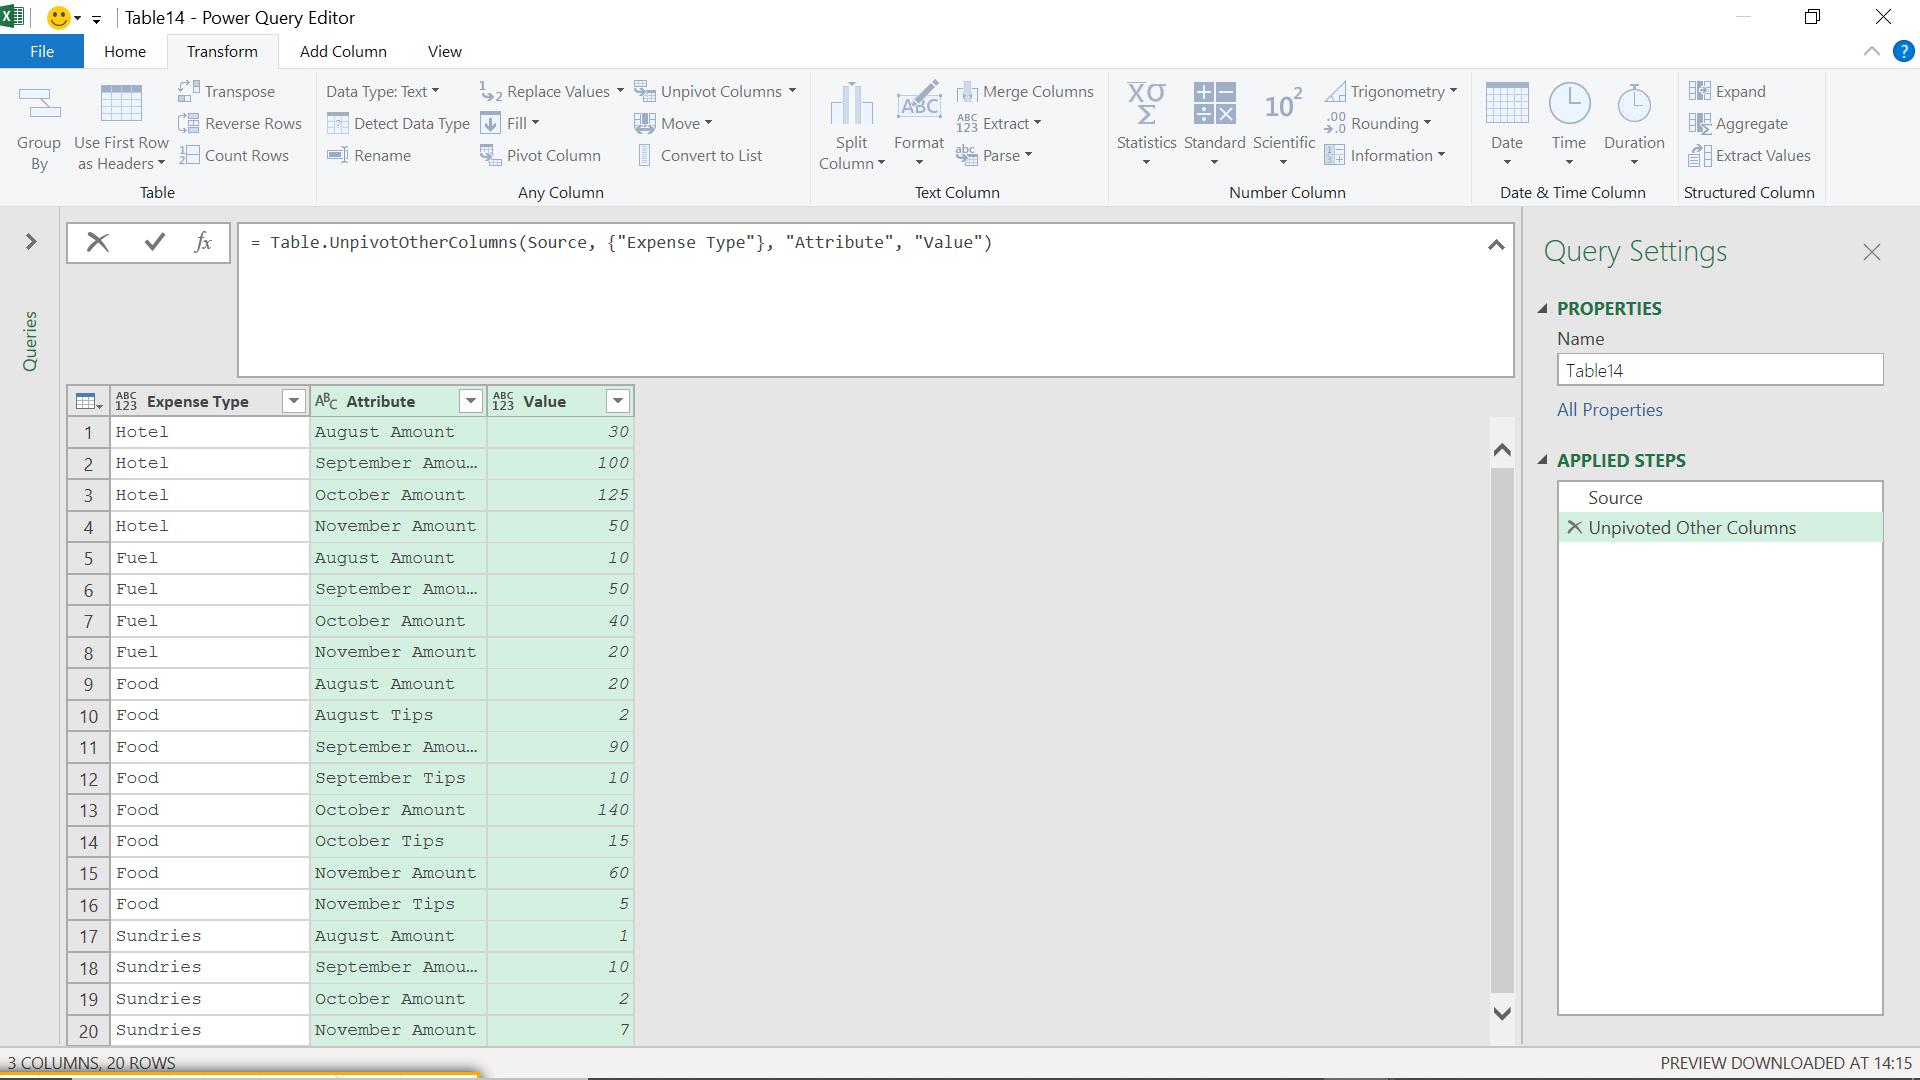
The M code generated is:
= Table.UnpivotOtherColumns(Source, {"Expense Type"}, "Attribute", "Value")
This is good because there is no mention of the month columns. The months, amounts and tip titles now appear as data under the Attribute column. I need to perform further transformations to sort out this column. I begin by splitting the Attribute column into the separate titles.
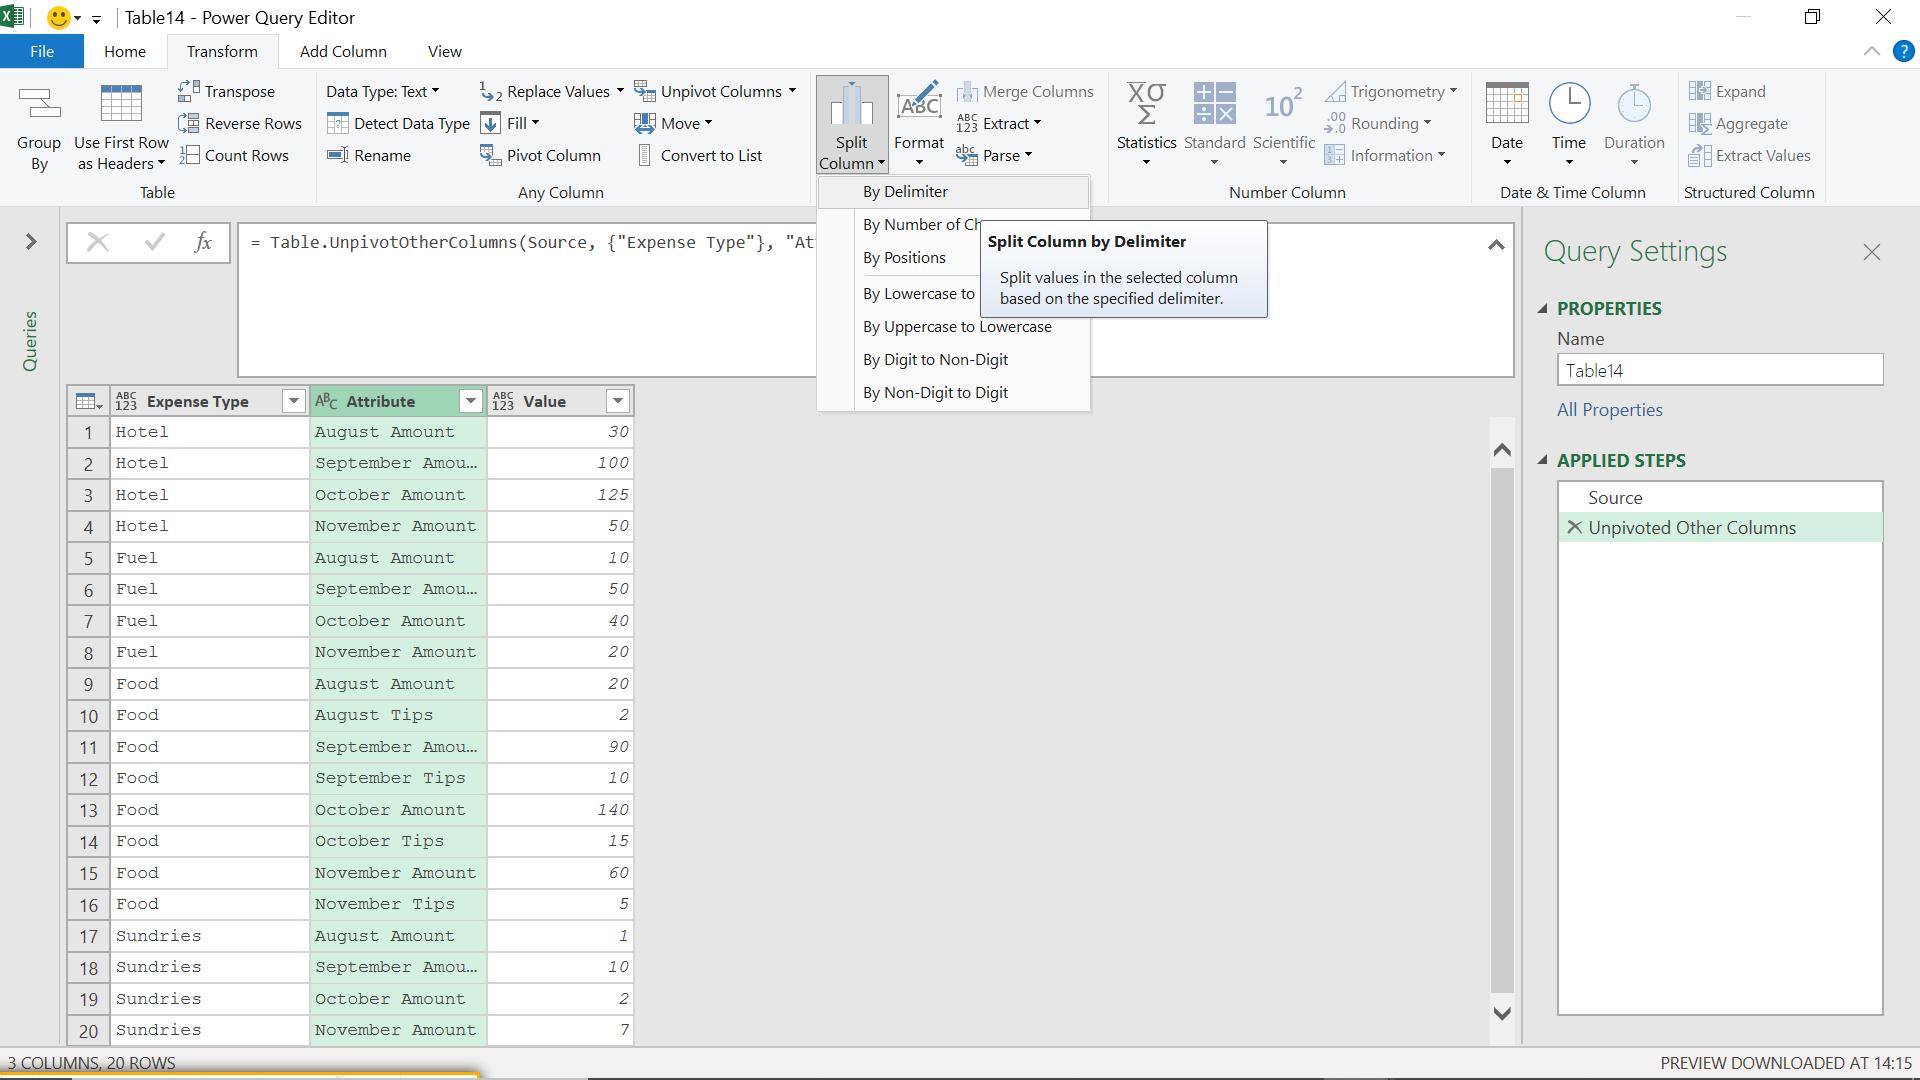
I opt to use ‘Split Columns’ on the ‘Transform’ tab, and choose ‘By Delimiter’.
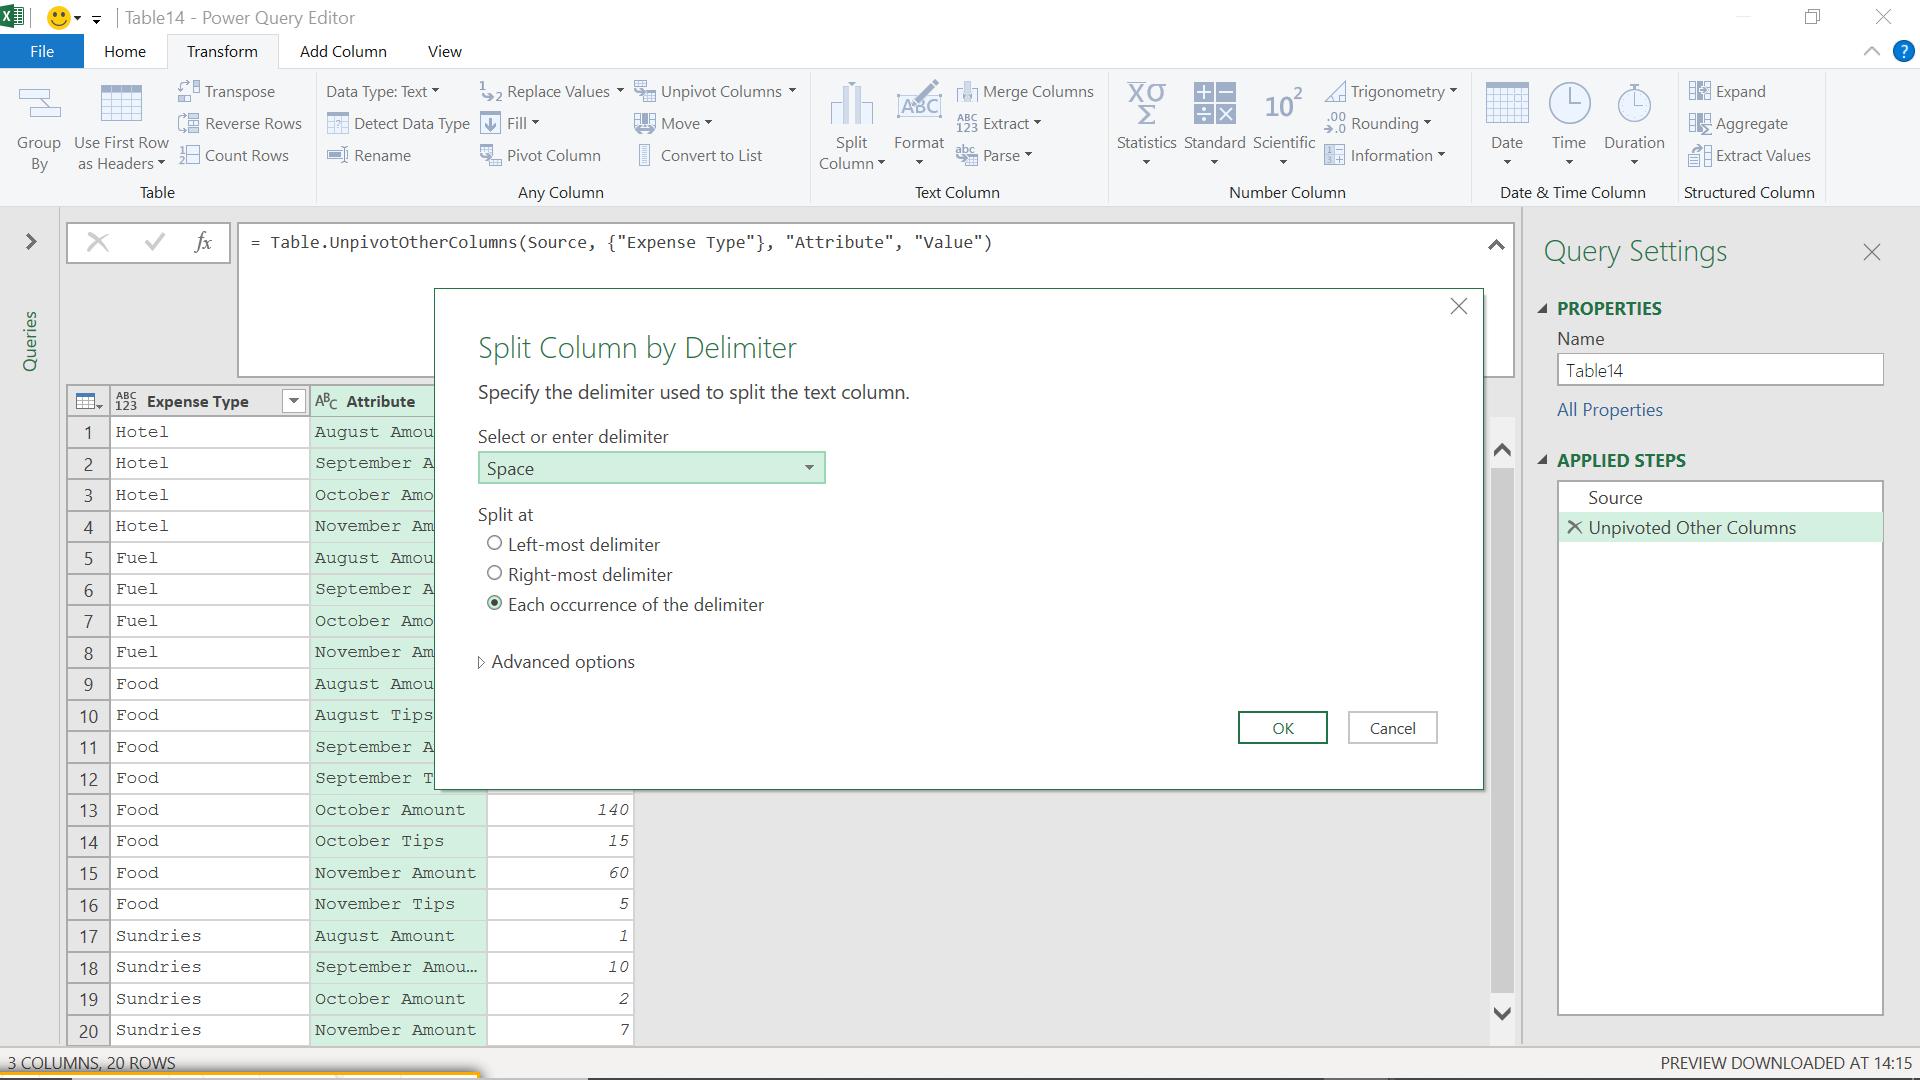
I choose to split at ‘Space’.
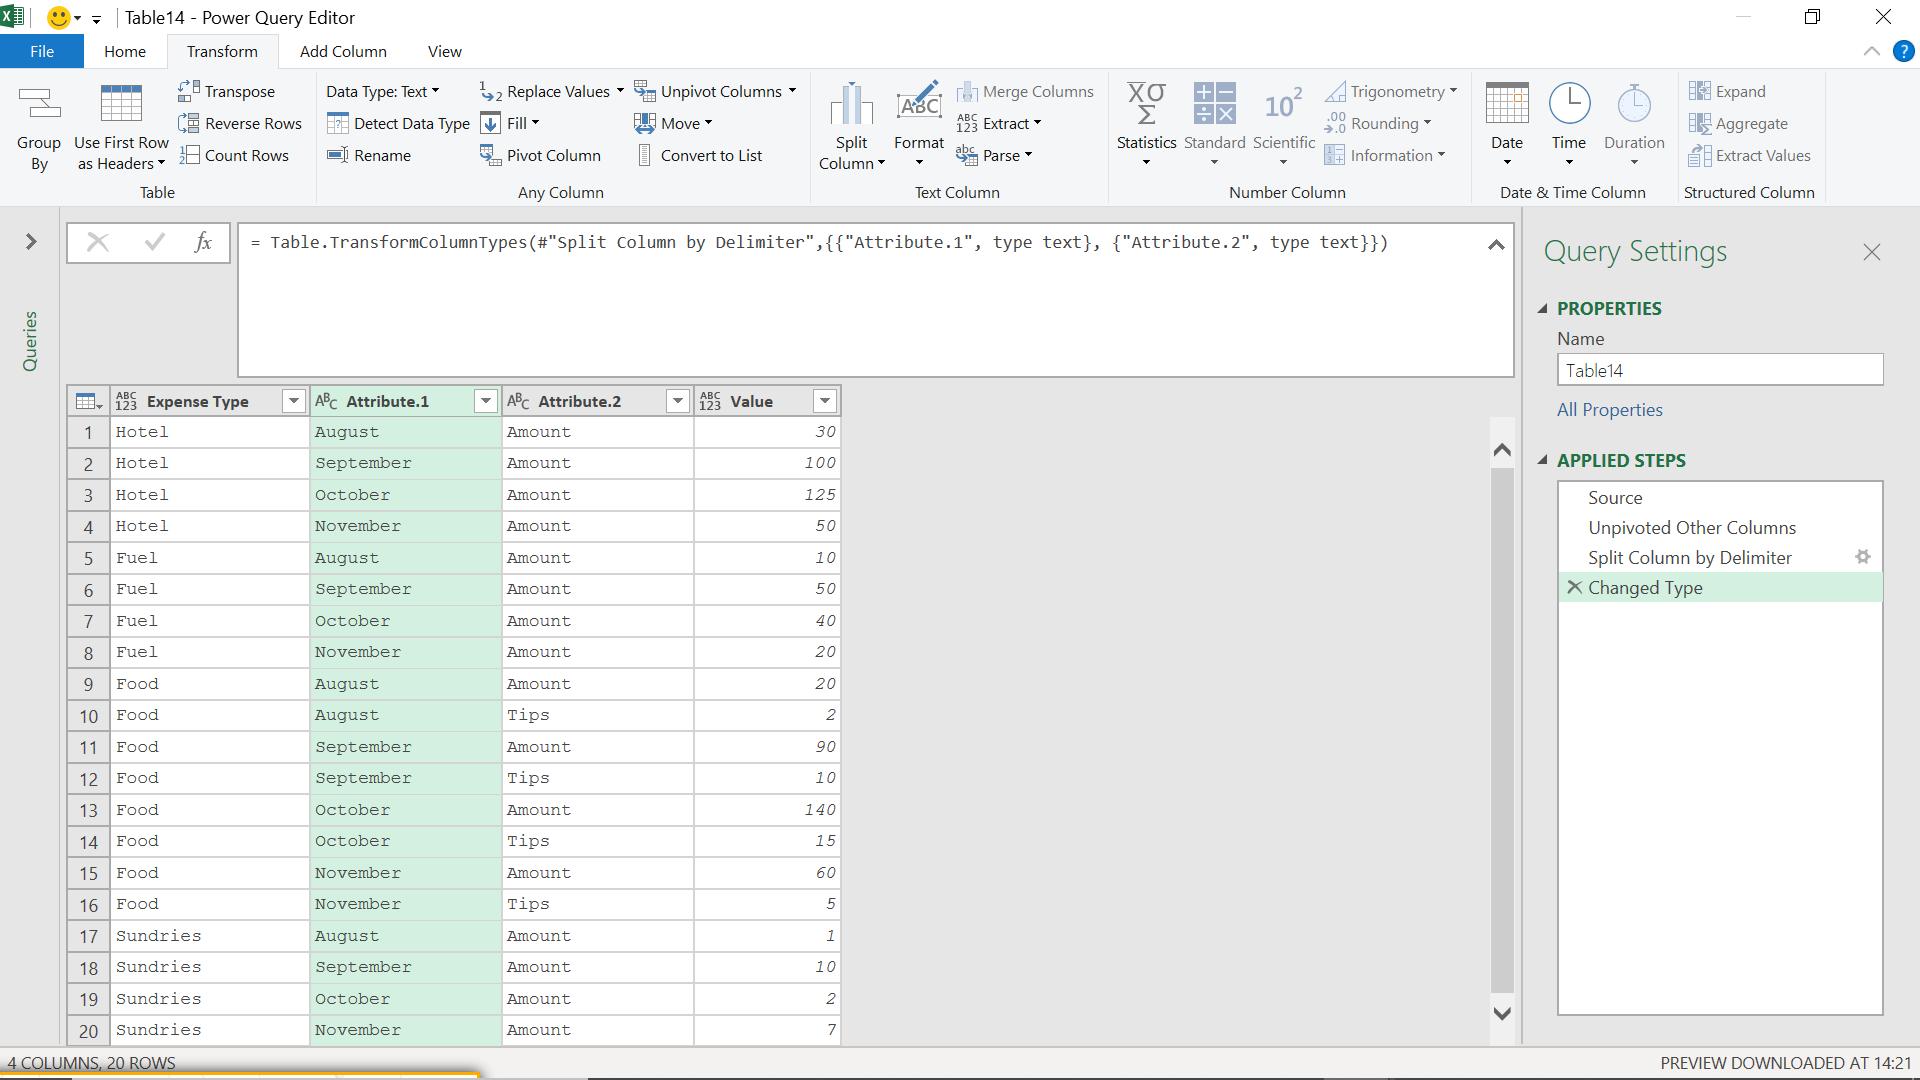
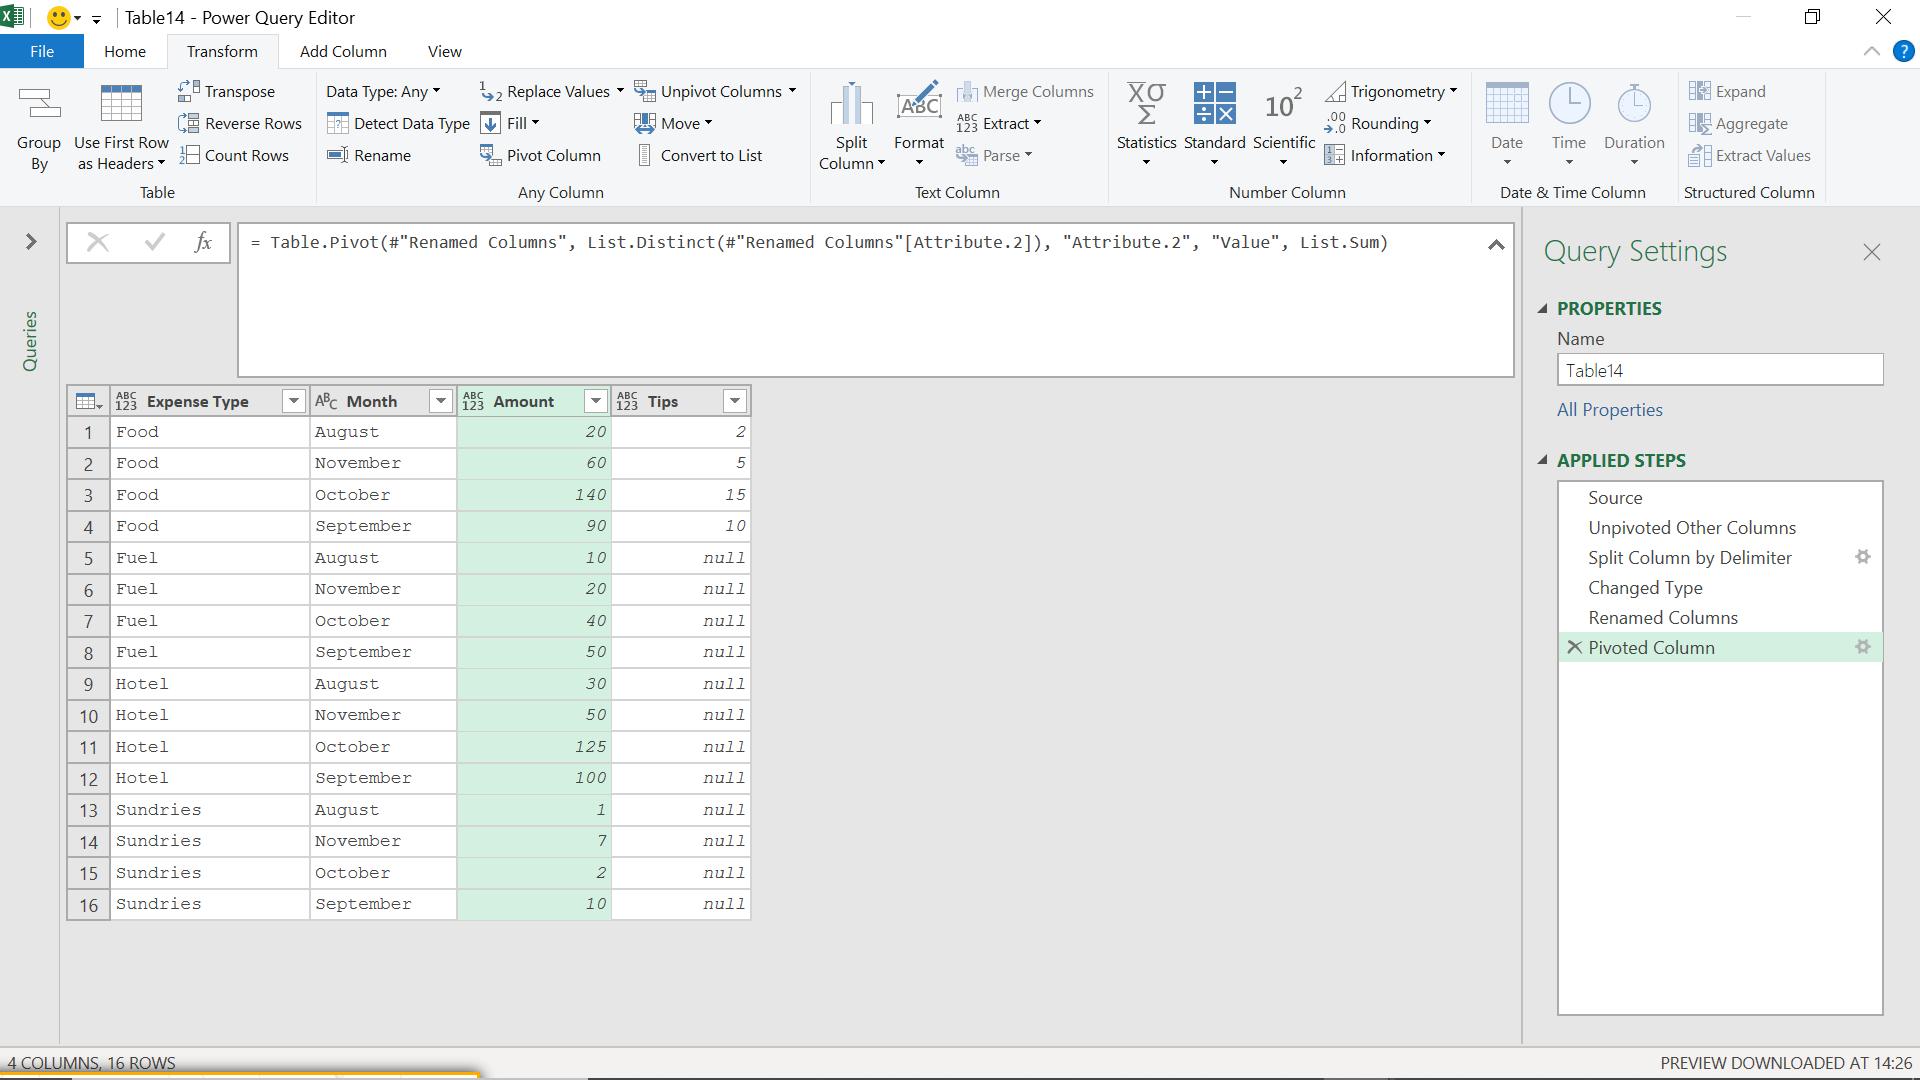
I can rename Attribute.1 to Month. Attibute.2 contains my two other column headings, so I need to pivot this column by selecting it and using the ‘Pivot’ option on the ‘Transform’ menu.
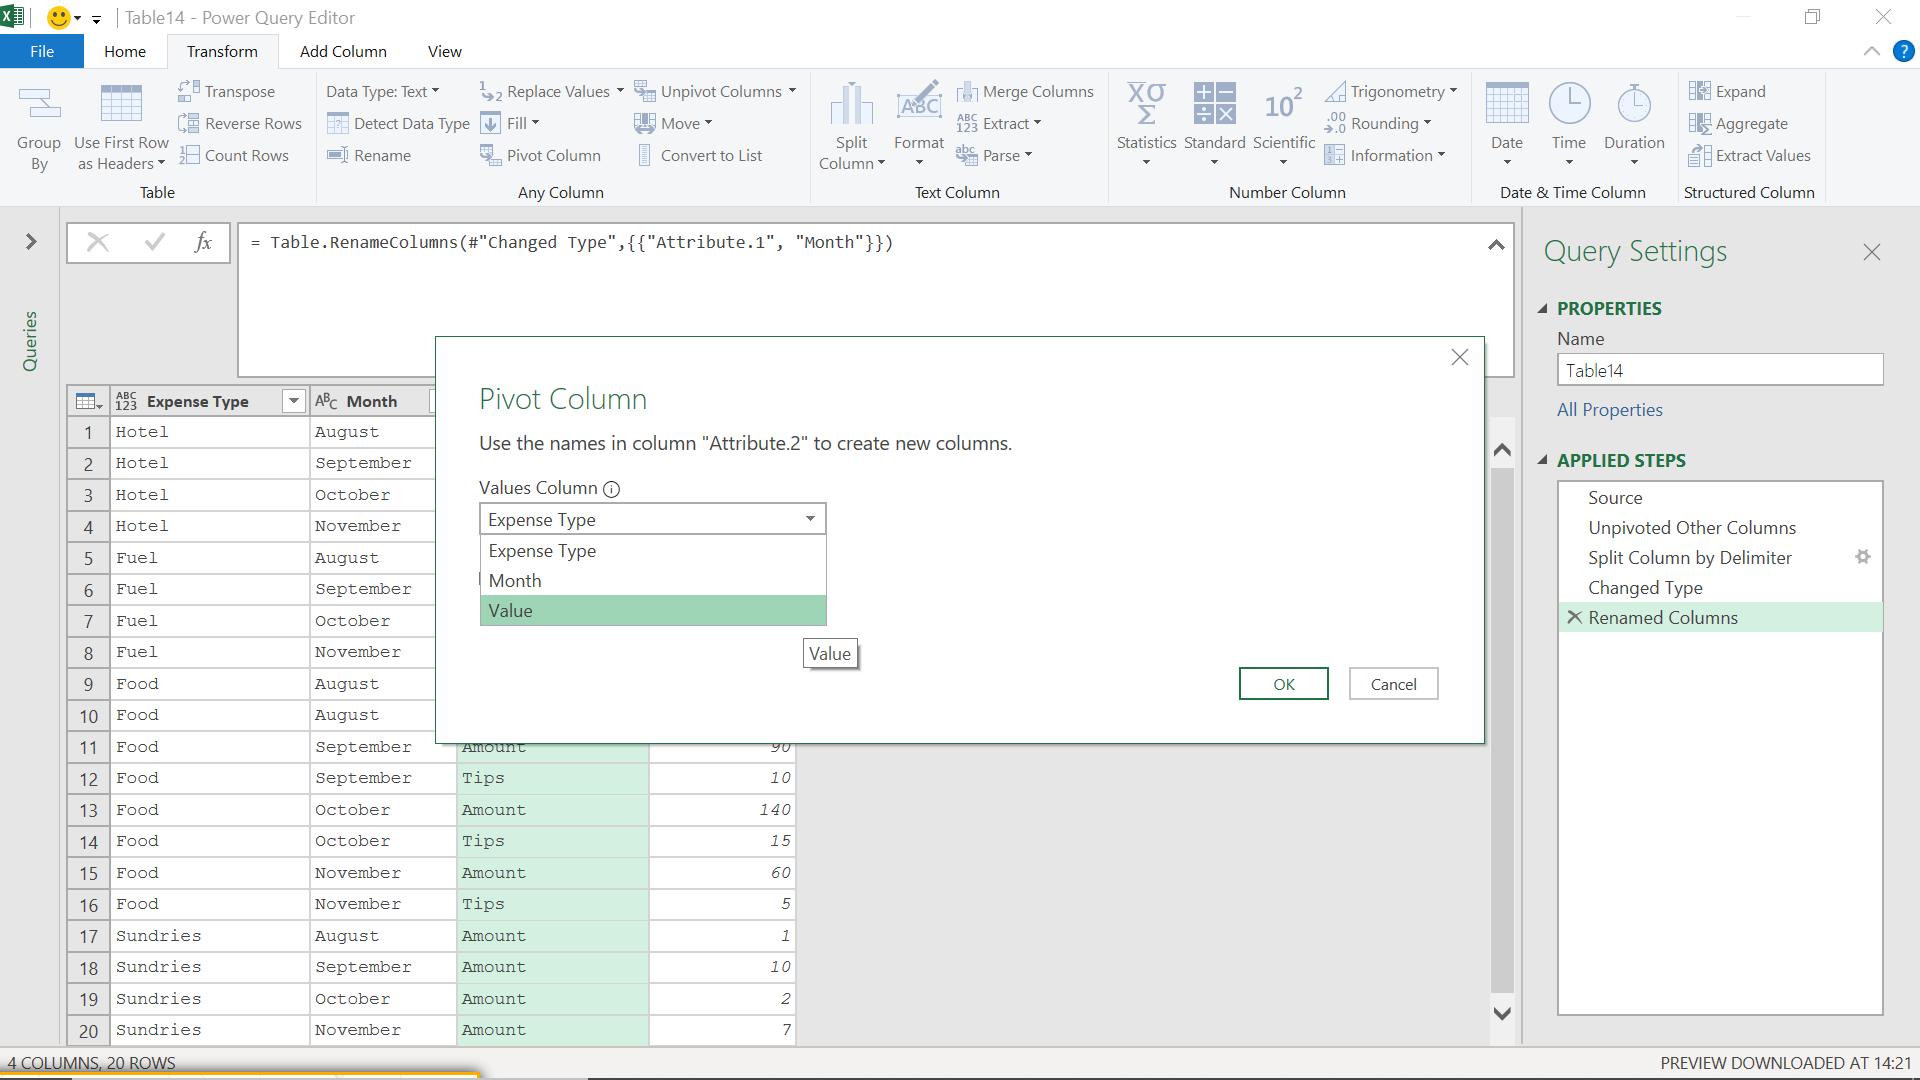
I need to choose what to put in my new columns; they should contain the associated Value, since that contains the amount.
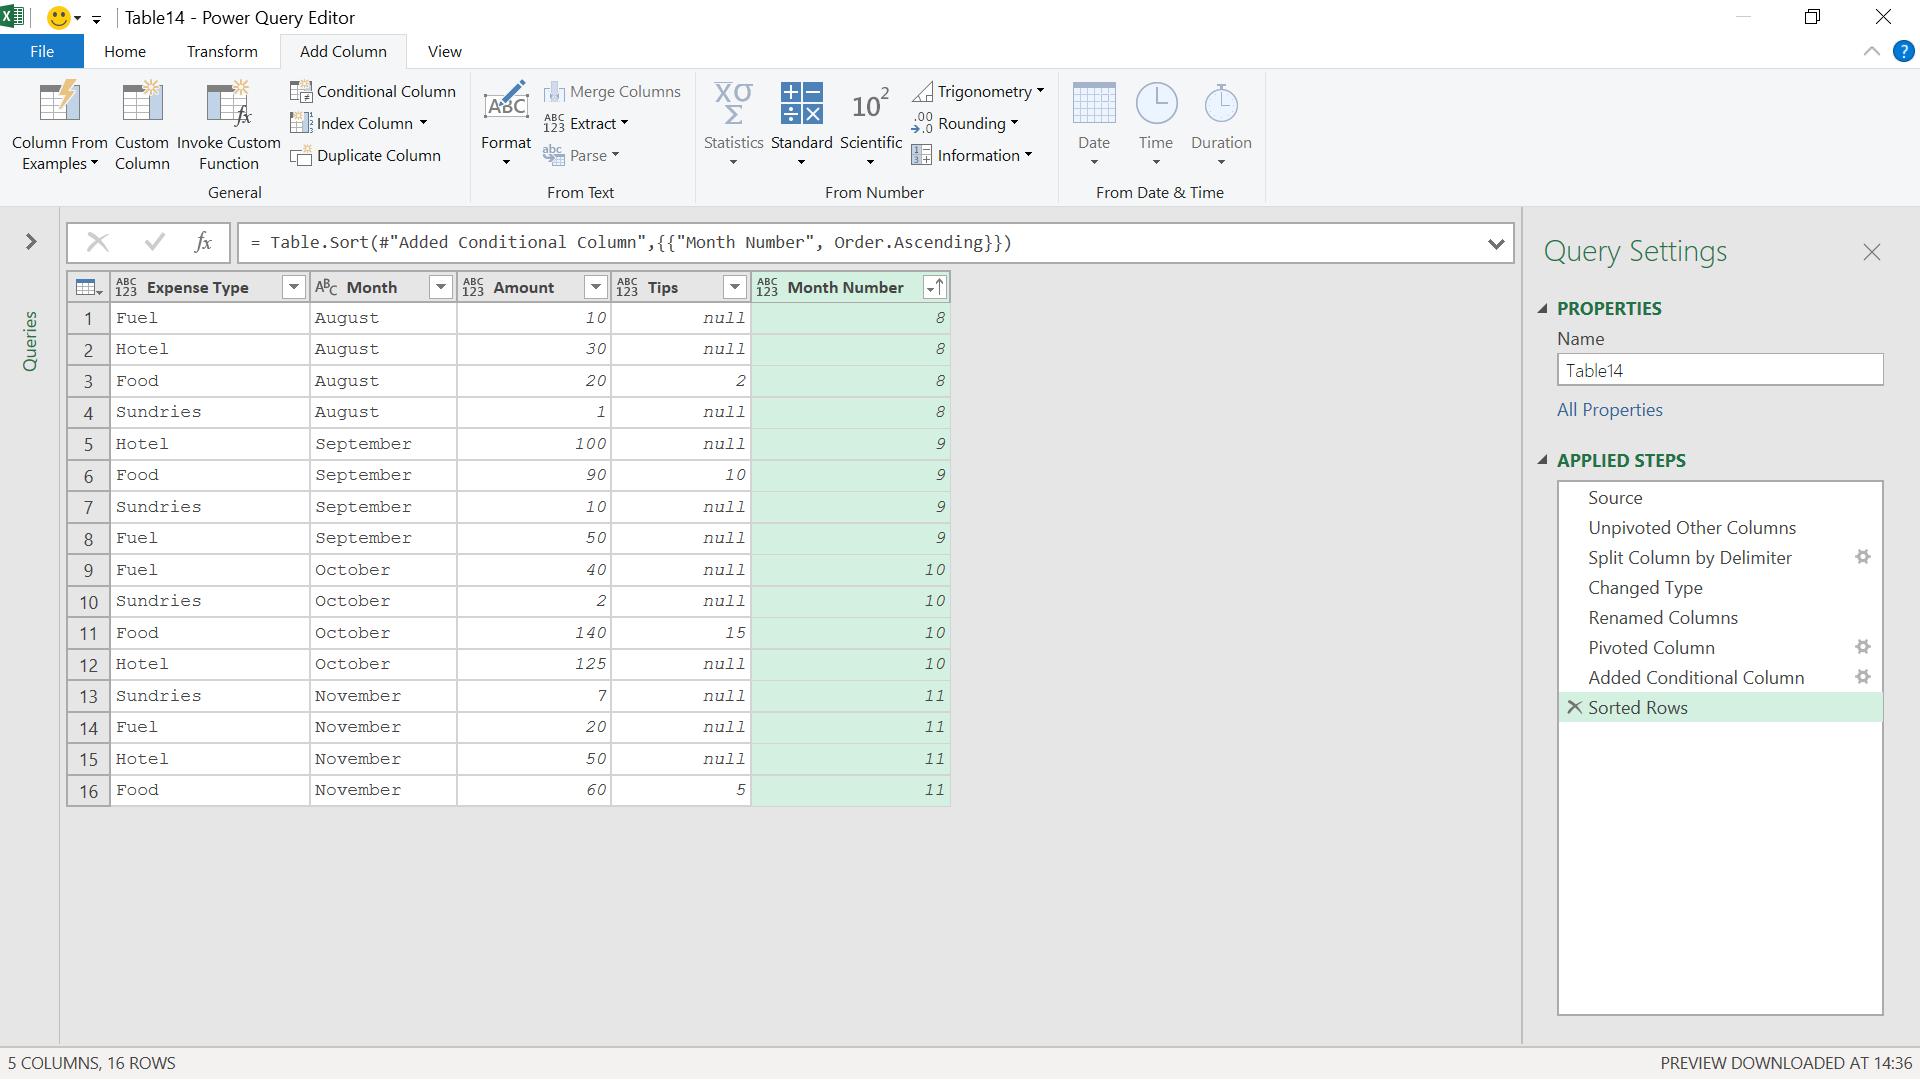
Finally, I choose to order by month, since that makes the data easier to read. I need to create a temporary column with month number in order to do this, as I don’t want the months in alphabetical order!
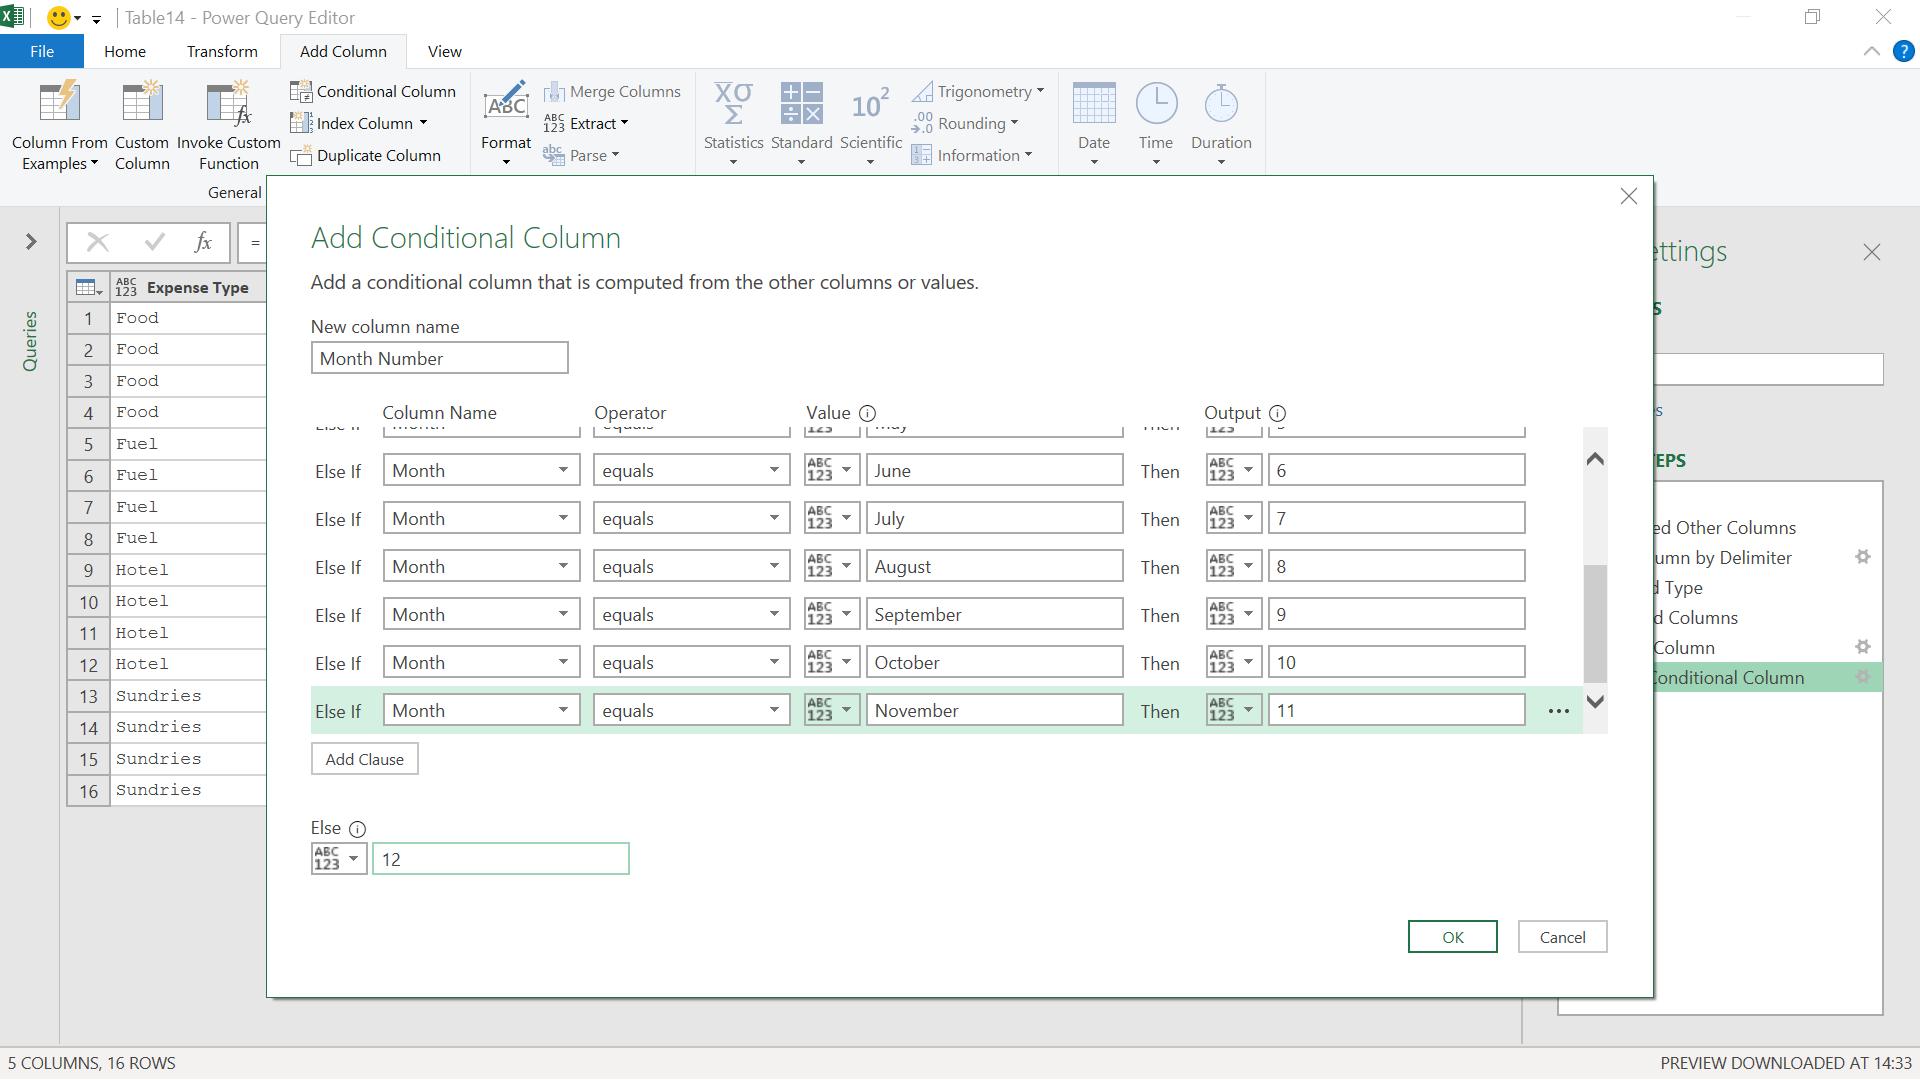
I create this column and sort by it.
I can now delete the Month Number column.
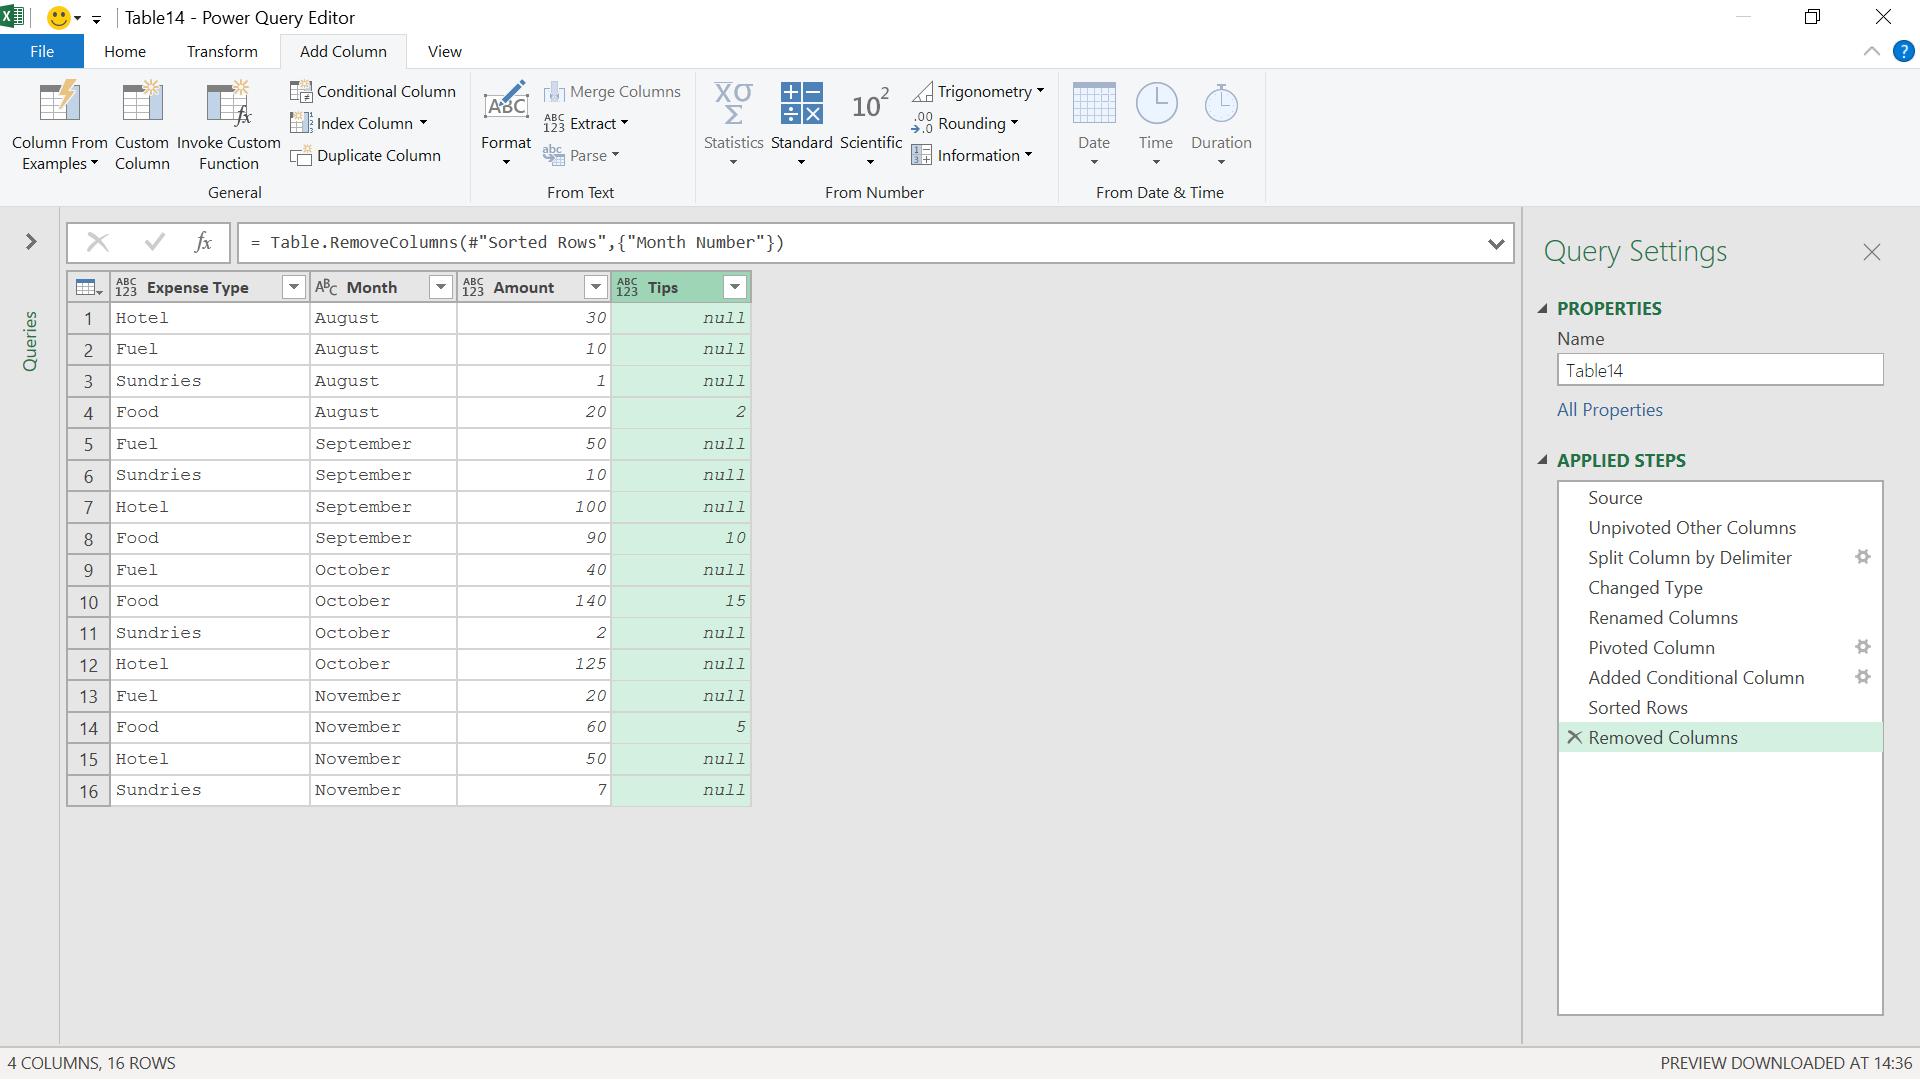
My data is now ready to append and update if further months are added. Next time, I will look at another example of unpivoting.
Come back next time for more ways to use Power Query!