
Power Query: More Haste Less Steps Part 1
20 April 2022
Welcome to our Power Query blog. This week, I look a query with too many steps.
I have created a Dates query:
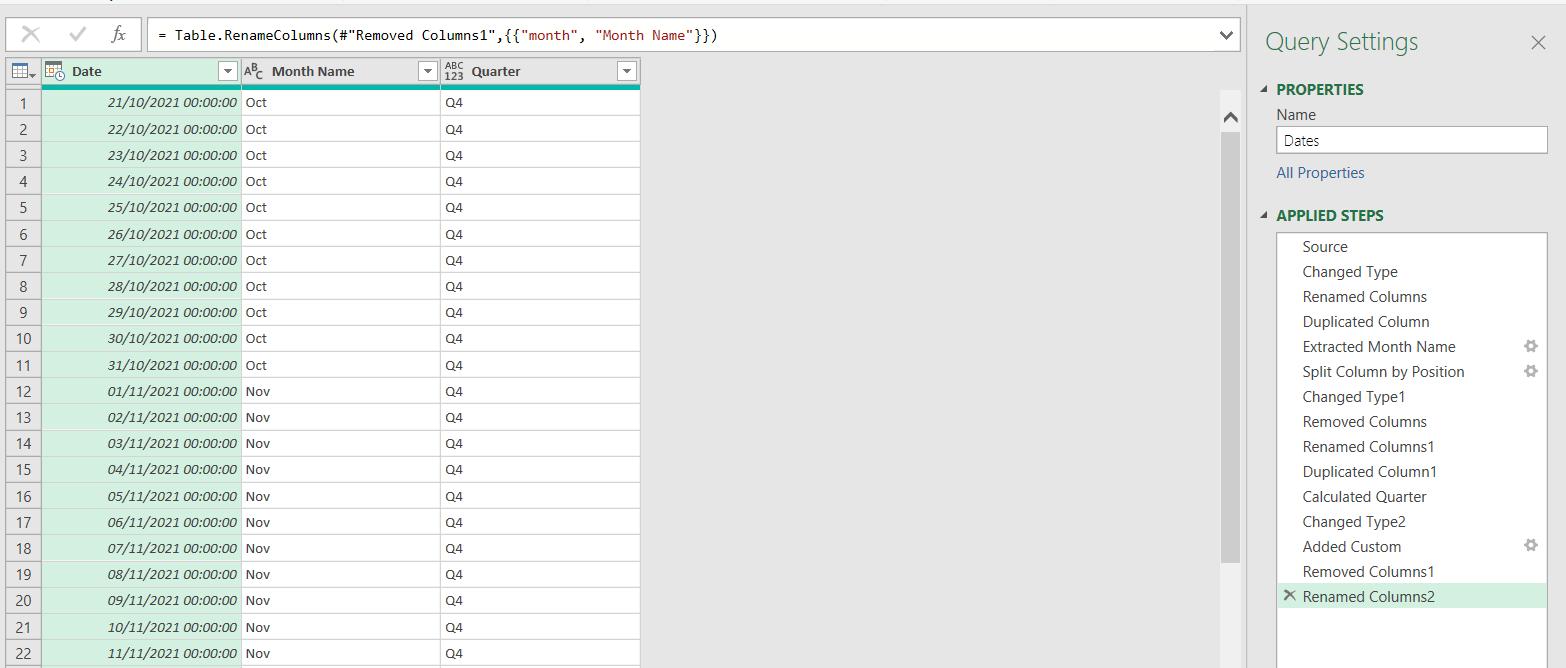
I have deliberately gone the long way round to create this query! Ignoring the first three [3] steps, it has taken me twelve [12] steps to achieve my goal.
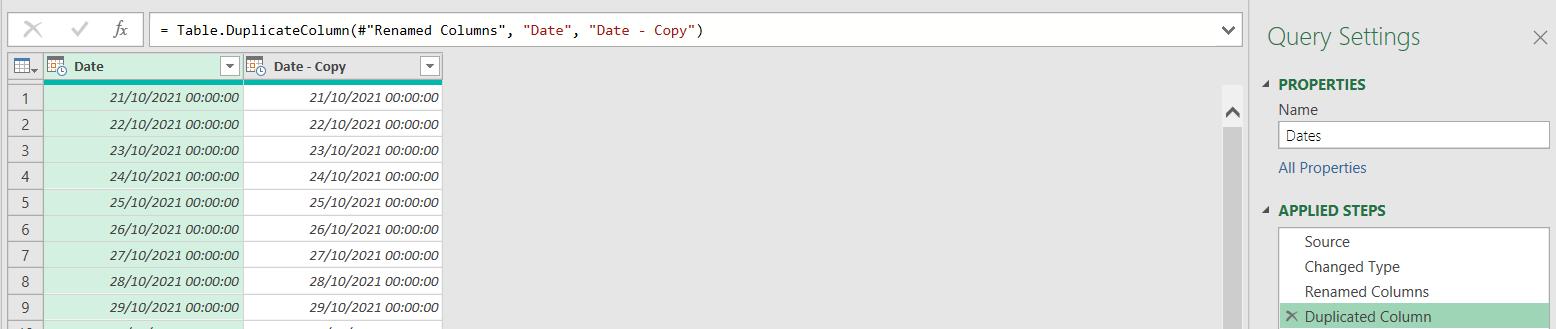
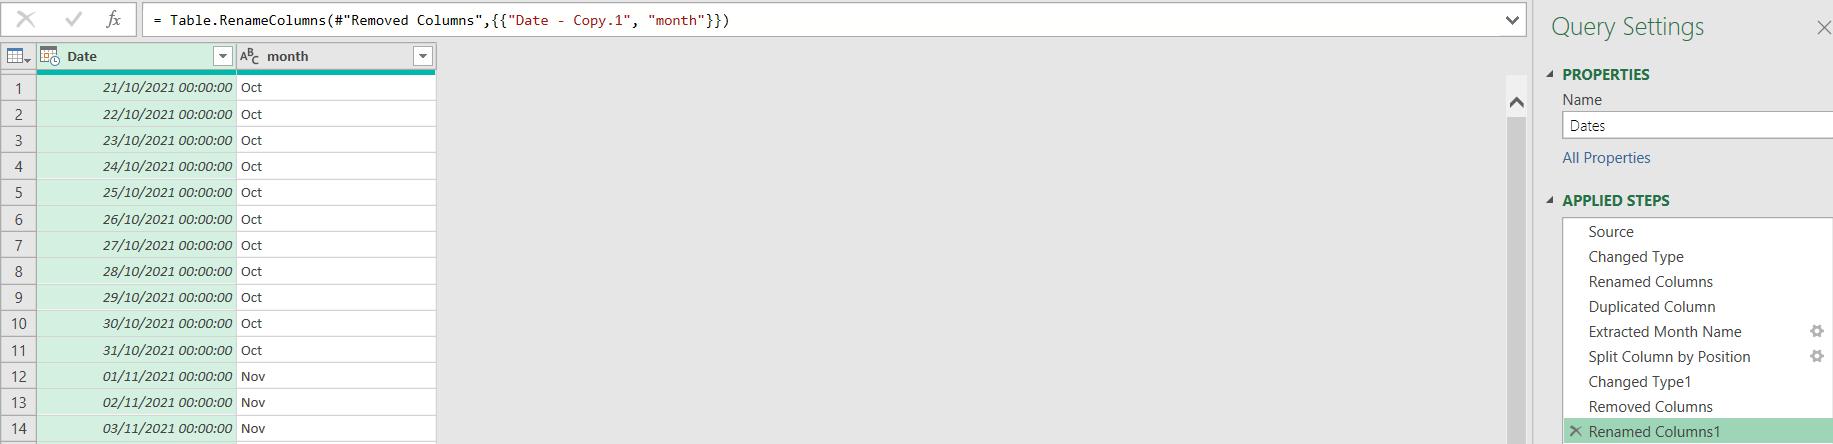
The first task was to create a Month Name column with a short month name. This takes up six [6] steps. First, I duplicate the Date Column, creating a ‘Duplicated Column’ step:
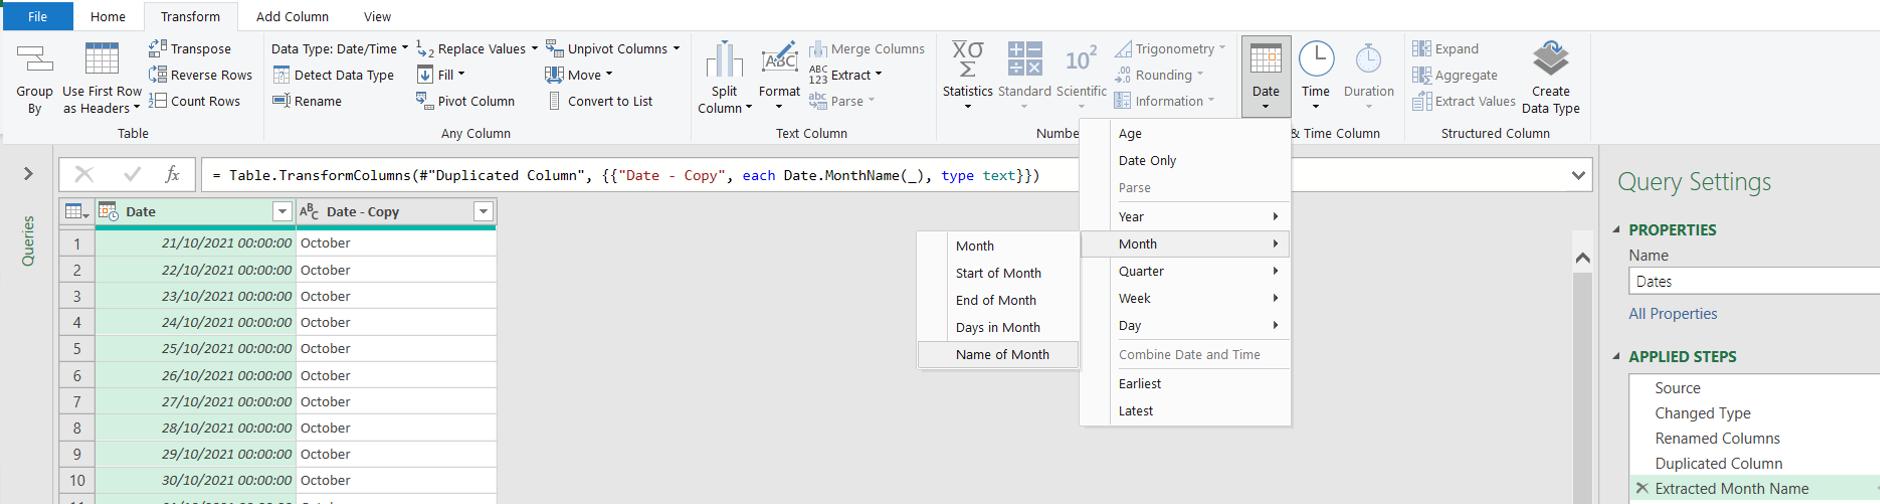
Then I use the Date transformation on the Transform tab to convert the new column to hold the ‘Name of Month’, creating an ‘Extracted Month Name’ step.
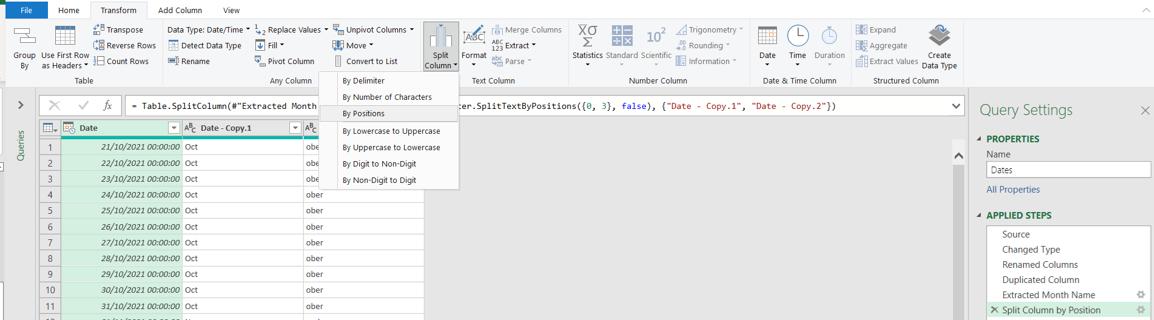
Next, I used ‘Split Column’ on the Transform tab to split the column ‘By Positions’, creating a ‘Split Column by Position’ step:
This automatically generated a ‘Changed Type1’ step. I then had to delete the unwanted column, creating a ‘Removed Column’ step and rename the one I wanted to keep to ‘month’, creating a ‘Renamed Column1’ step:
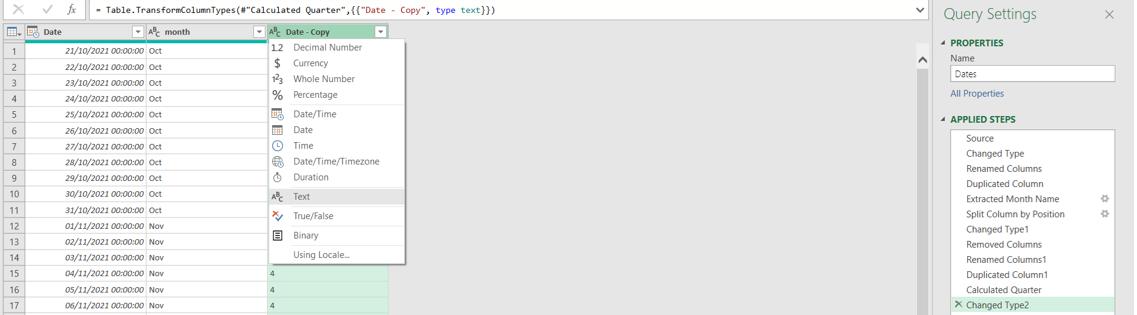
I then took another five [5] steps to create a ‘Quarter’ column. I duplicated the Date column again (Duplicated Column1) and used the Date transformation again, this time to get the Quarter, creating a ‘Calculated Quarter’ step.
I then decided I wanted to have a ‘Q’ in front of it, so I converted the column to data type text using the dropdown from the data type icon, creating a ‘Changed Type2’ step:
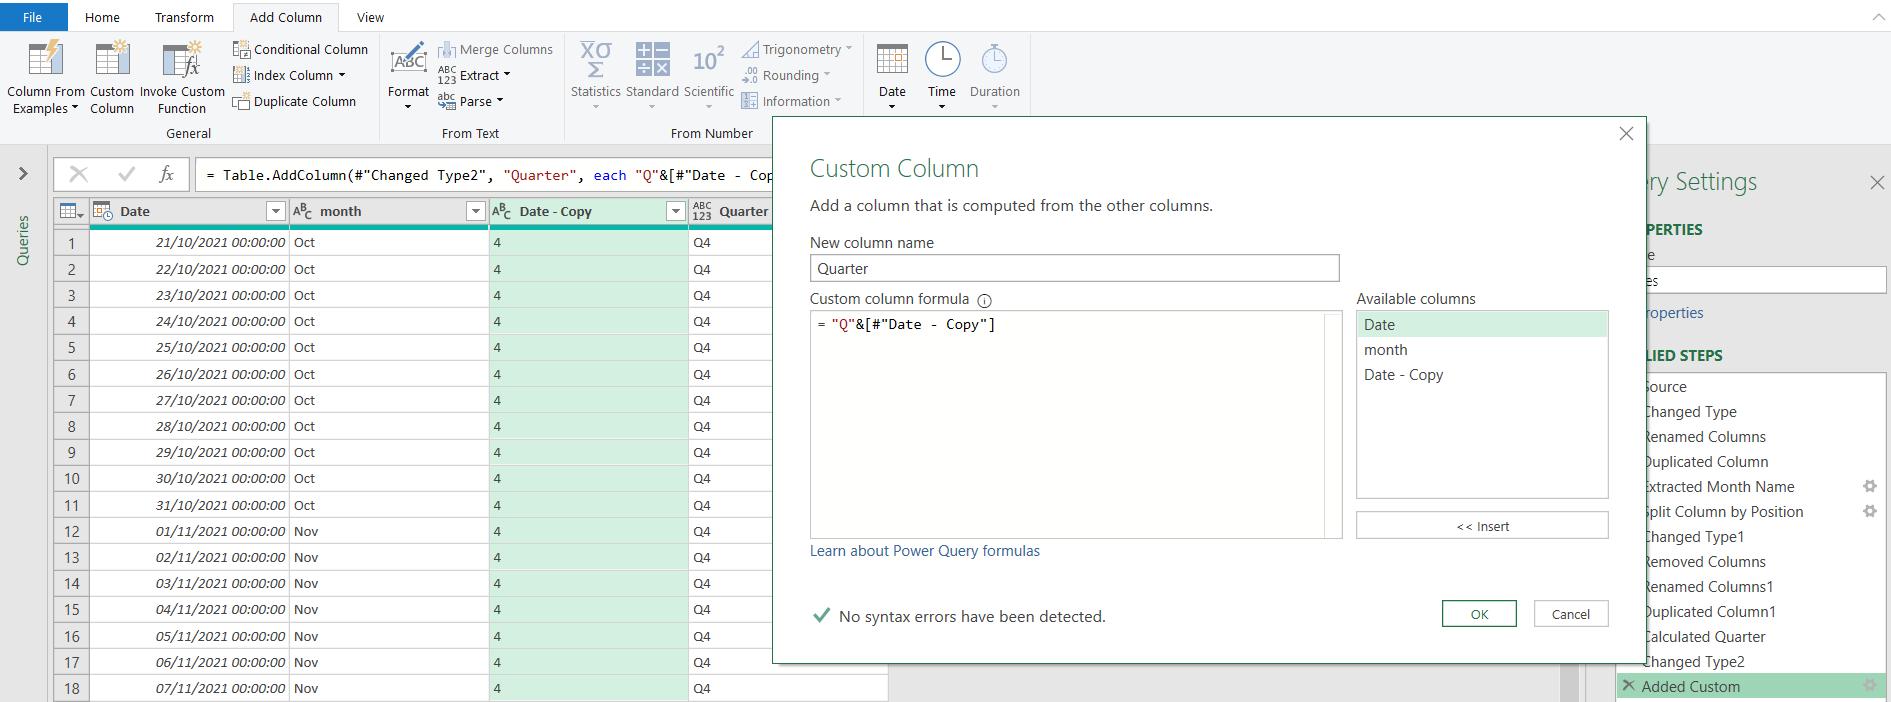
I then added a ‘Custom Column’ from the Home tab to add the ‘Q’ (‘Added Custom’):
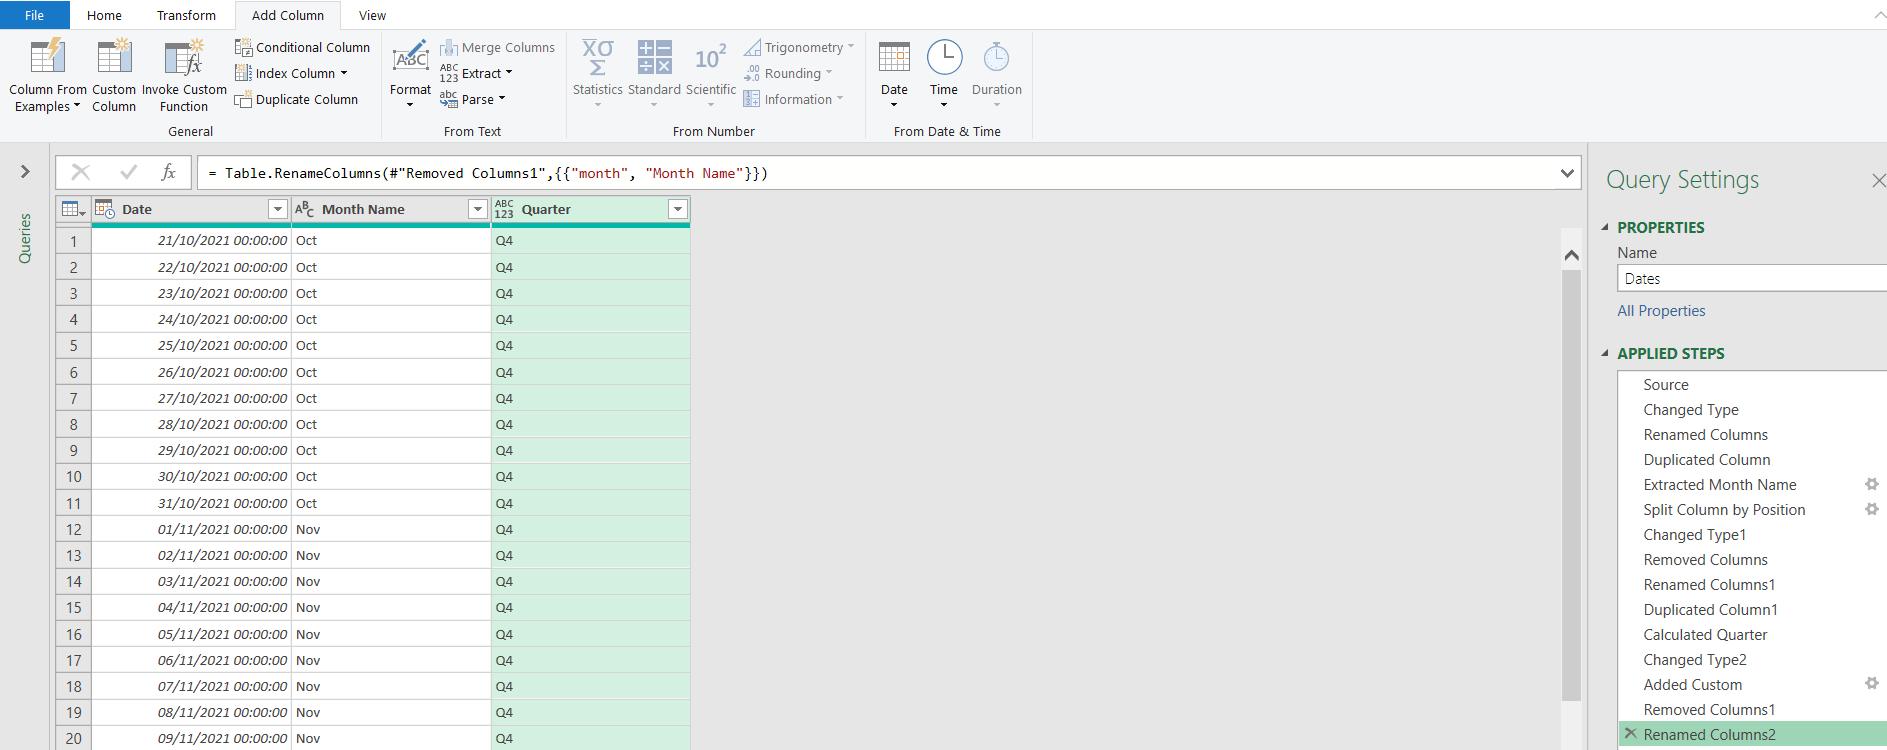
Then I deleted the Date – Copy column which held the original quarter value (‘Removed Column1’) and decided to rename the month column to ‘Month Name’ (‘Renamed Column2’).
Next time I’ll have a look at how this number of steps may be reduced whilst still using the User Interface (UI). How many steps do you think I will need?
Come back next time for more ways to use Power Query!