
Power Query: New Year Function
6 January 2021
Welcome to our Power Query blog. This week, I look at an example using custom functions.
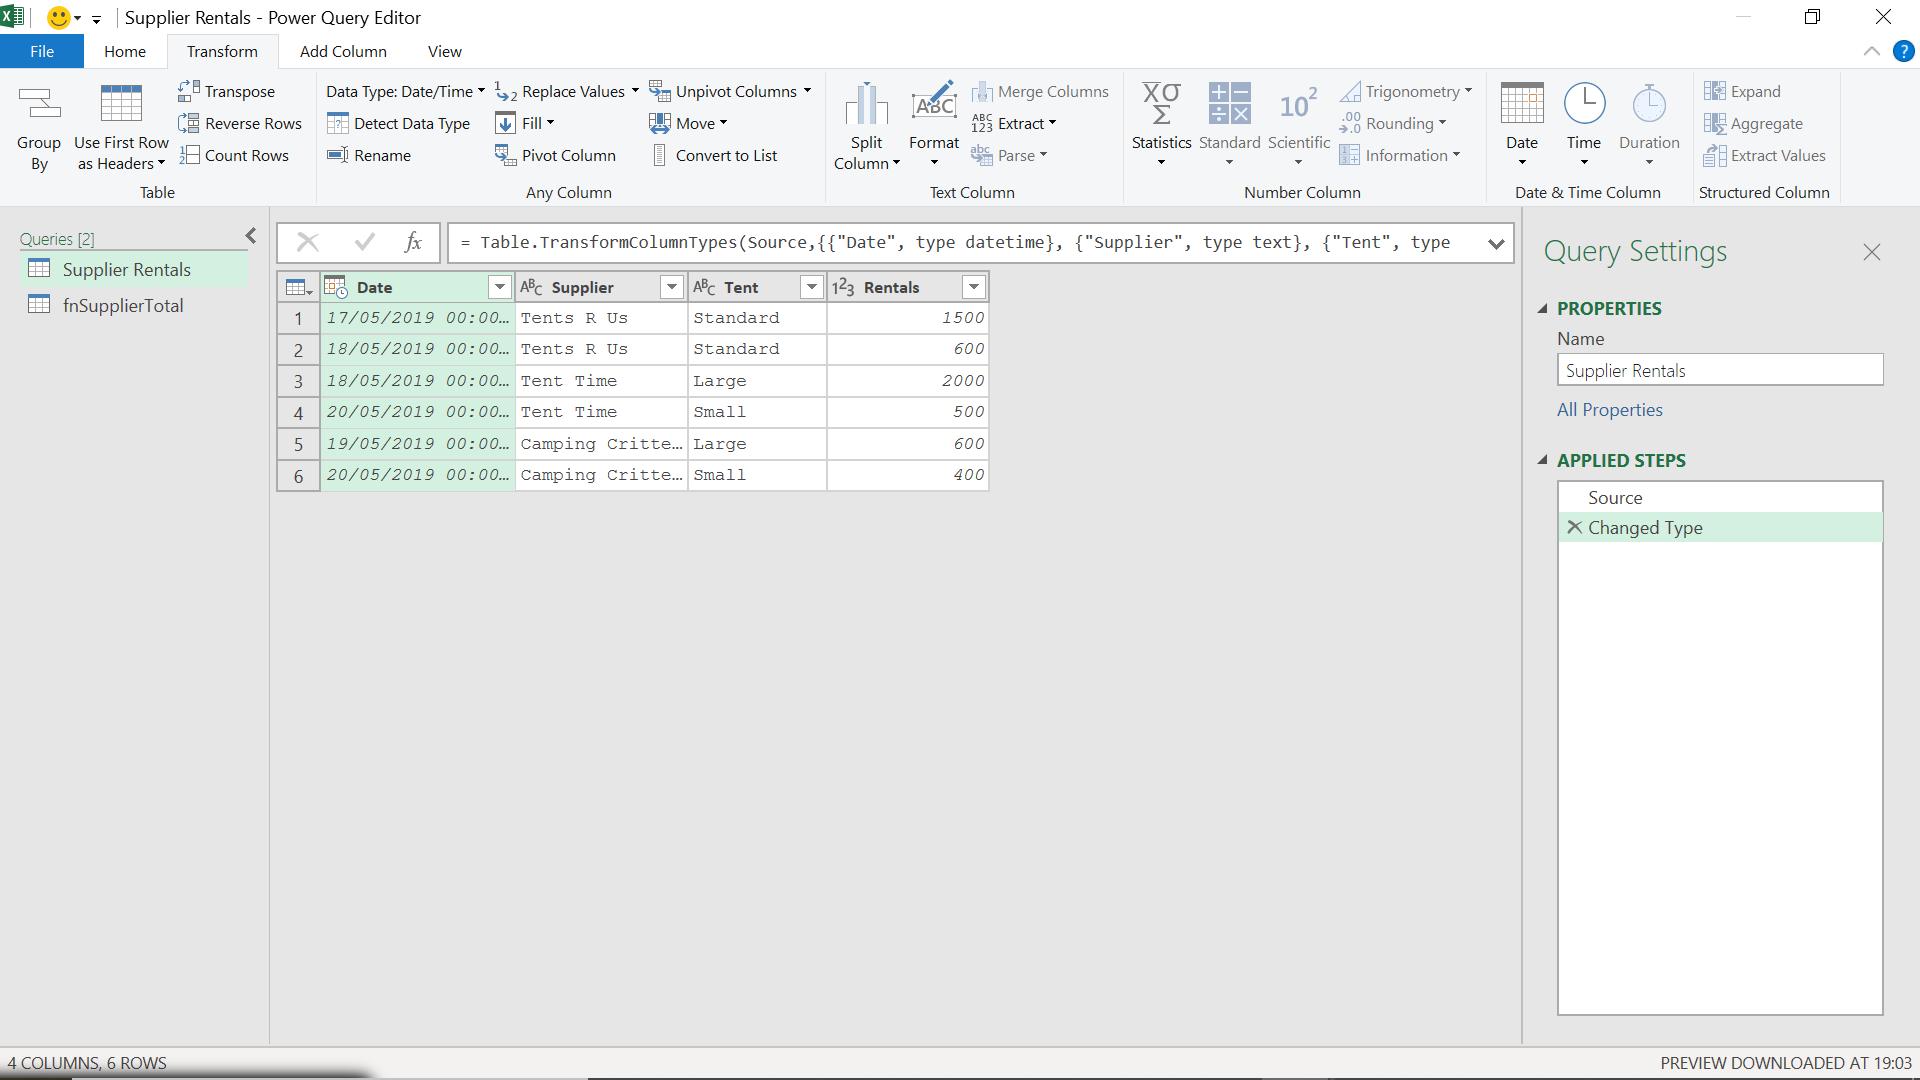
I have some supplier data:
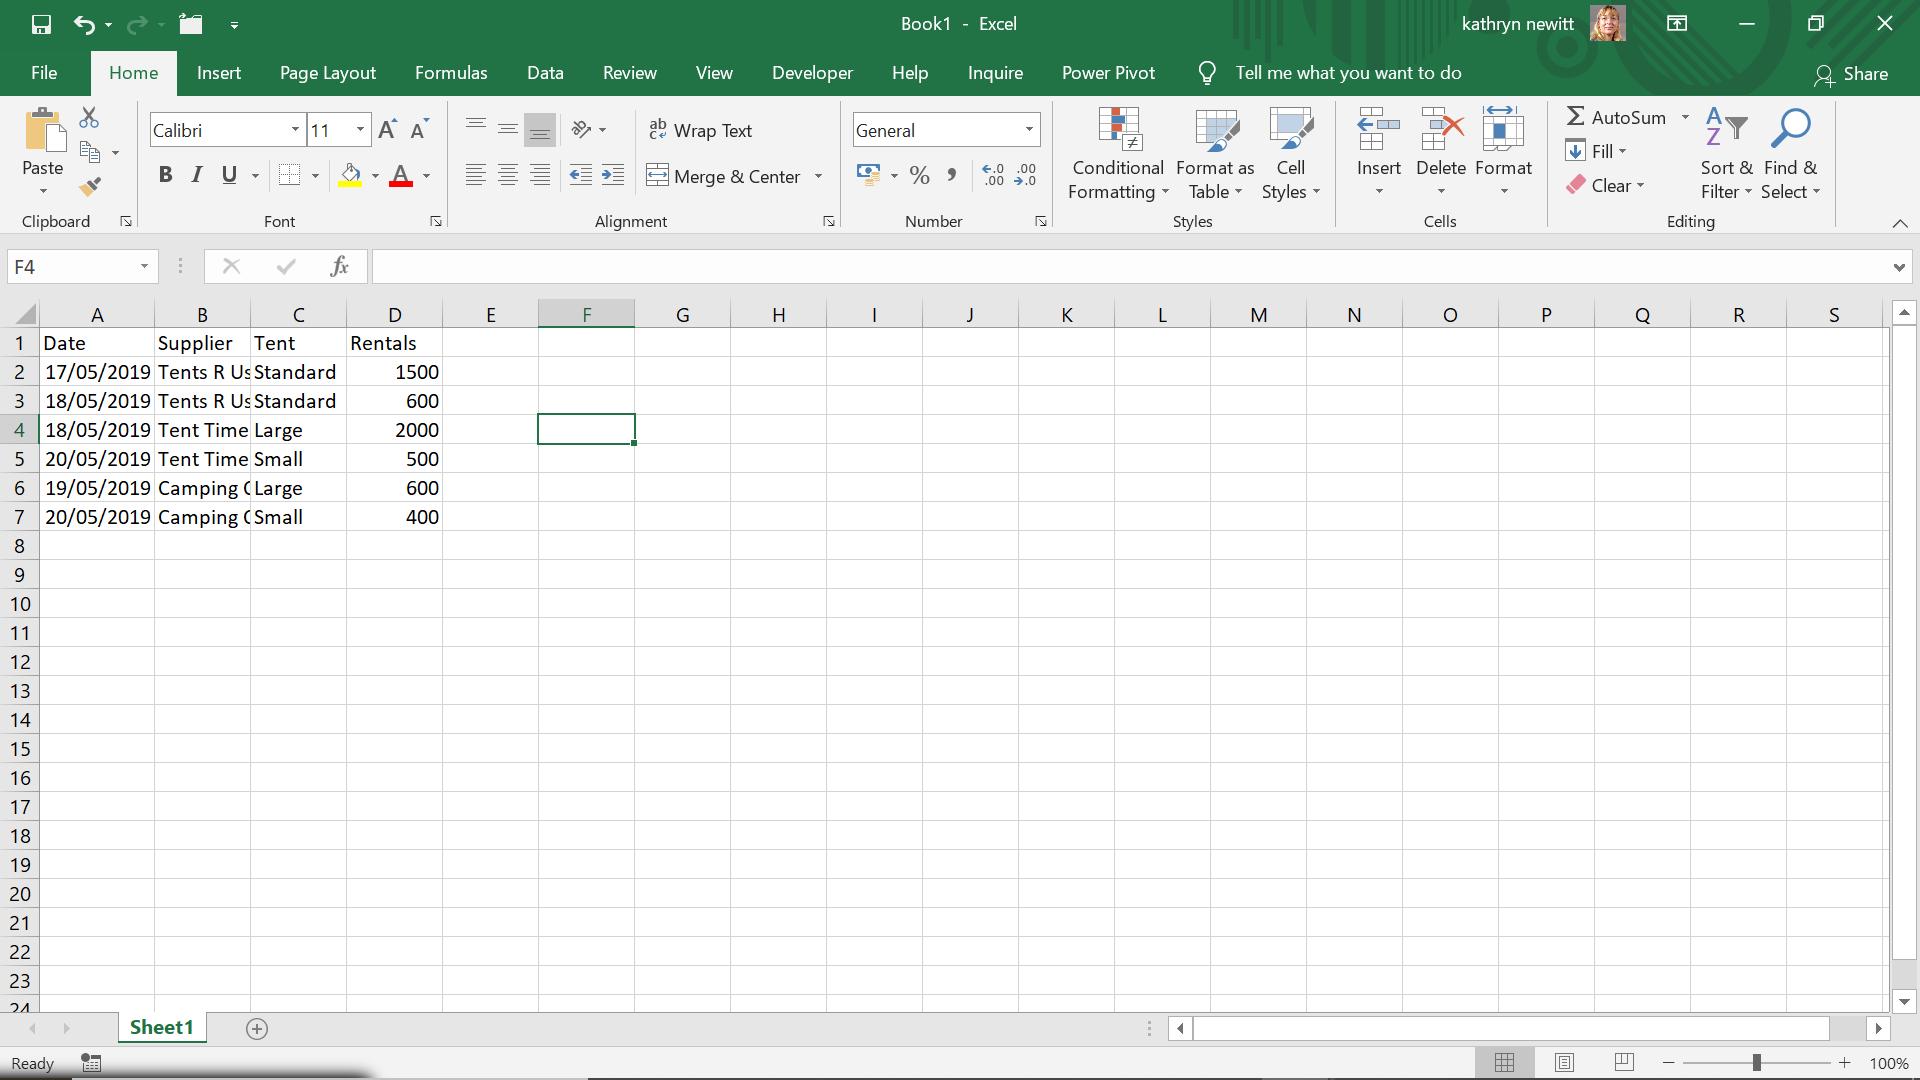
I intend to find out the percentage of the total sales of each tent per customer, and show it alongside the transactions. I start by extracting my data to Power Query using ‘From Table’ in the ‘Get & Transform’ section of the Data tab.
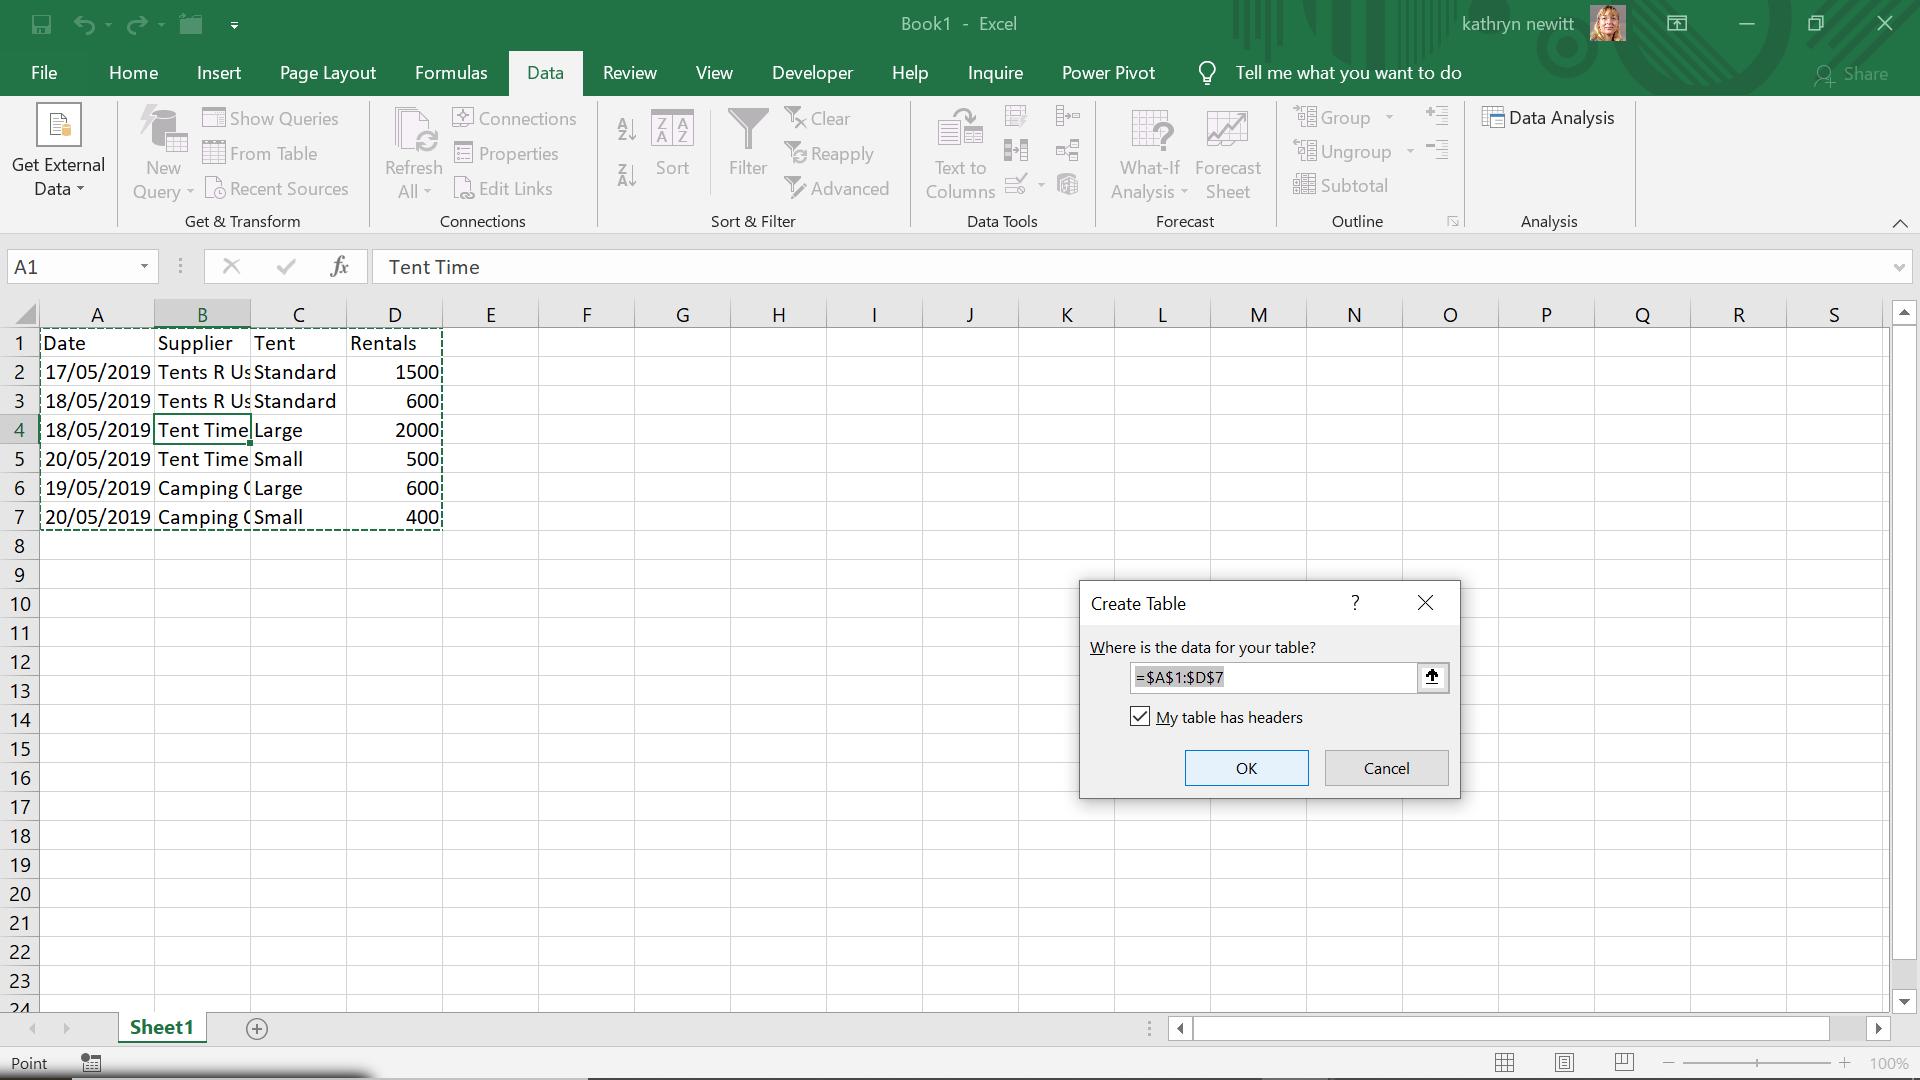
I accept the defaults.
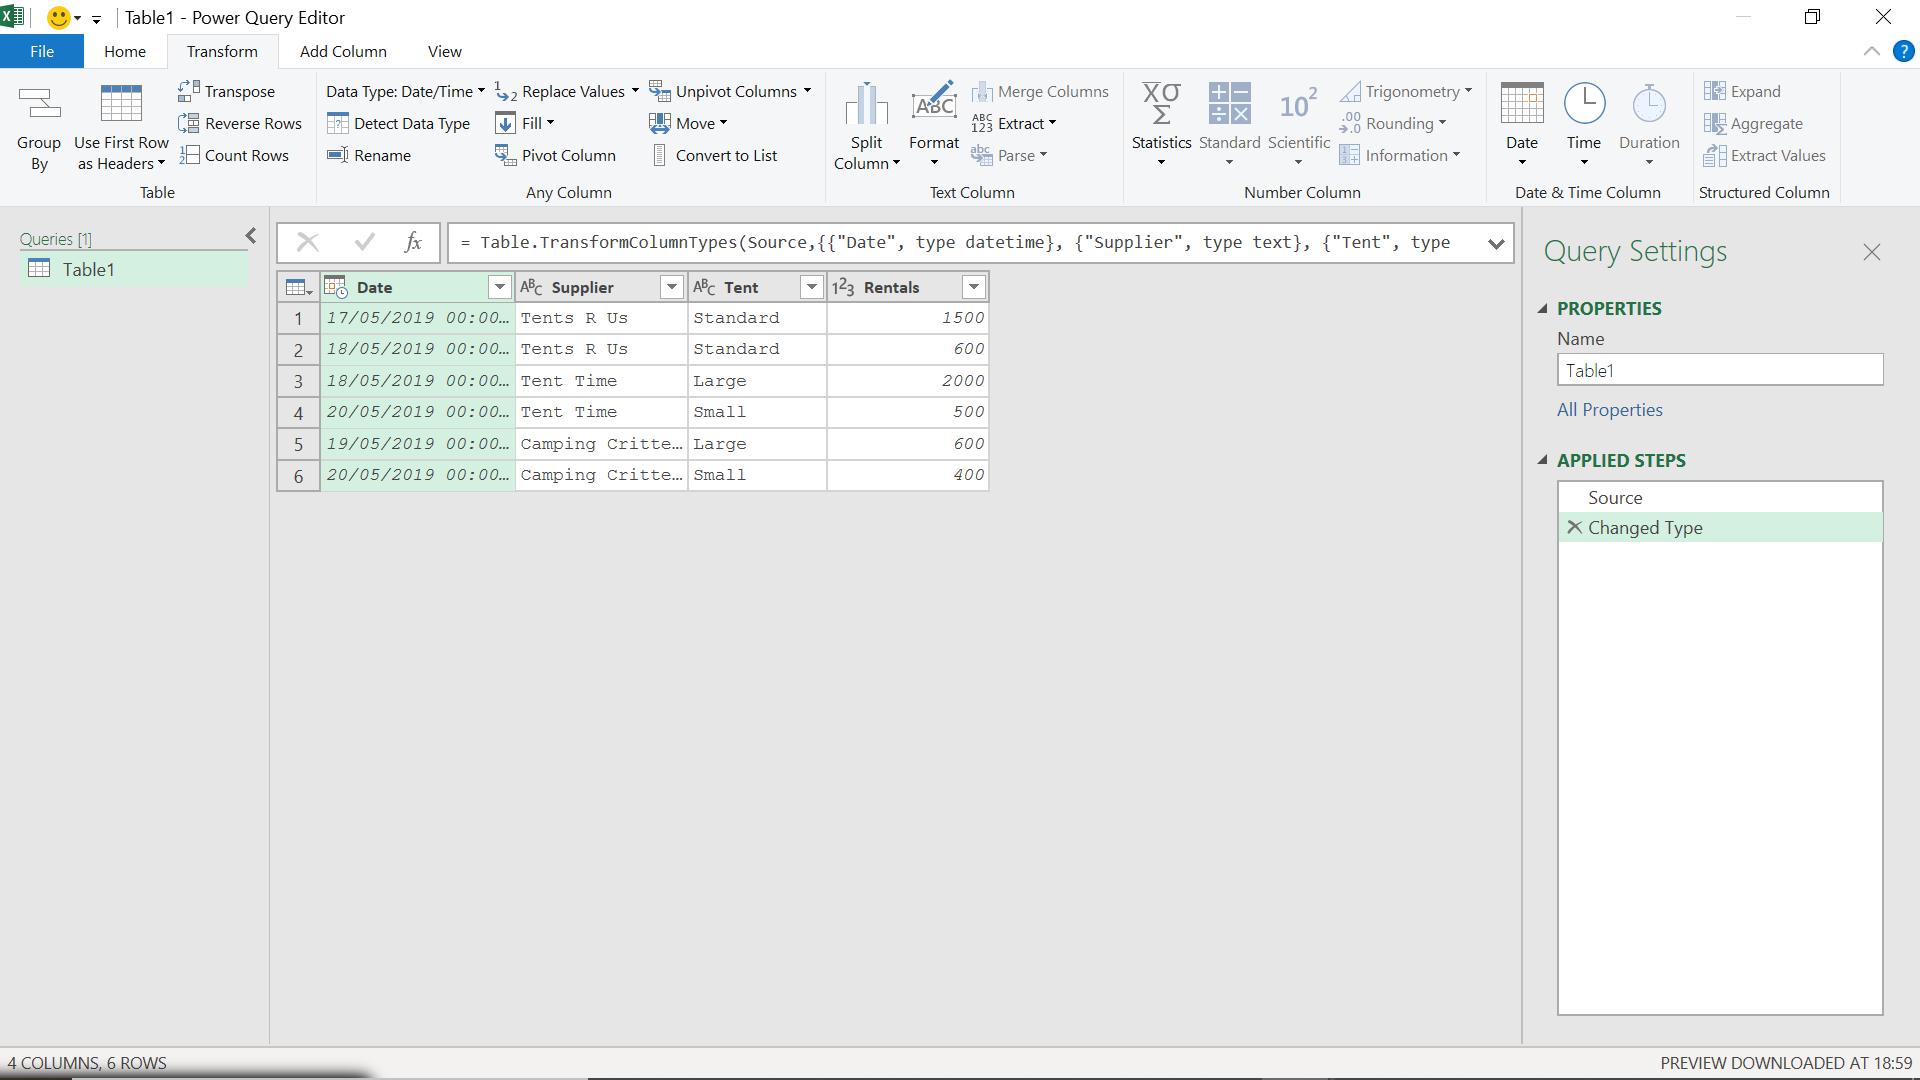
I will need two copies of this query, so I can right-click on my query in the Queries pane and choose Duplicate.
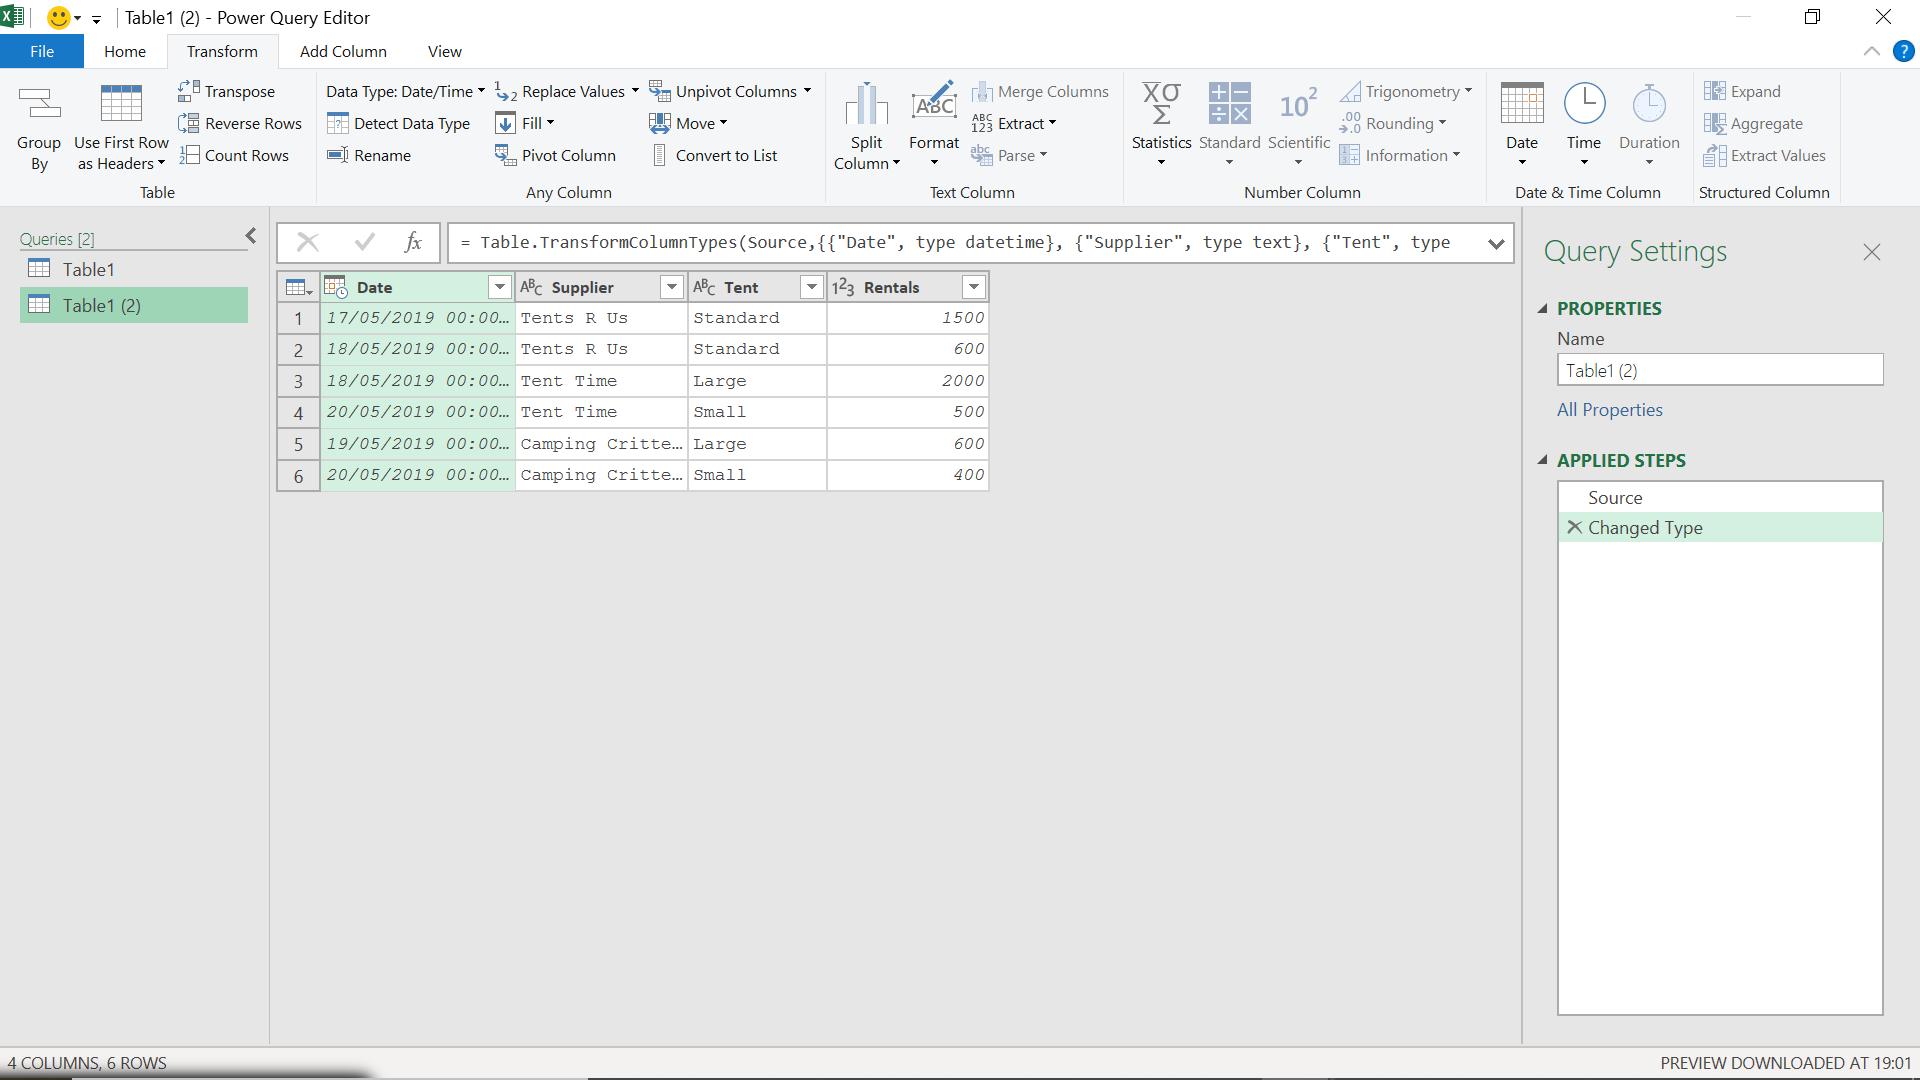
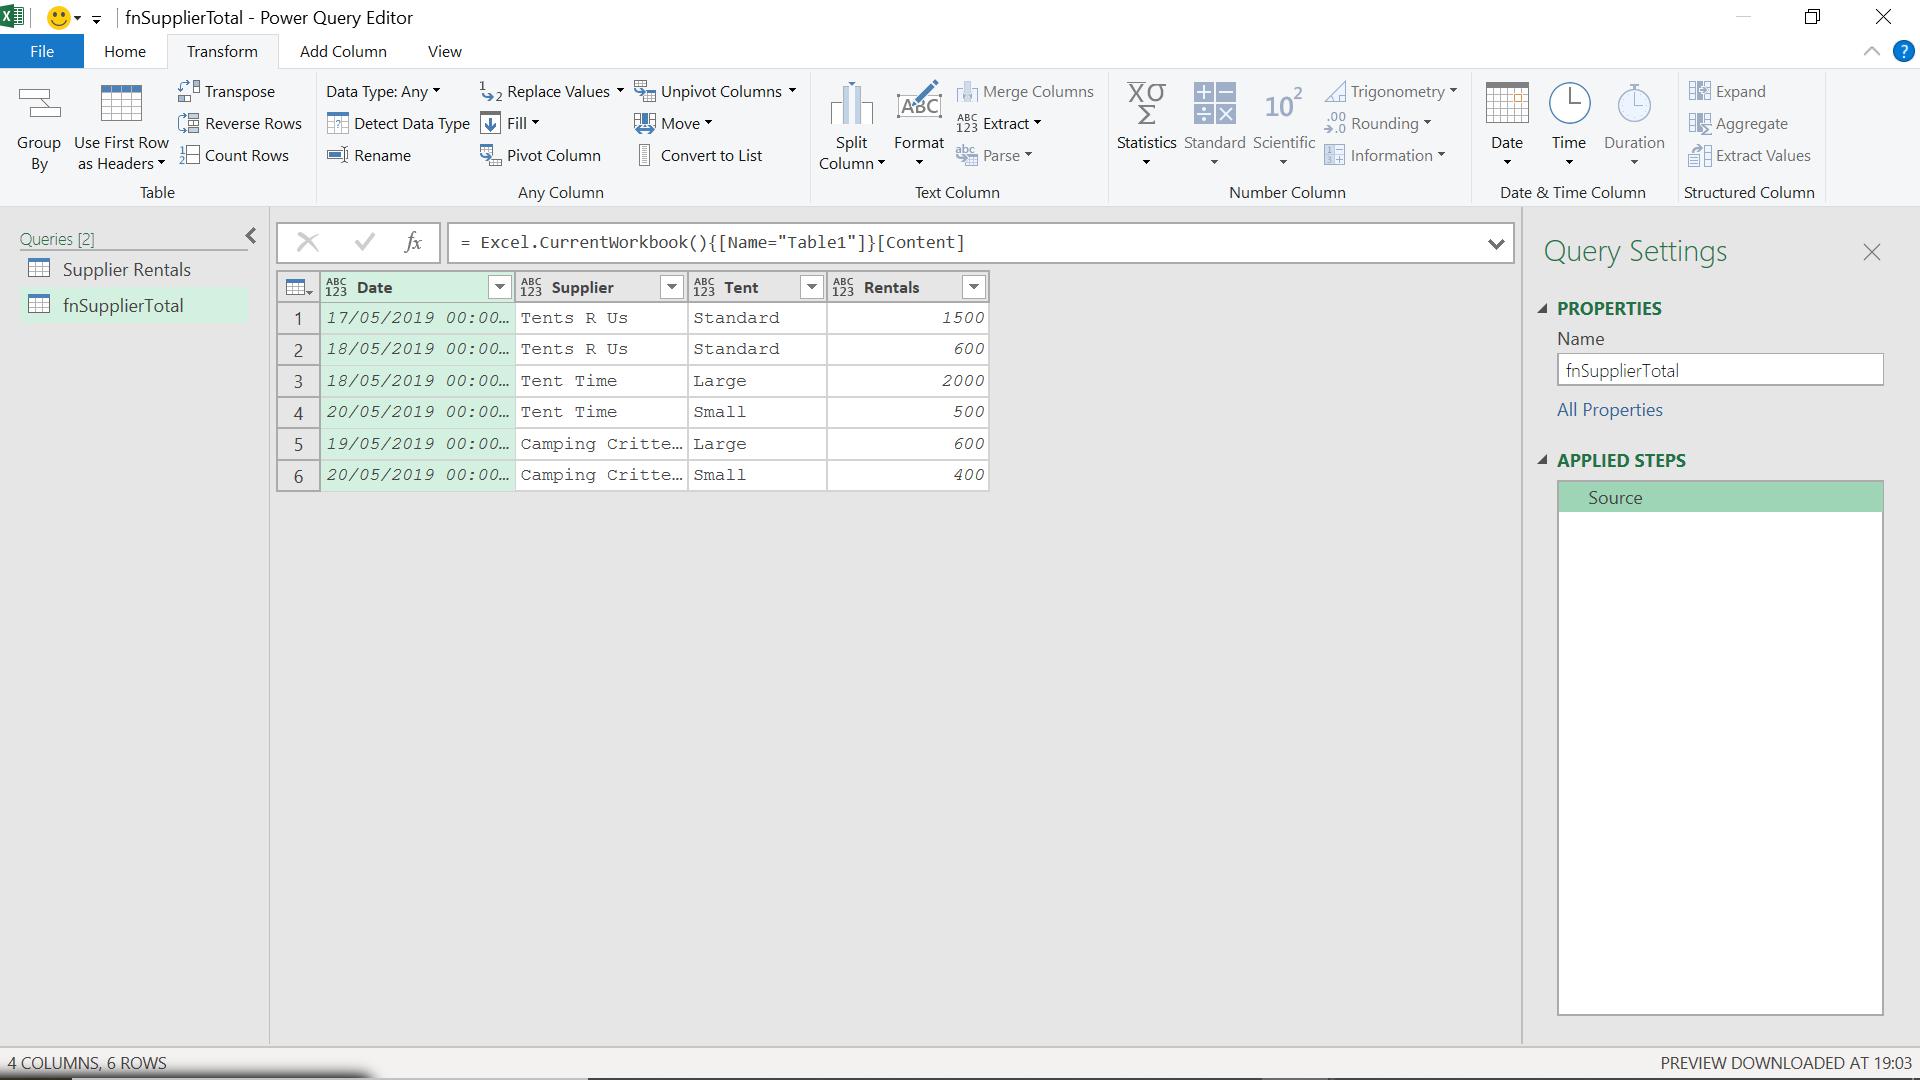
I can now rename my queries. One is going to be my ‘Supplier Rentals’ query and one is going to be a function which I will call fnSupplierTotal.
In fnSupplierTotals, I delete the ‘Changed Type’ step.
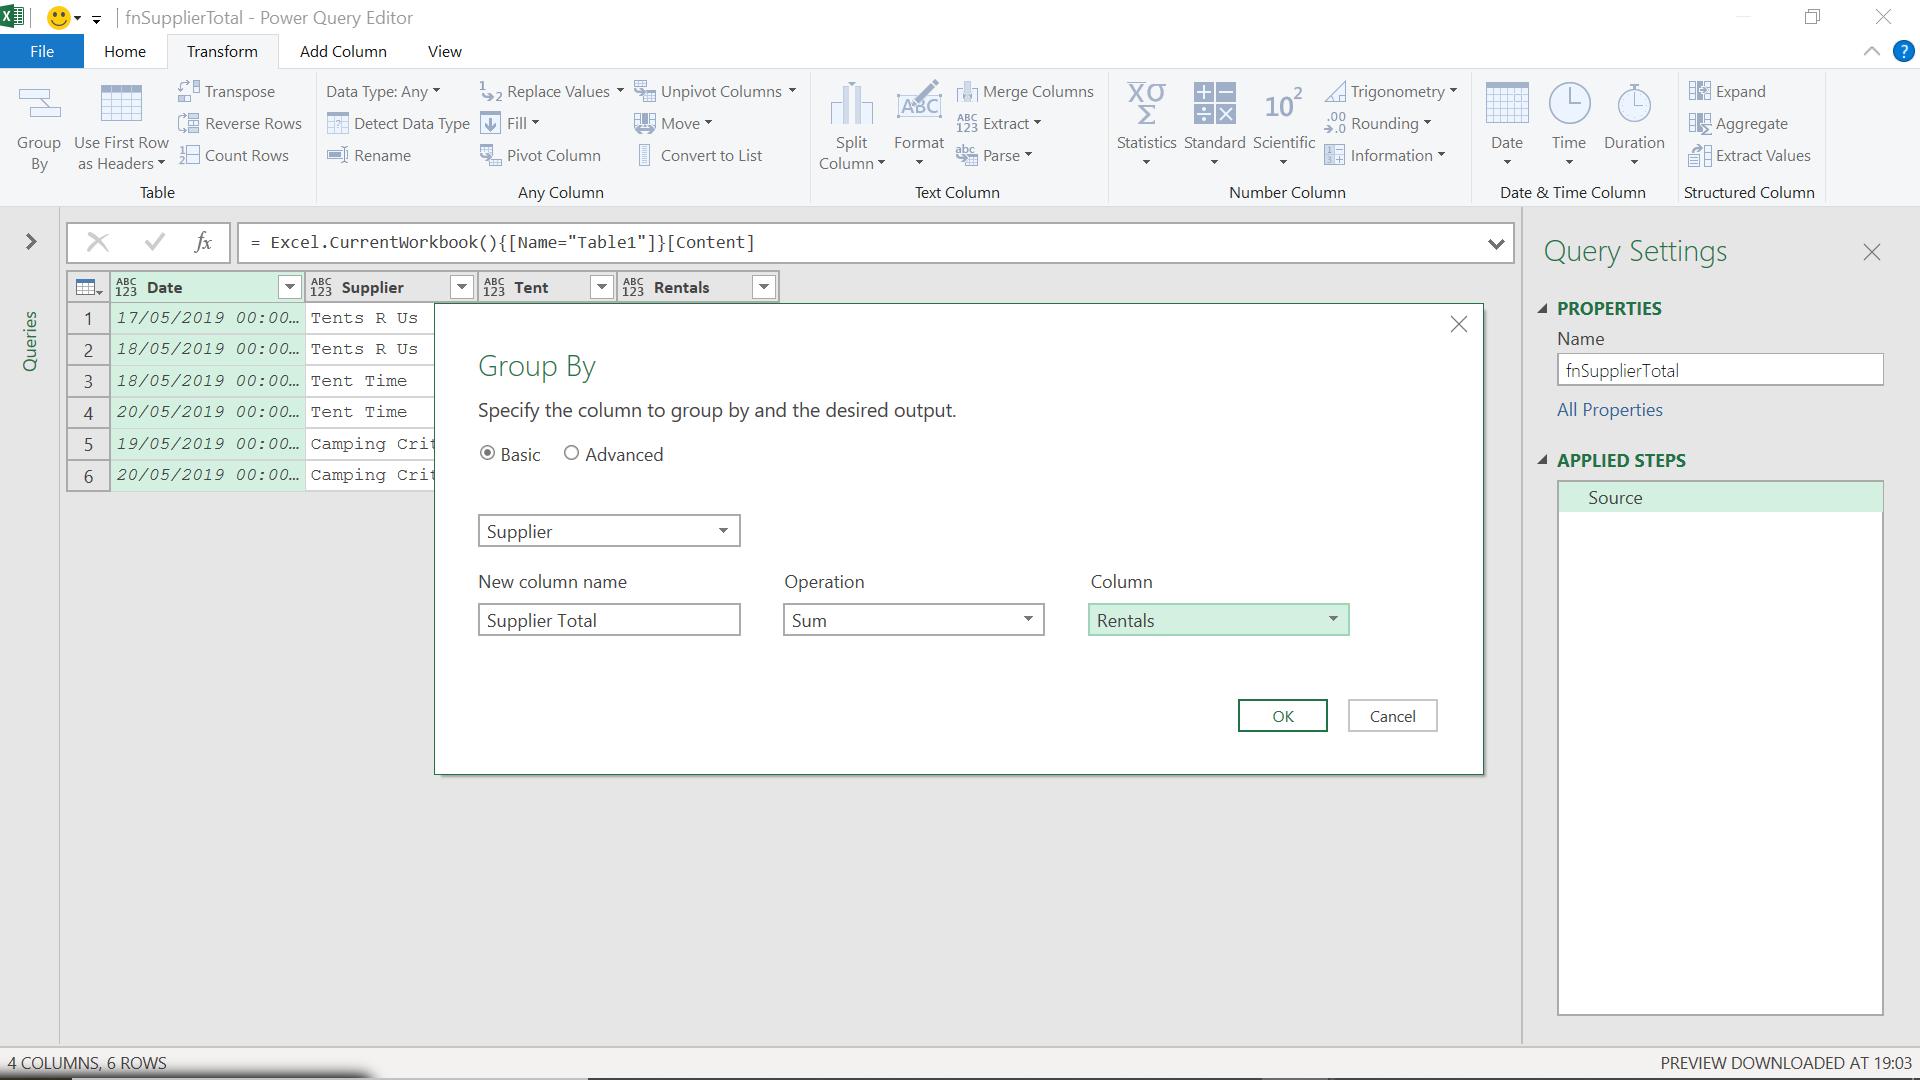
In the Transform tab, I choose ‘Group By’.
I filter on Supplier and choose just ‘Tents R Us’ (any supplier would do; I just need the syntax).
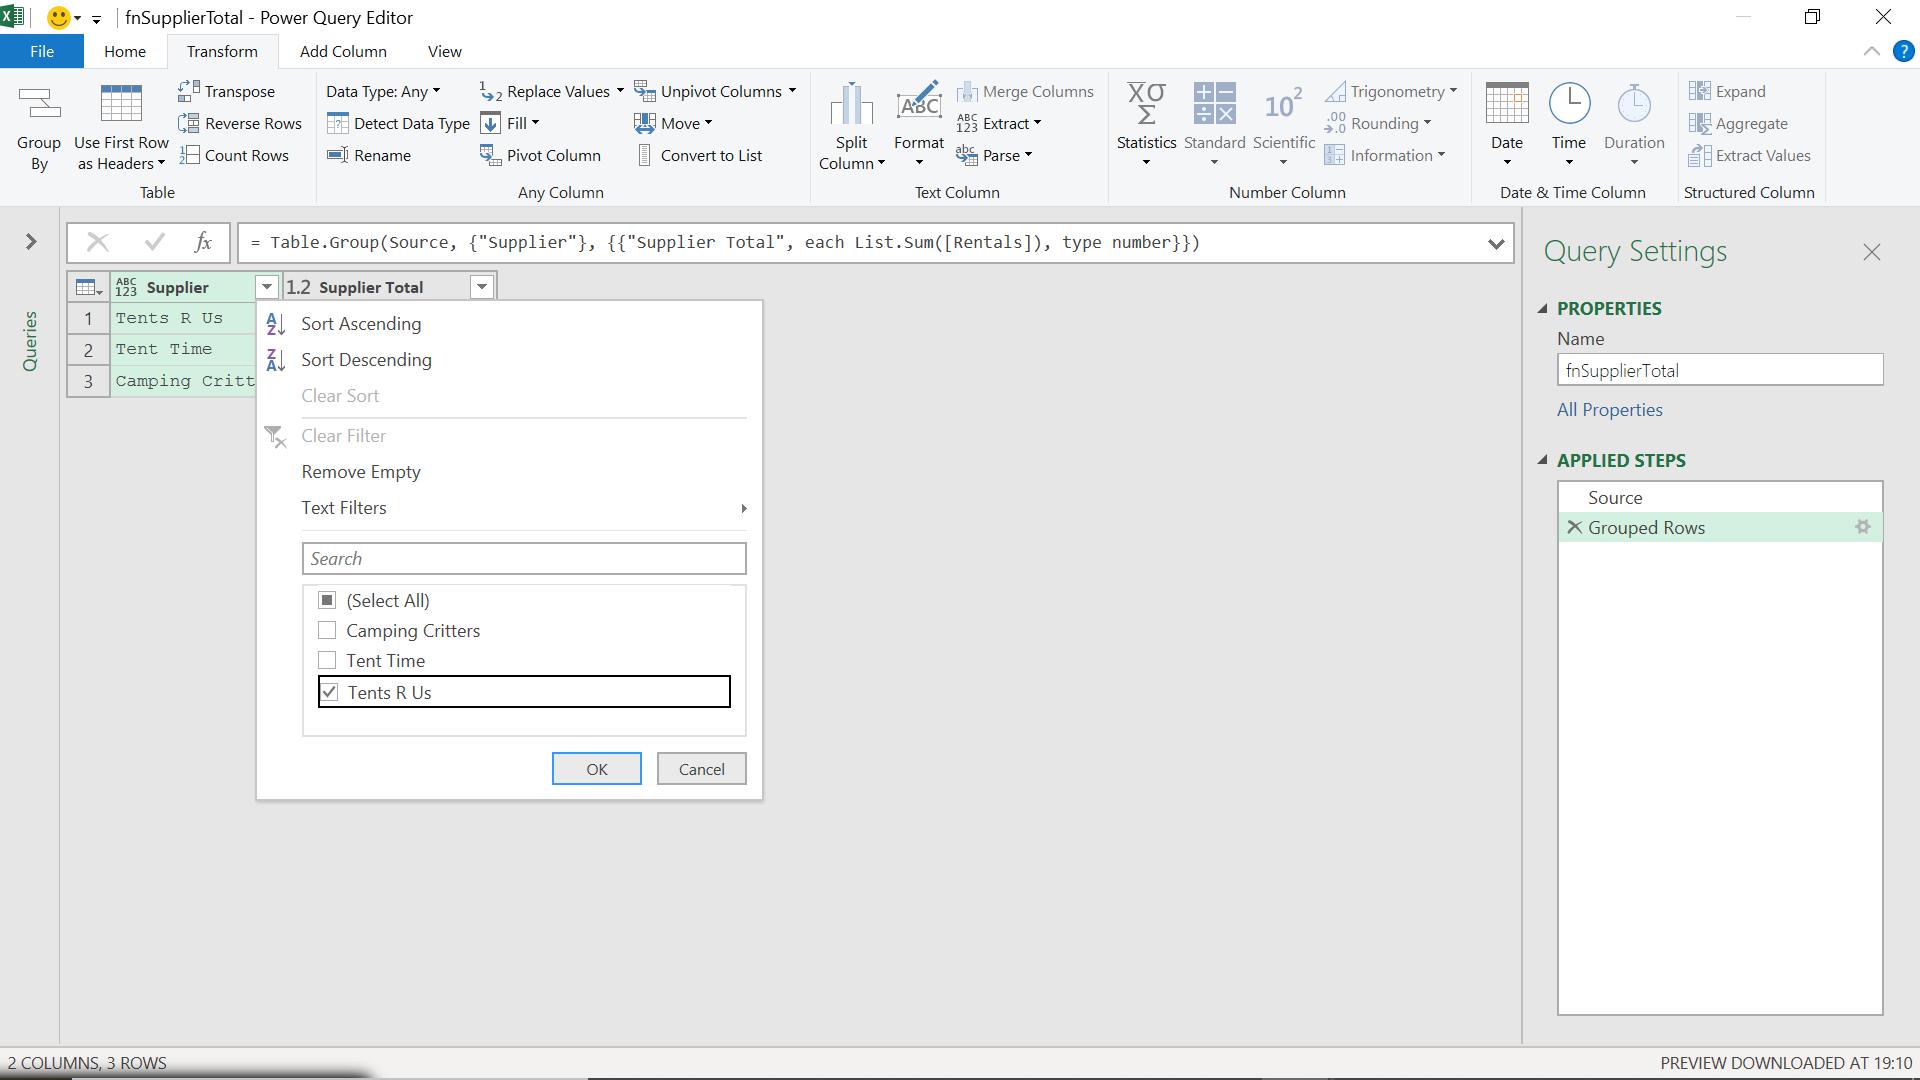
I can now apply this to get my query.
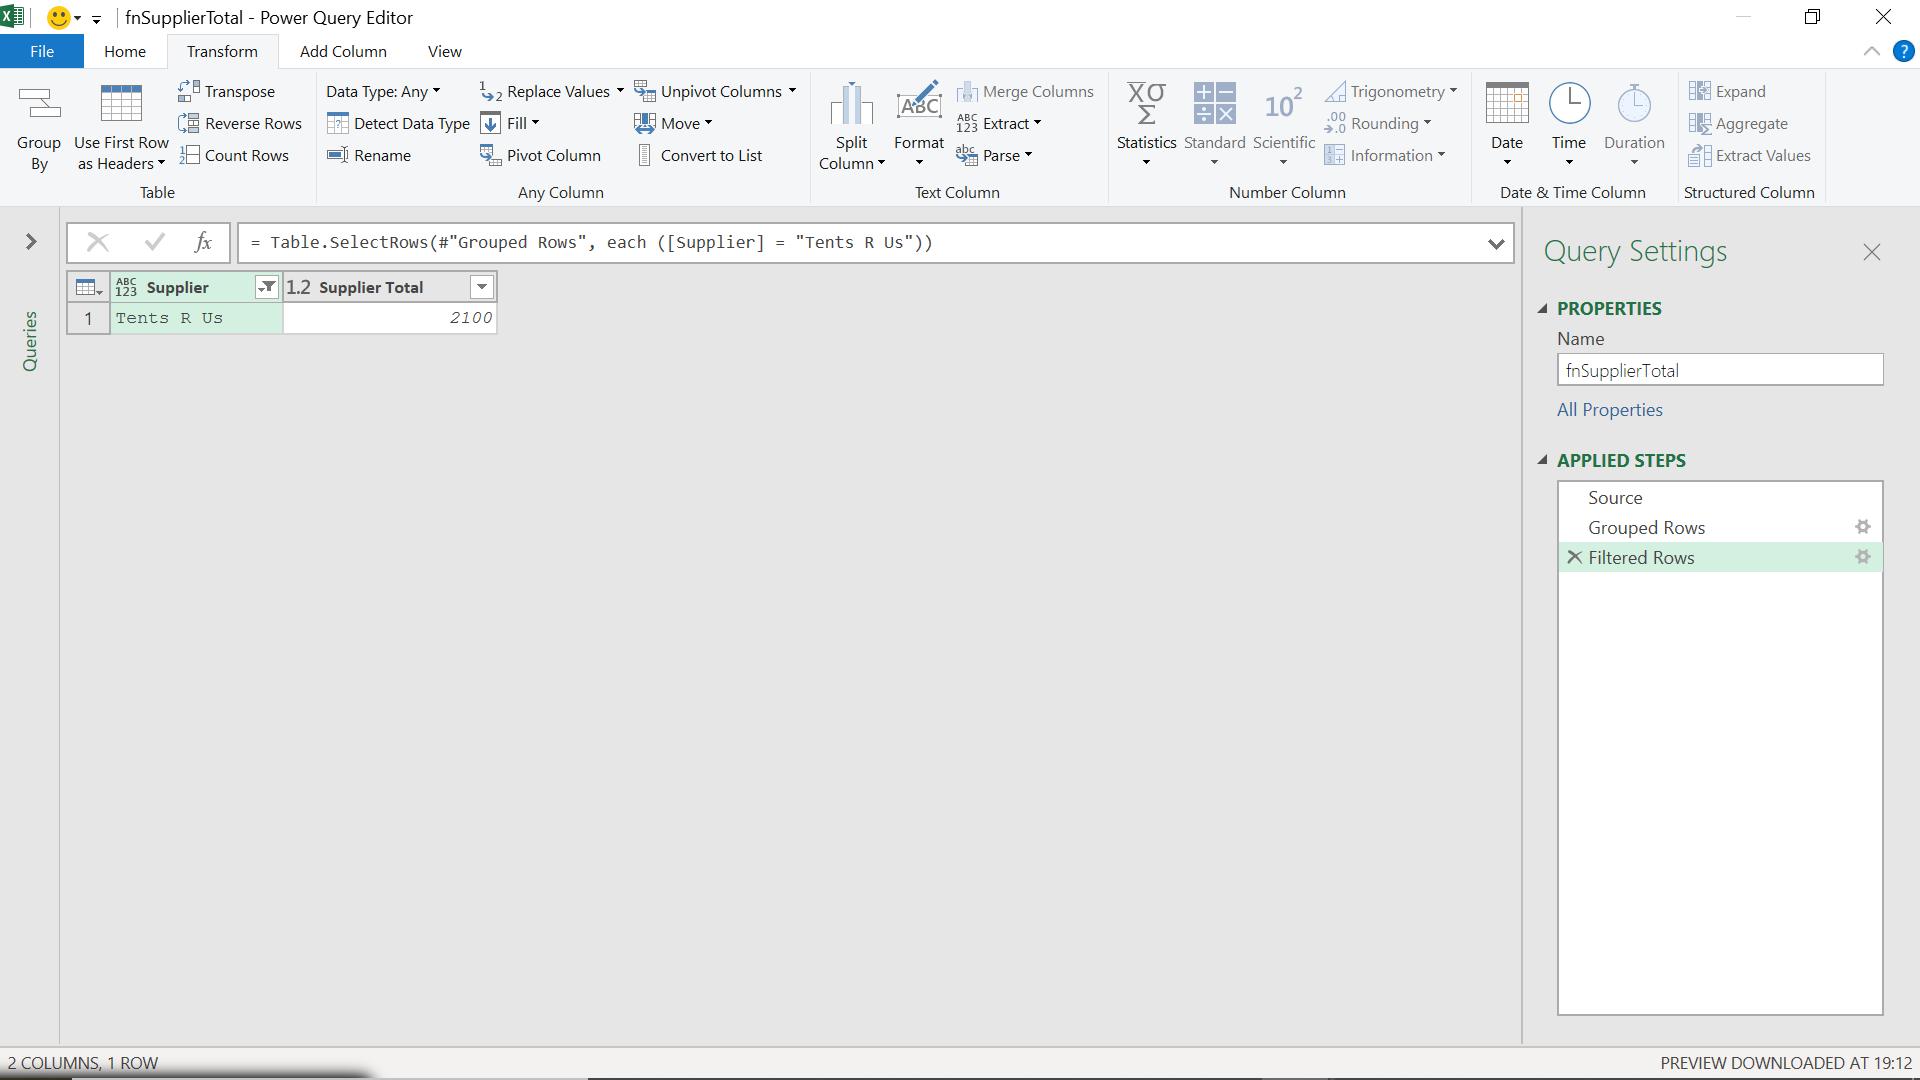
In the Advanced Editor, which I accessed from the Home tab, I can see the current M code:
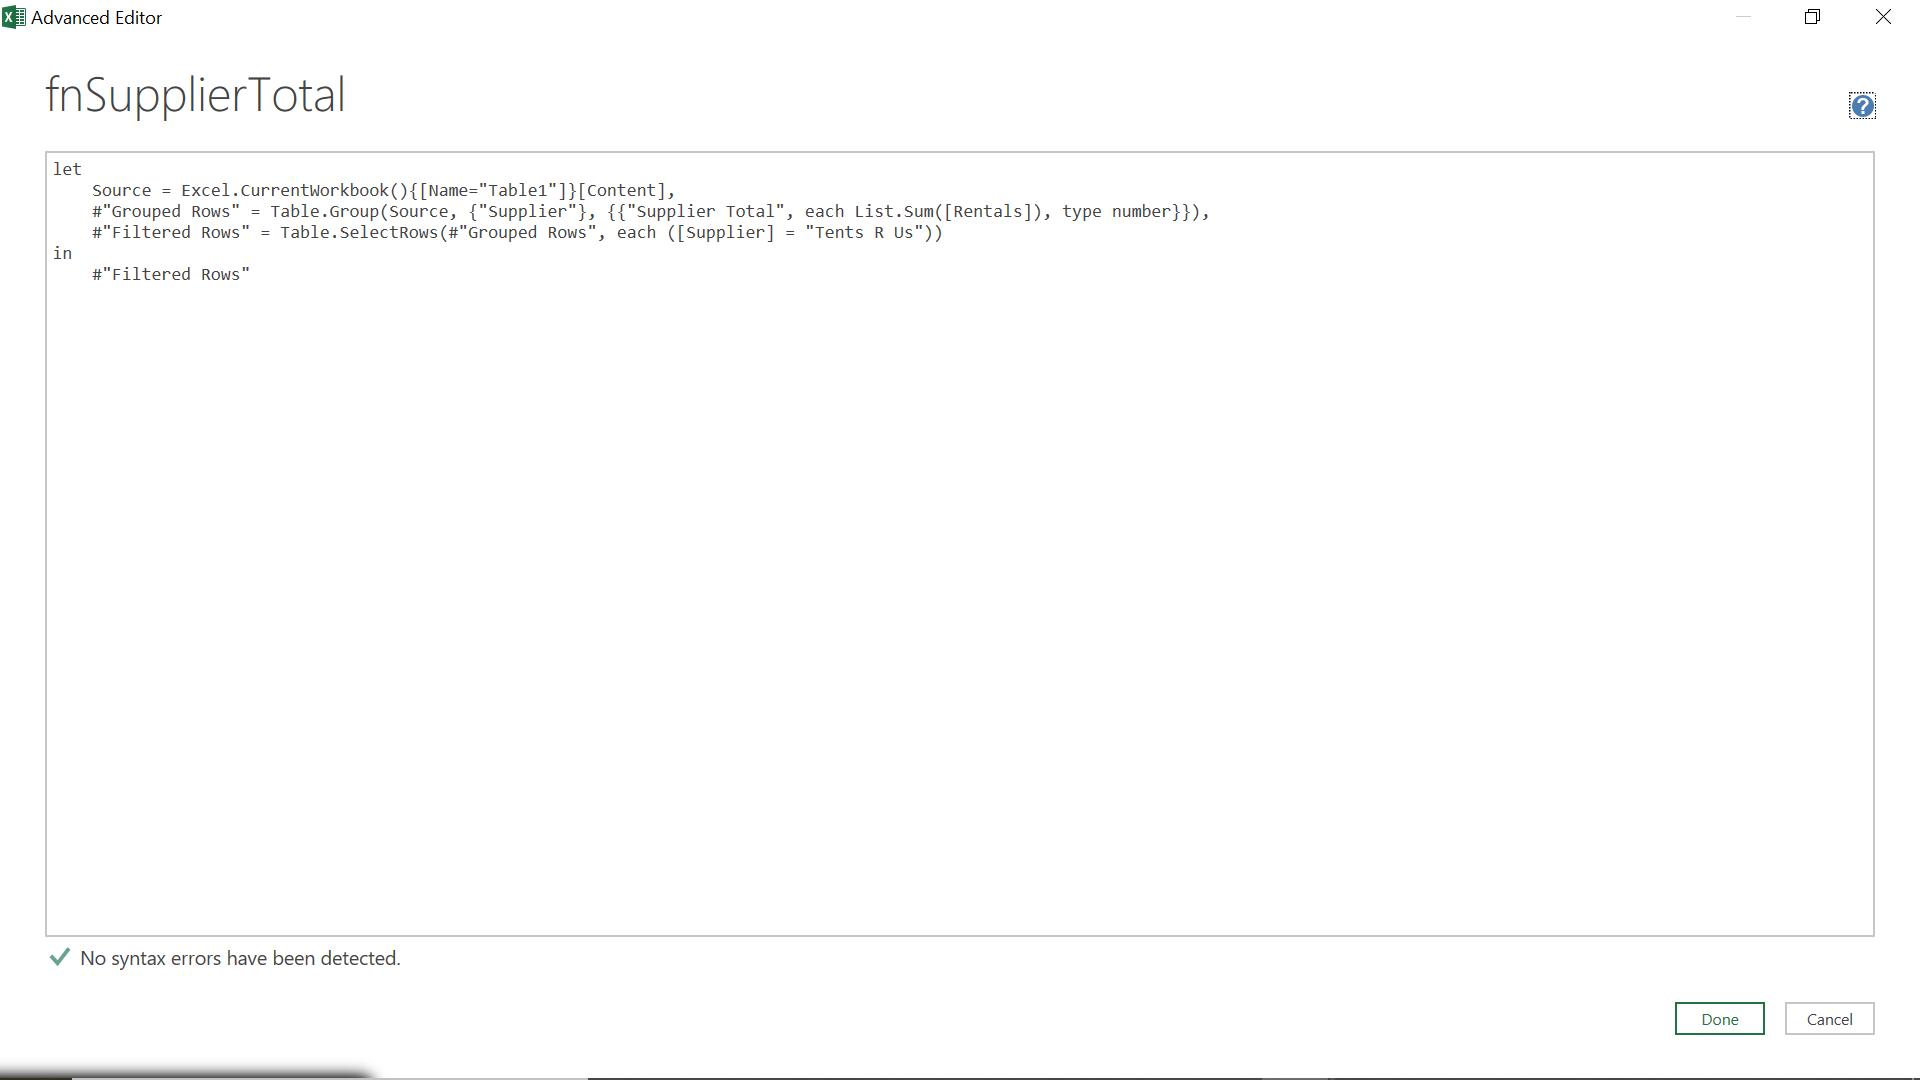
The M code is:
let
Source = Excel.CurrentWorkbook(){[Name="Table1"]}[Content],
#"Grouped Rows" = Table.Group(Source, {"Supplier"}, {{"Supplier Total", each List.Sum([Rentals]), type number}}),
#"Filtered Rows" = Table.SelectRows(#"Grouped Rows", each ([Supplier] = "Tents R Us"))
in
#"Filtered Rows"
Since this is now going to be a function, I start with a line defining my parameters.
(sourceTable as table, supplierName as text) =>
Since I am passing in the source, I don’t need the source line, so I can delete it.
That means the #"Grouped Rows" step that referred to ‘Source’ must now use sourceTable instead. I also need to change ‘Tents R Us’ to my supplier parameter.
I can also tweak the code to return a value instead of a table with the value in by adding a step:
#"SupplierTotal" = Record.Field(#"Filtered Rows"{0},"Supplier Total")
(Record.Field is a Power Query function which returns single value from a column.)
My M code is now:
(sourceTable as table, supplierName as text)=>
let
#"Grouped Rows" = Table.Group(sourceTable, {"Supplier"}, {{"Supplier Total", each List.Sum([Rentals]), type number}}),
#"Filtered Rows" = Table.SelectRows(#"Grouped Rows", each ([Supplier] = supplierName)),
#"SupplierTotal" = Record.Field(#"Filtered Rows"{0},"Supplier Total")
in
#"SupplierTotal"
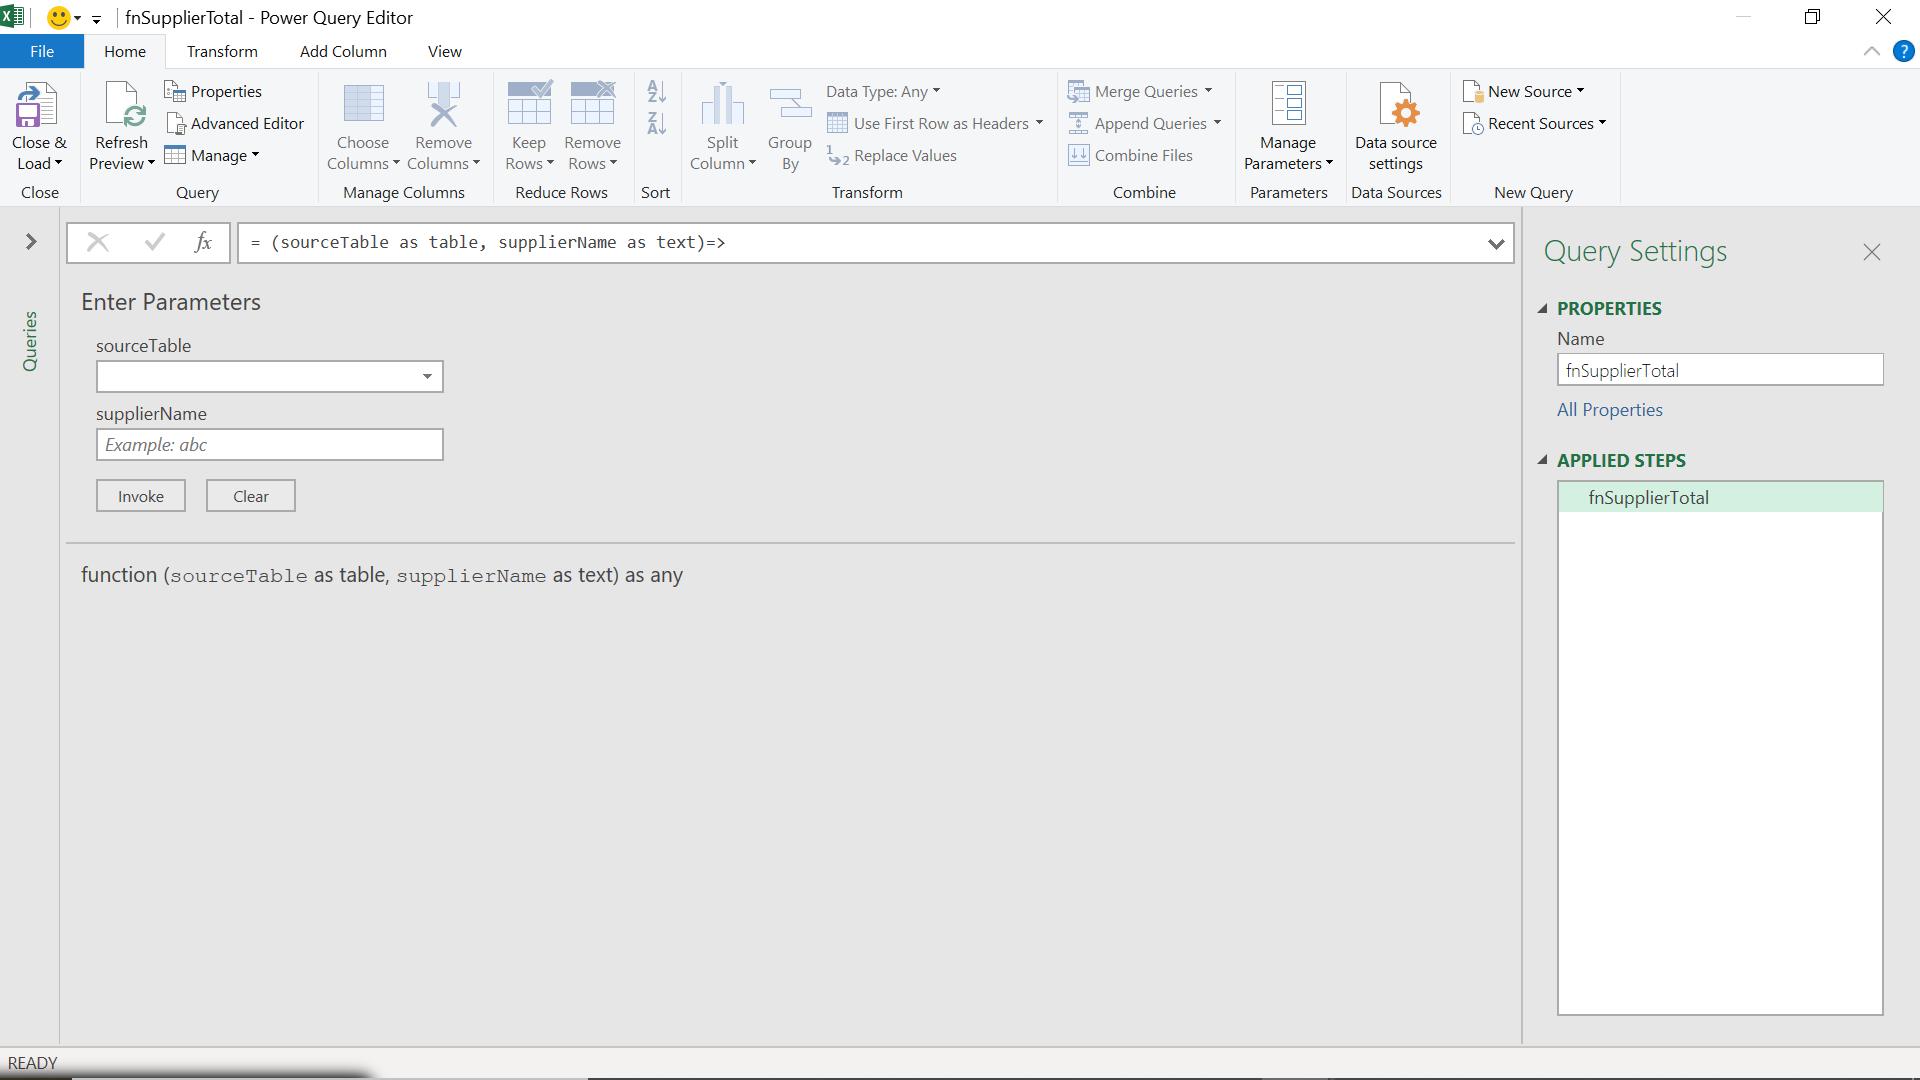
My function is ready to use. I can test it by pointing at my ‘Supplier Rentals’ query and choosing ‘Tents R Us’.
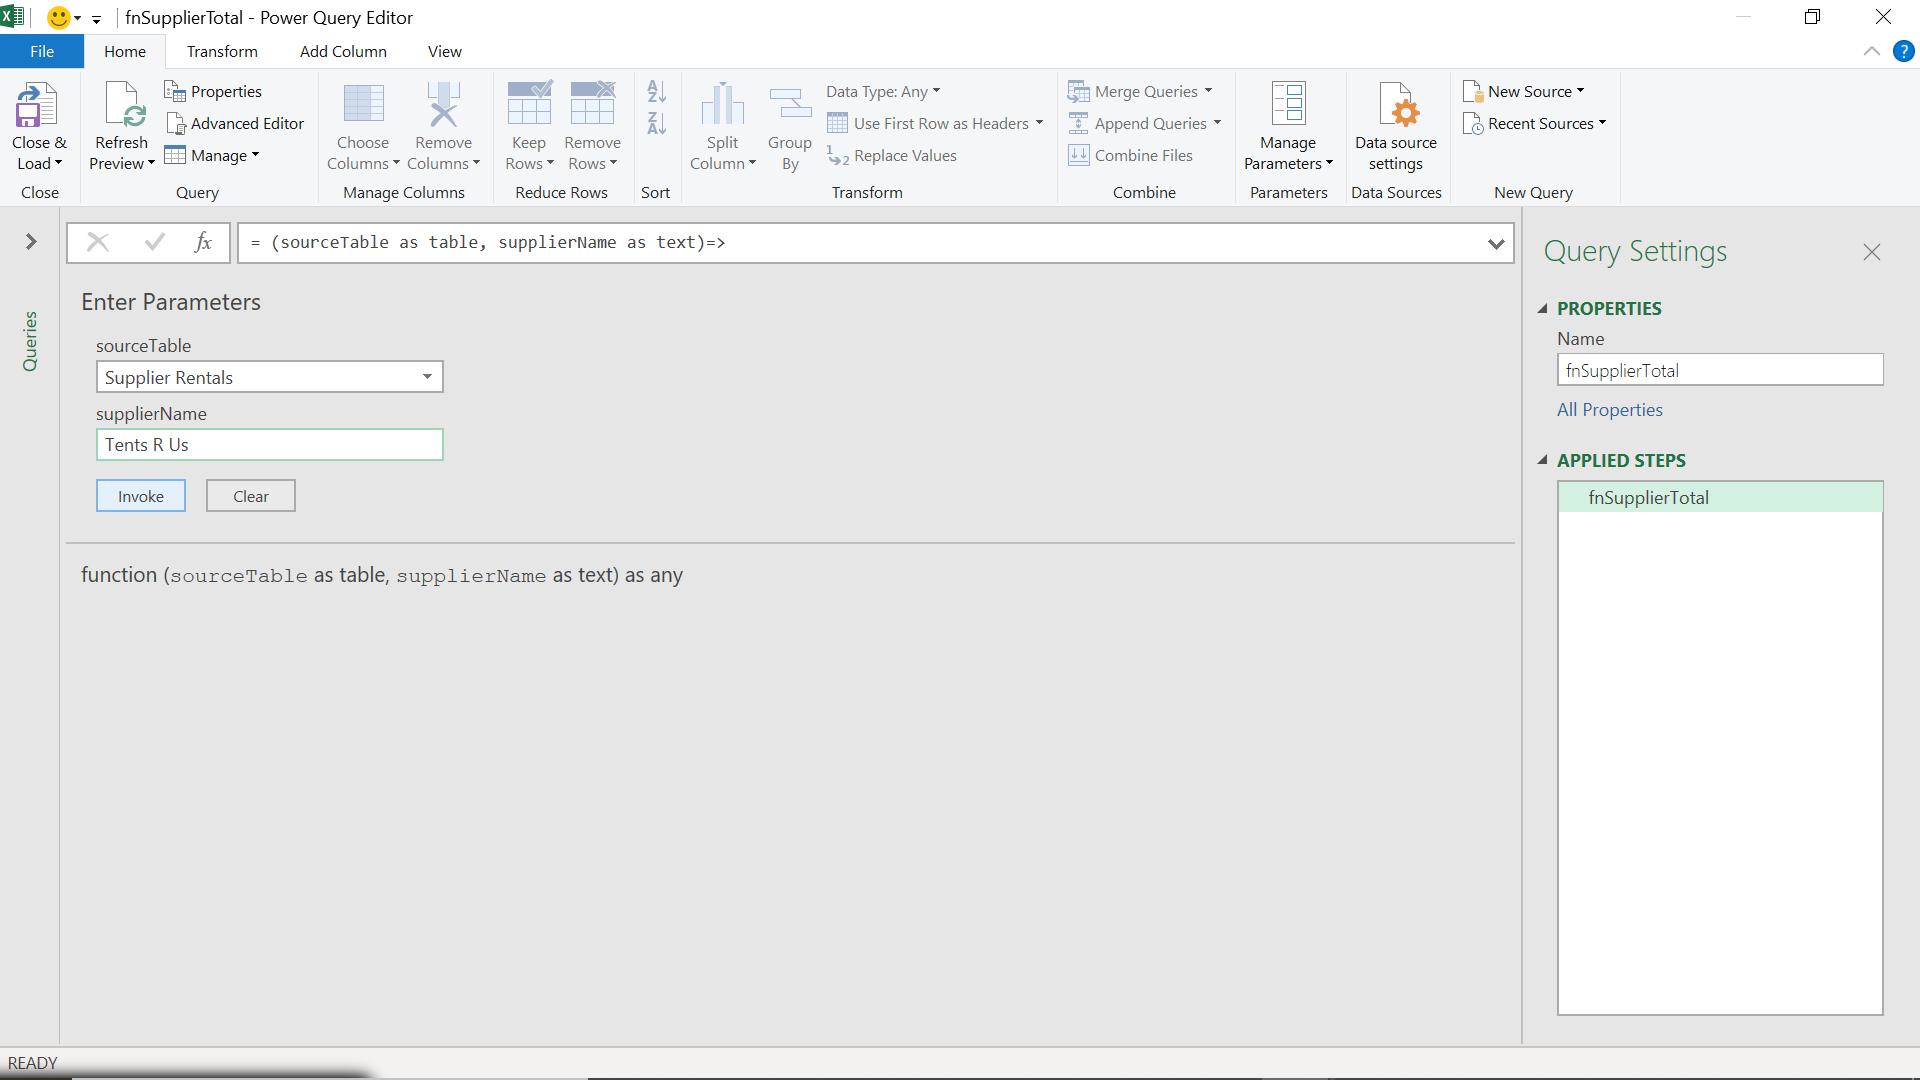
This should give me the total for ‘Tents R Us’.
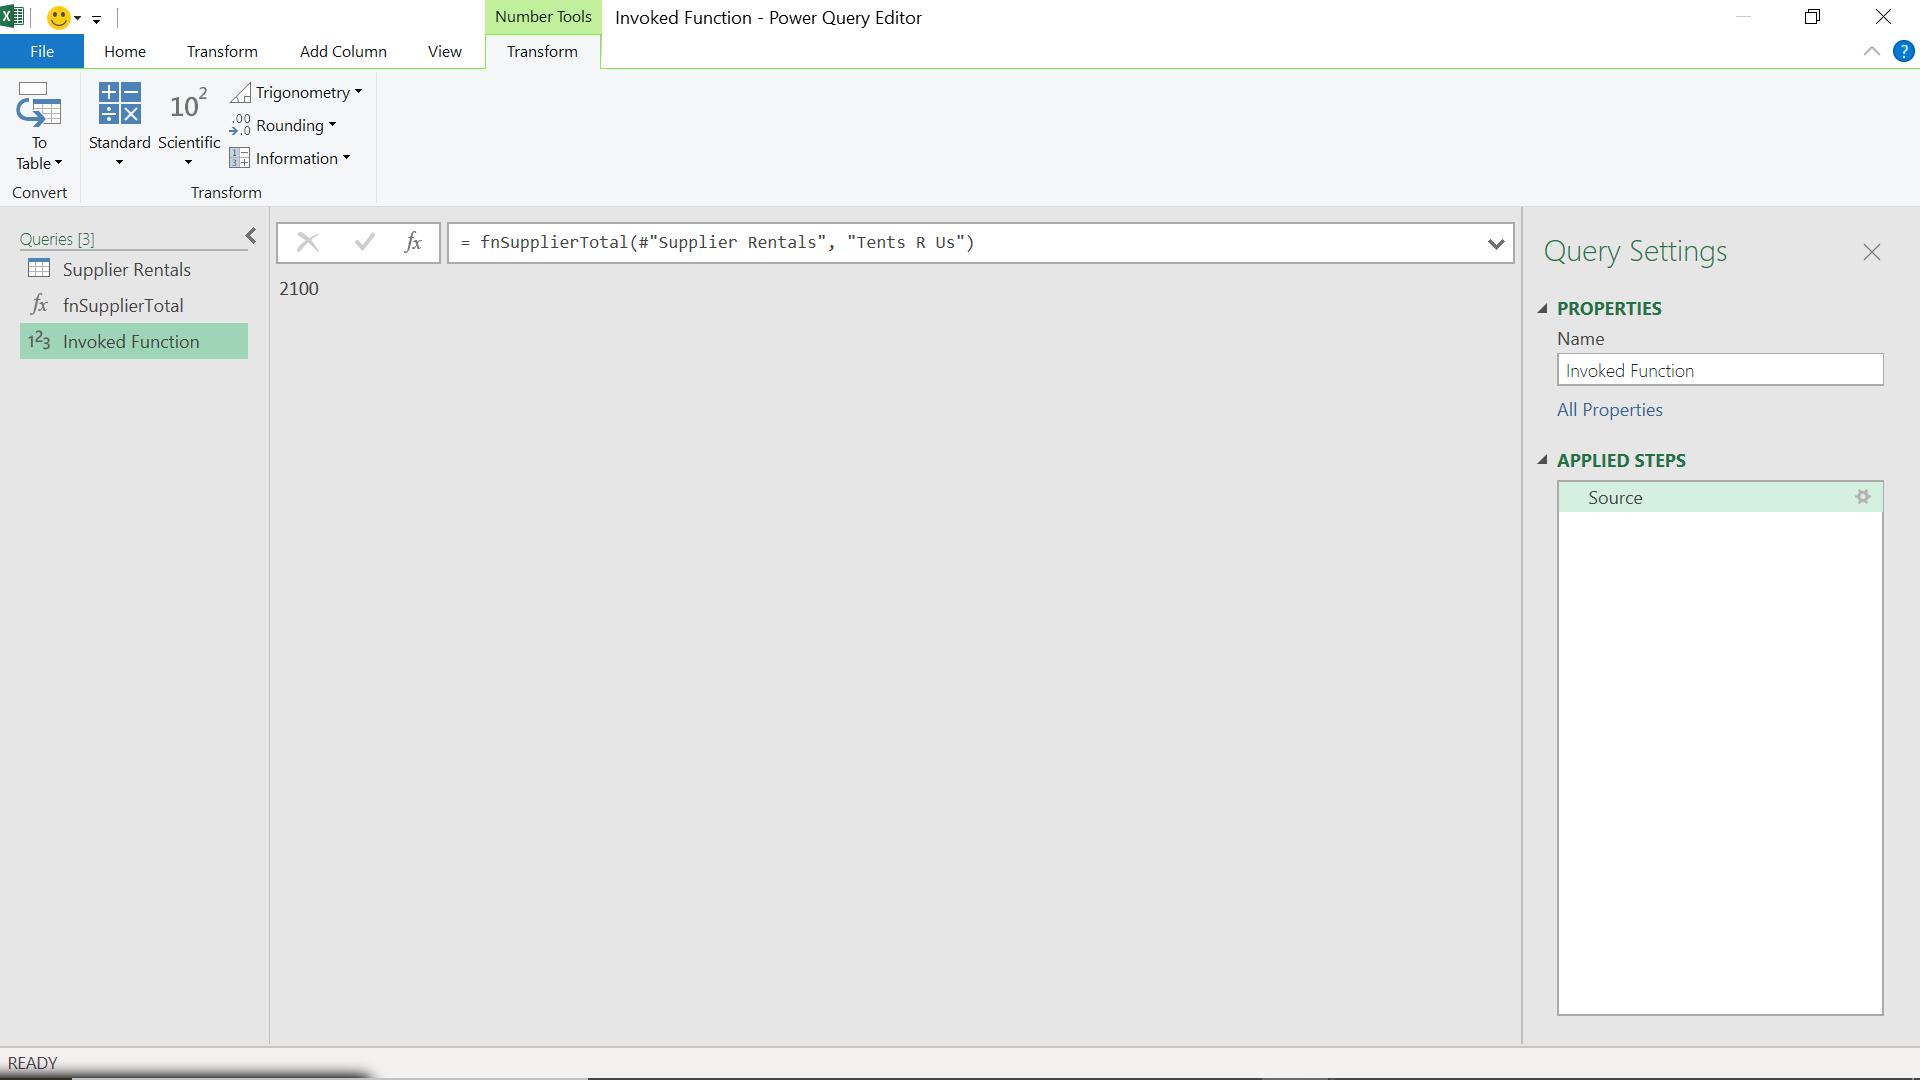
So far, so good.
Now, I go back to the ‘Supplier Rentals’ Query.
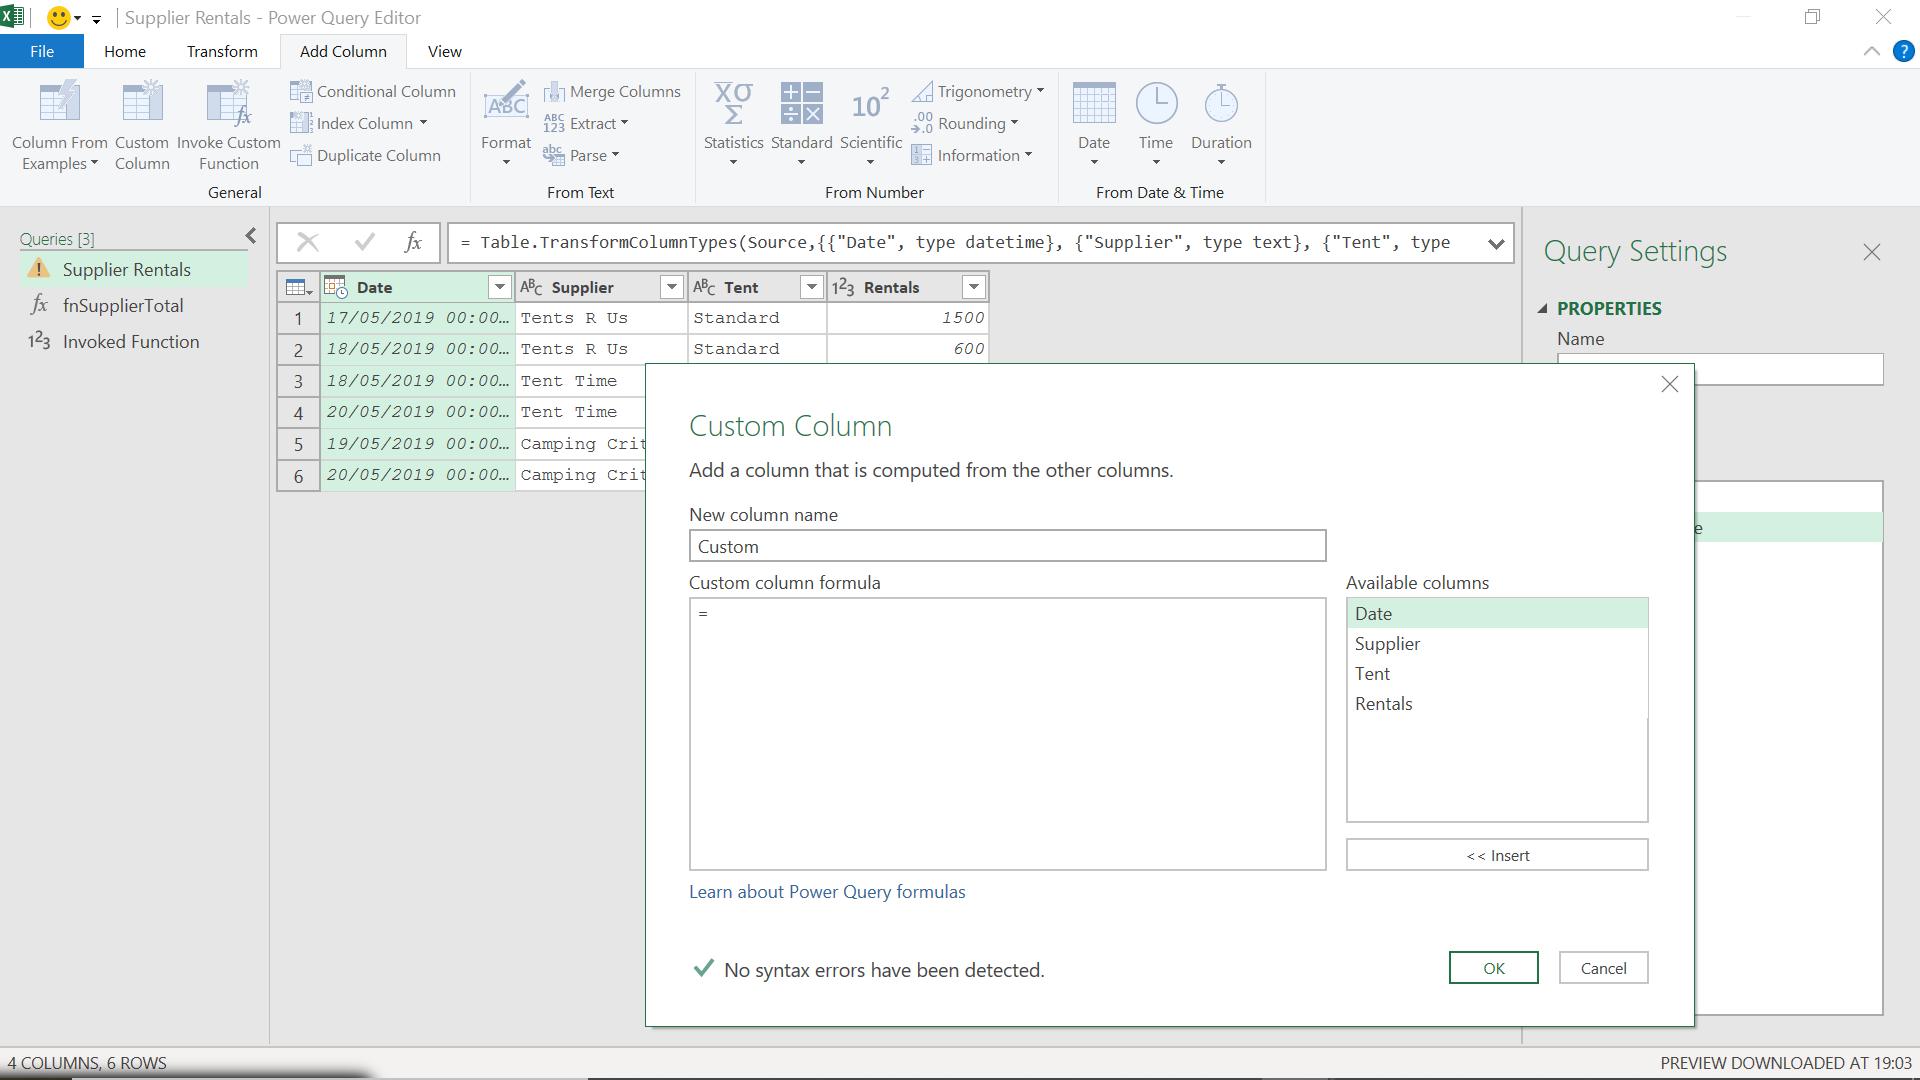
I am adding a custom column from the ‘Add Column’ tab.
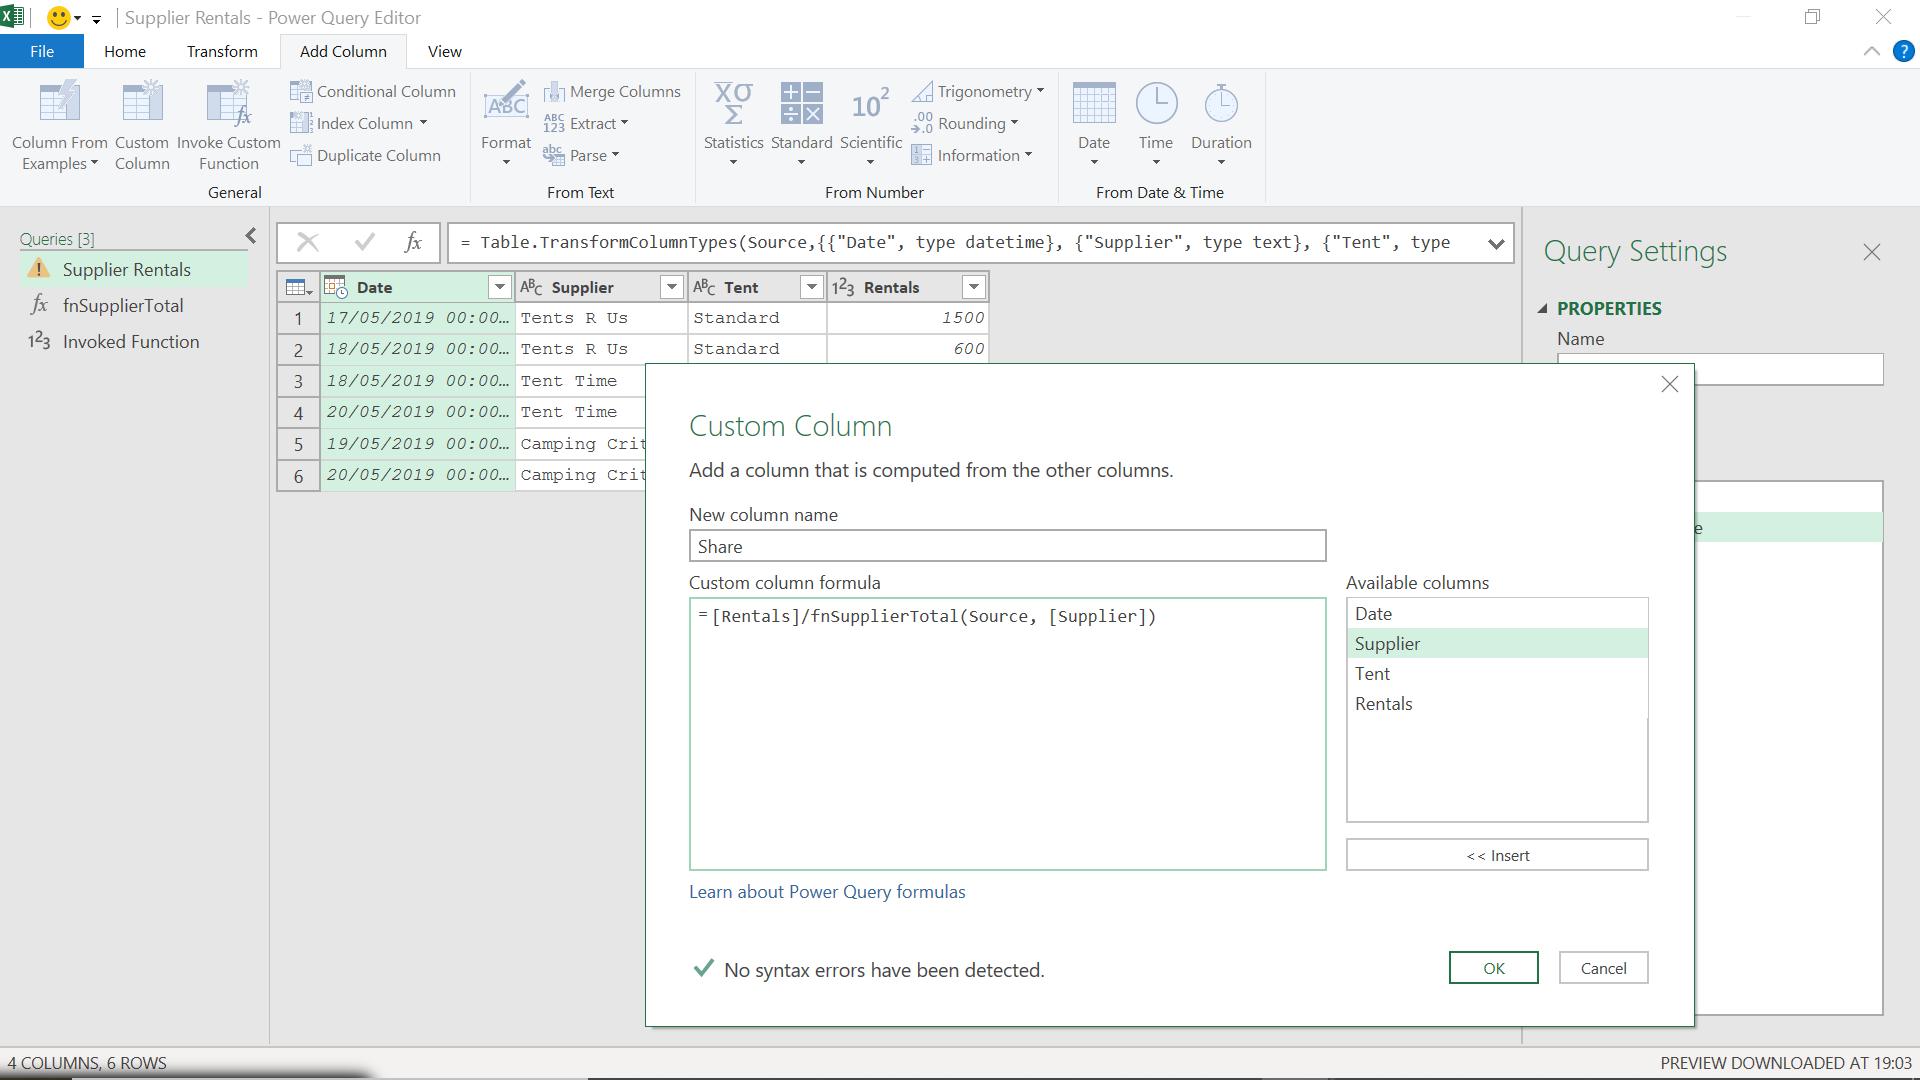
The M code I have used is:
= [Rentals]/fnSupplierTotal(Source, [Supplier])
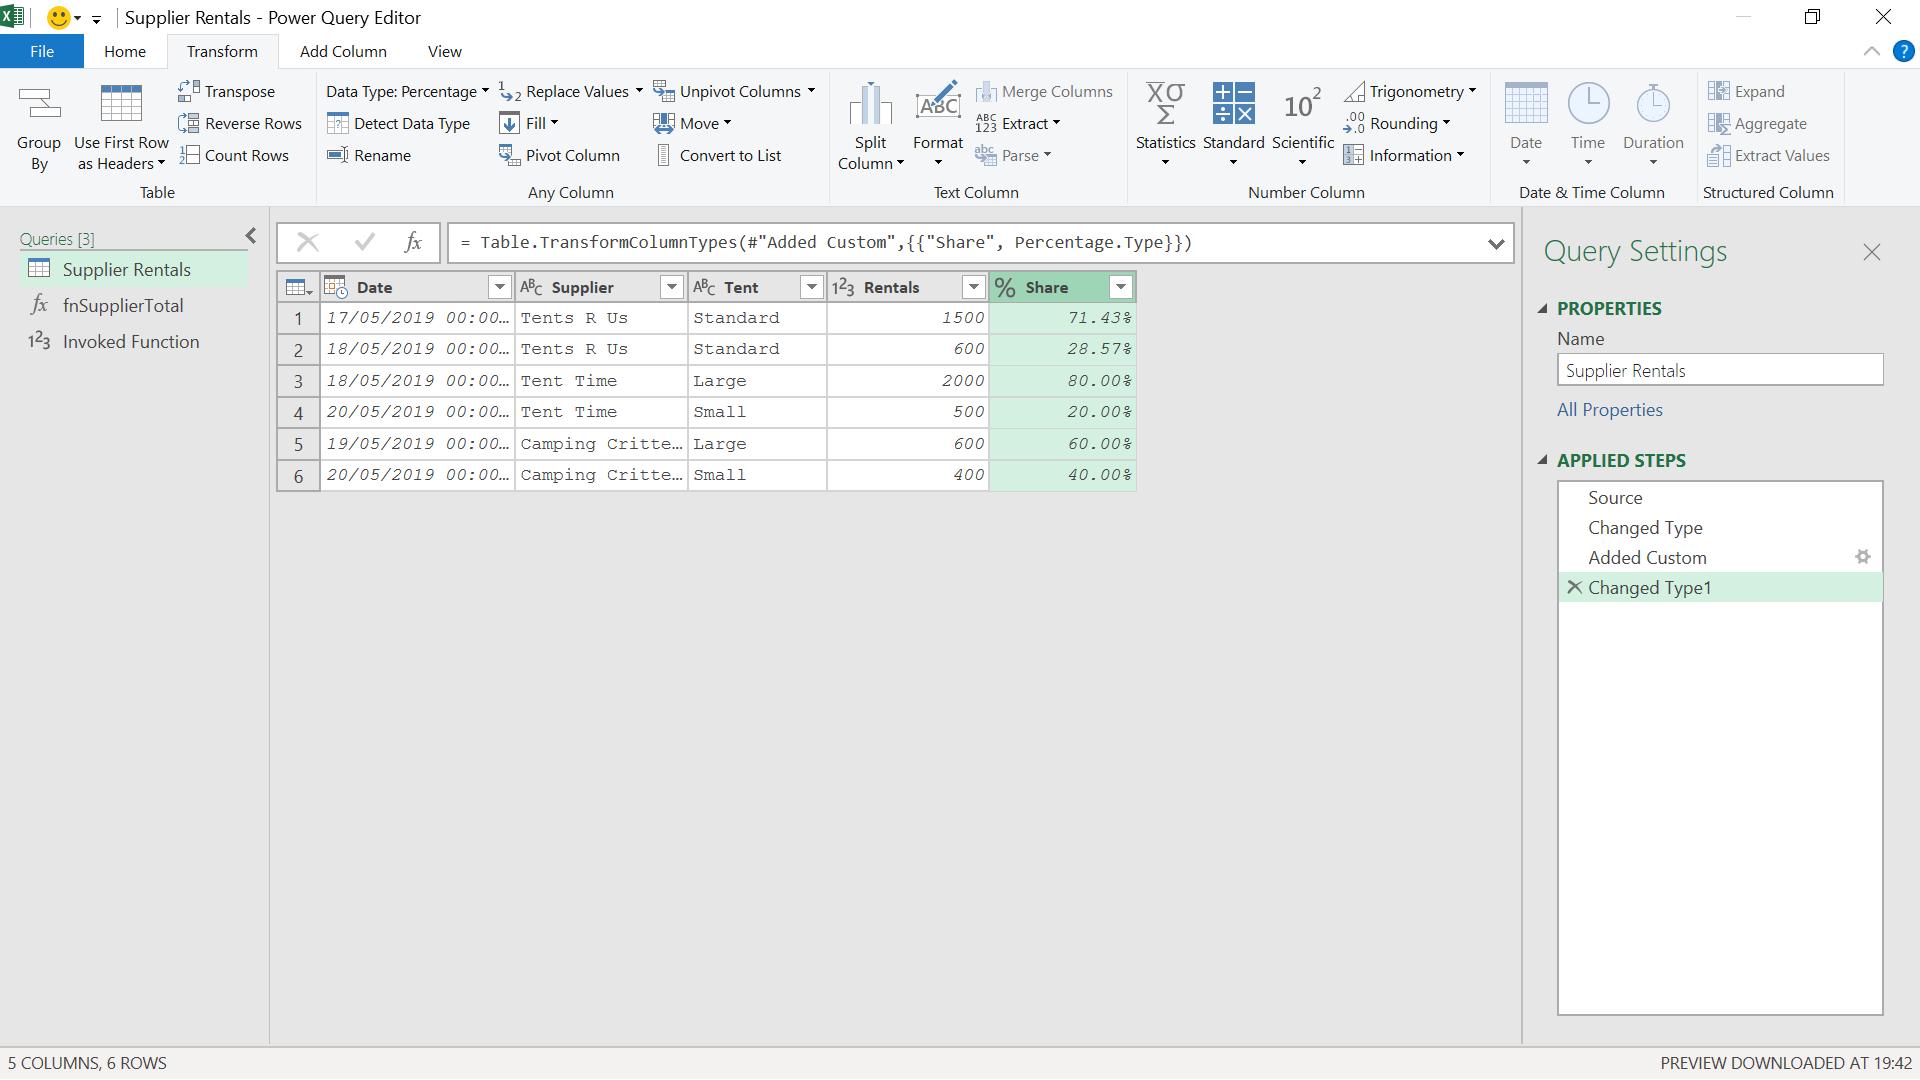
I am dividing the Rentals value by the total for the Supplier, as provided by my function.
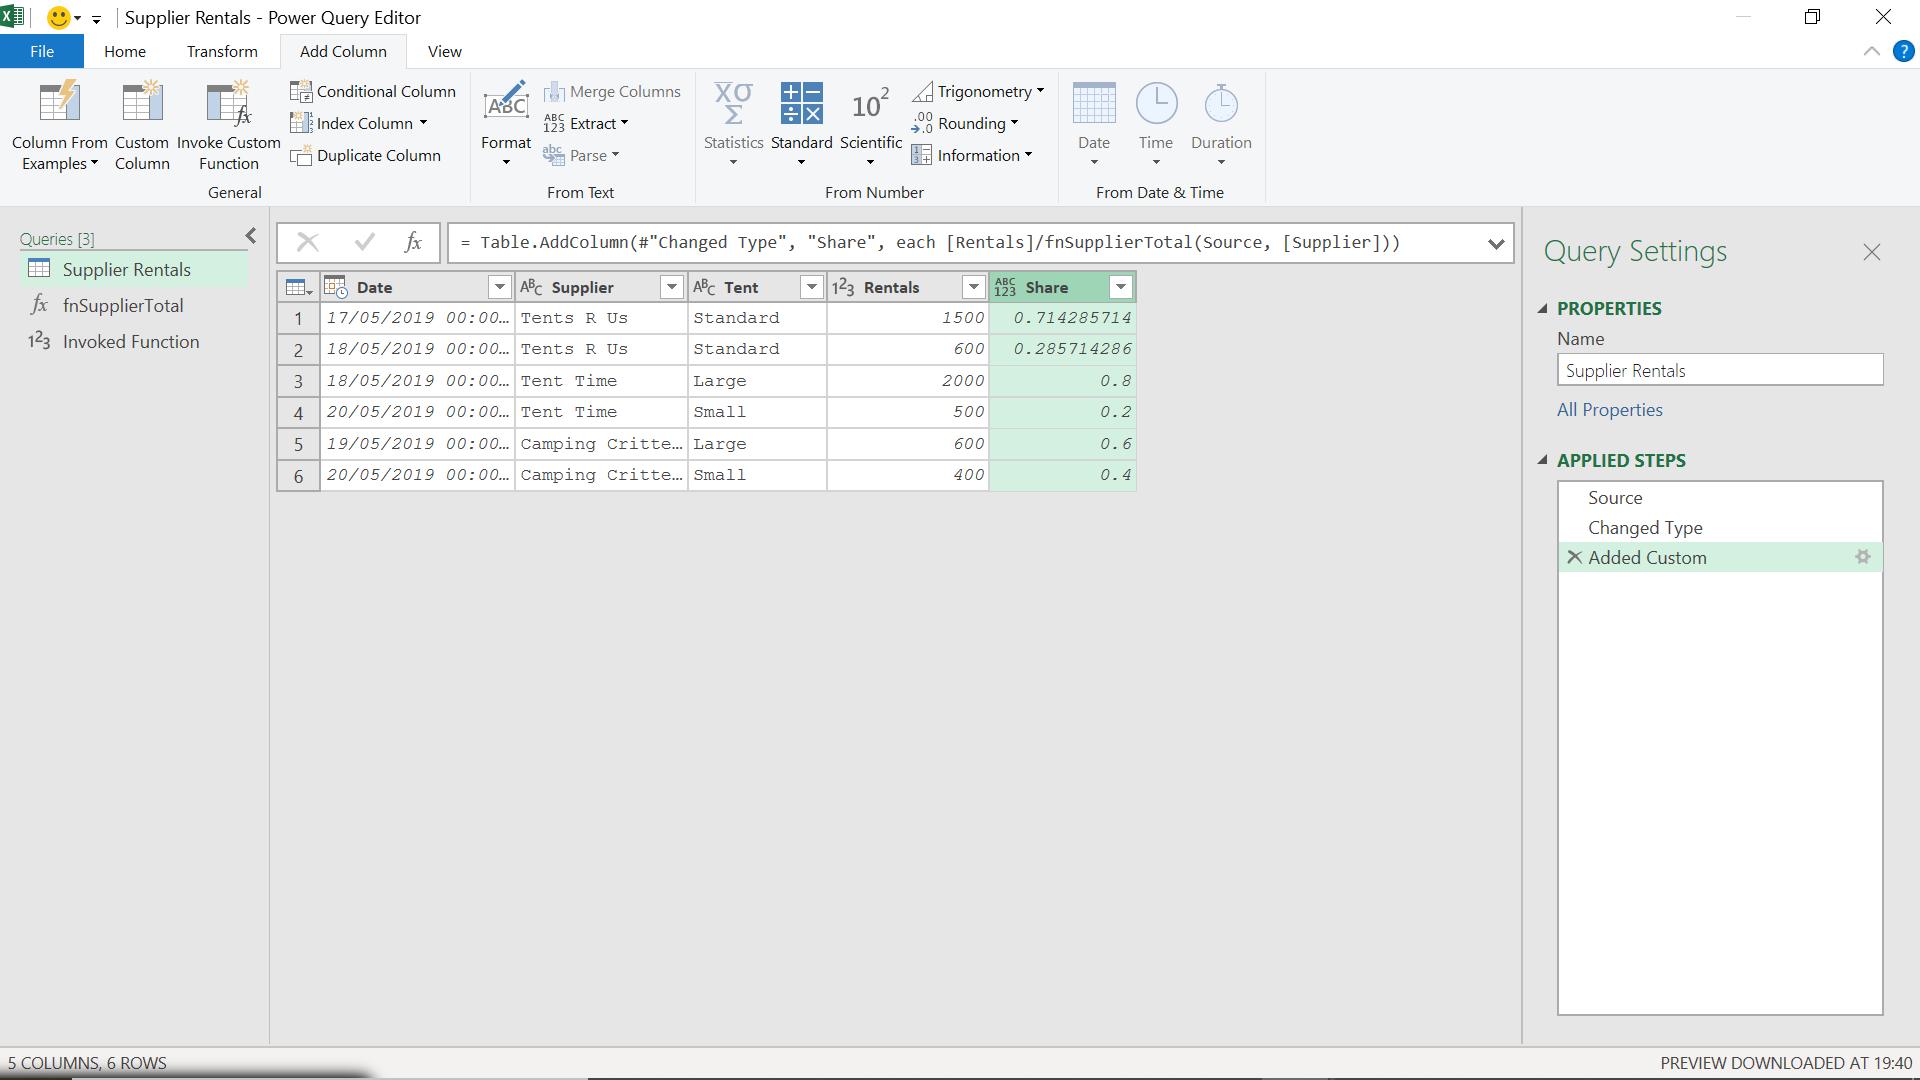
To show this as a percentage I can just change the Data Type to percentage from the Transform tab.
Come back next time for more ways to use Power Query!