
Power Query: Power Query Online – Part 11
18 October 2023
Welcome to our Power Query blog. Today, I look at the features on the right-click menu on the diagram view.
In the current series, I am looking at Power Query Online, which I have accessed from Power Apps:
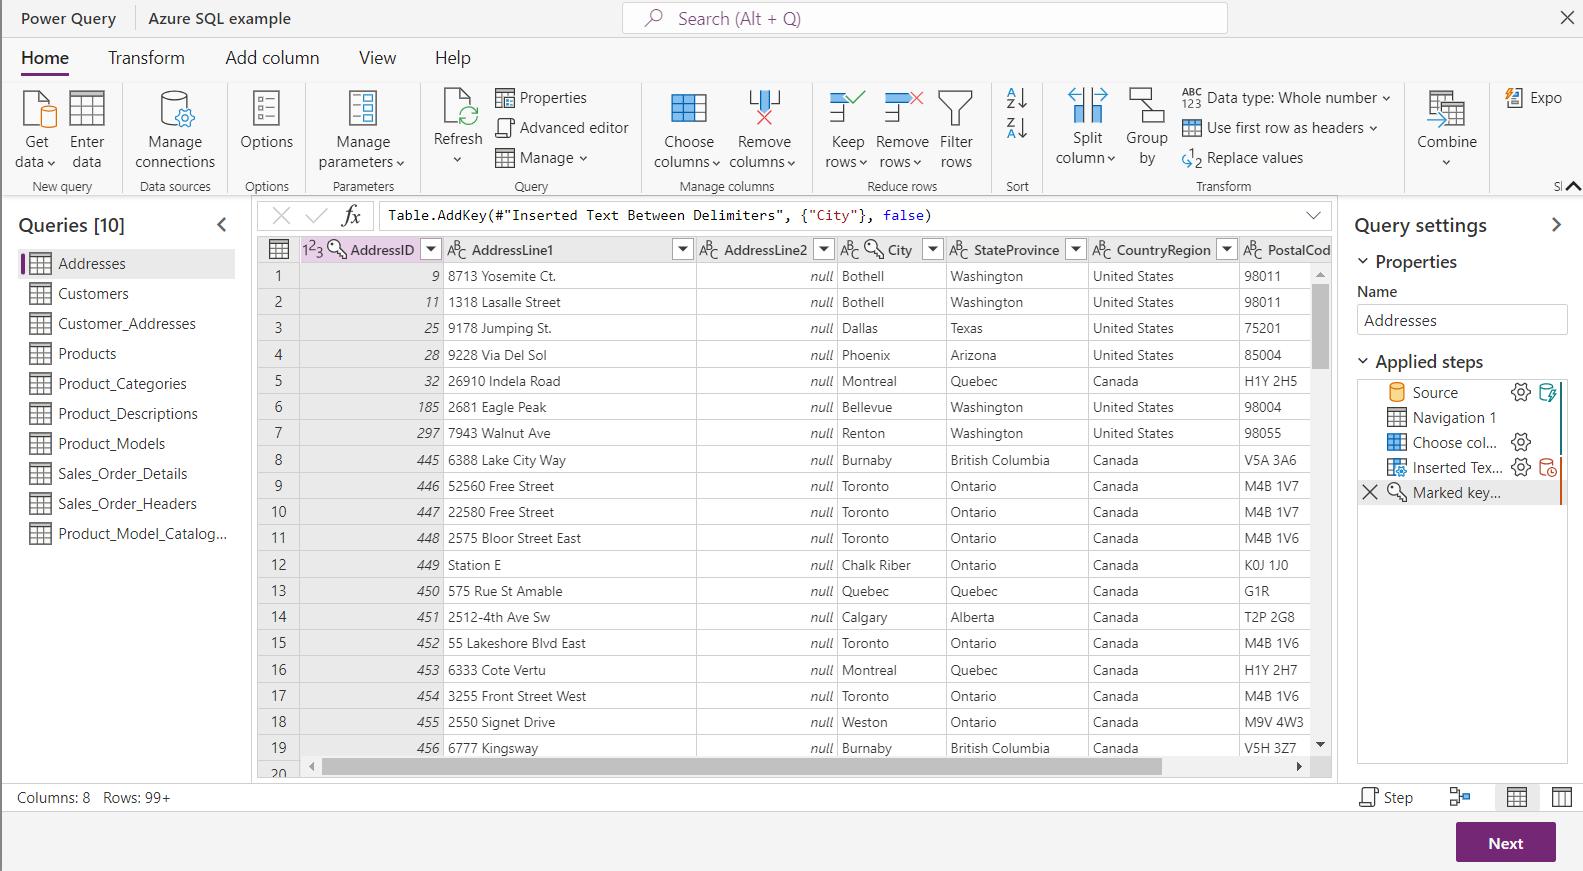
Last week, I looked at some data that I have imported from an Azure SQL database:
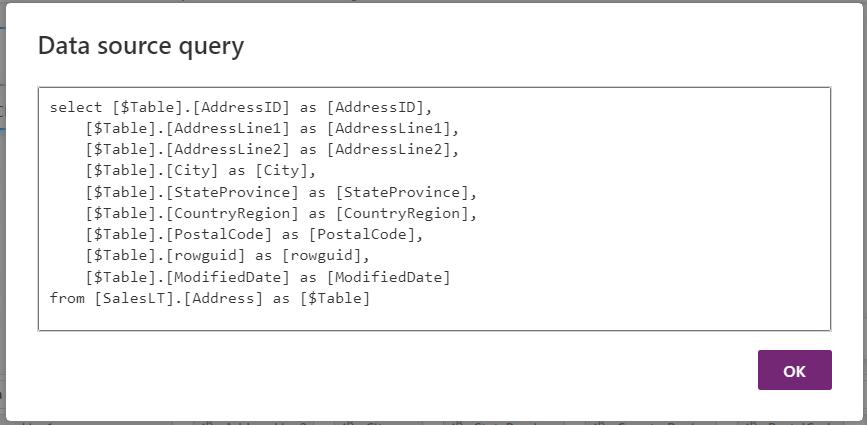
I looked at the information about query folding, which is easy to access from the Diagram view:

On the right-click menu, I had the option to ‘View data source query’:
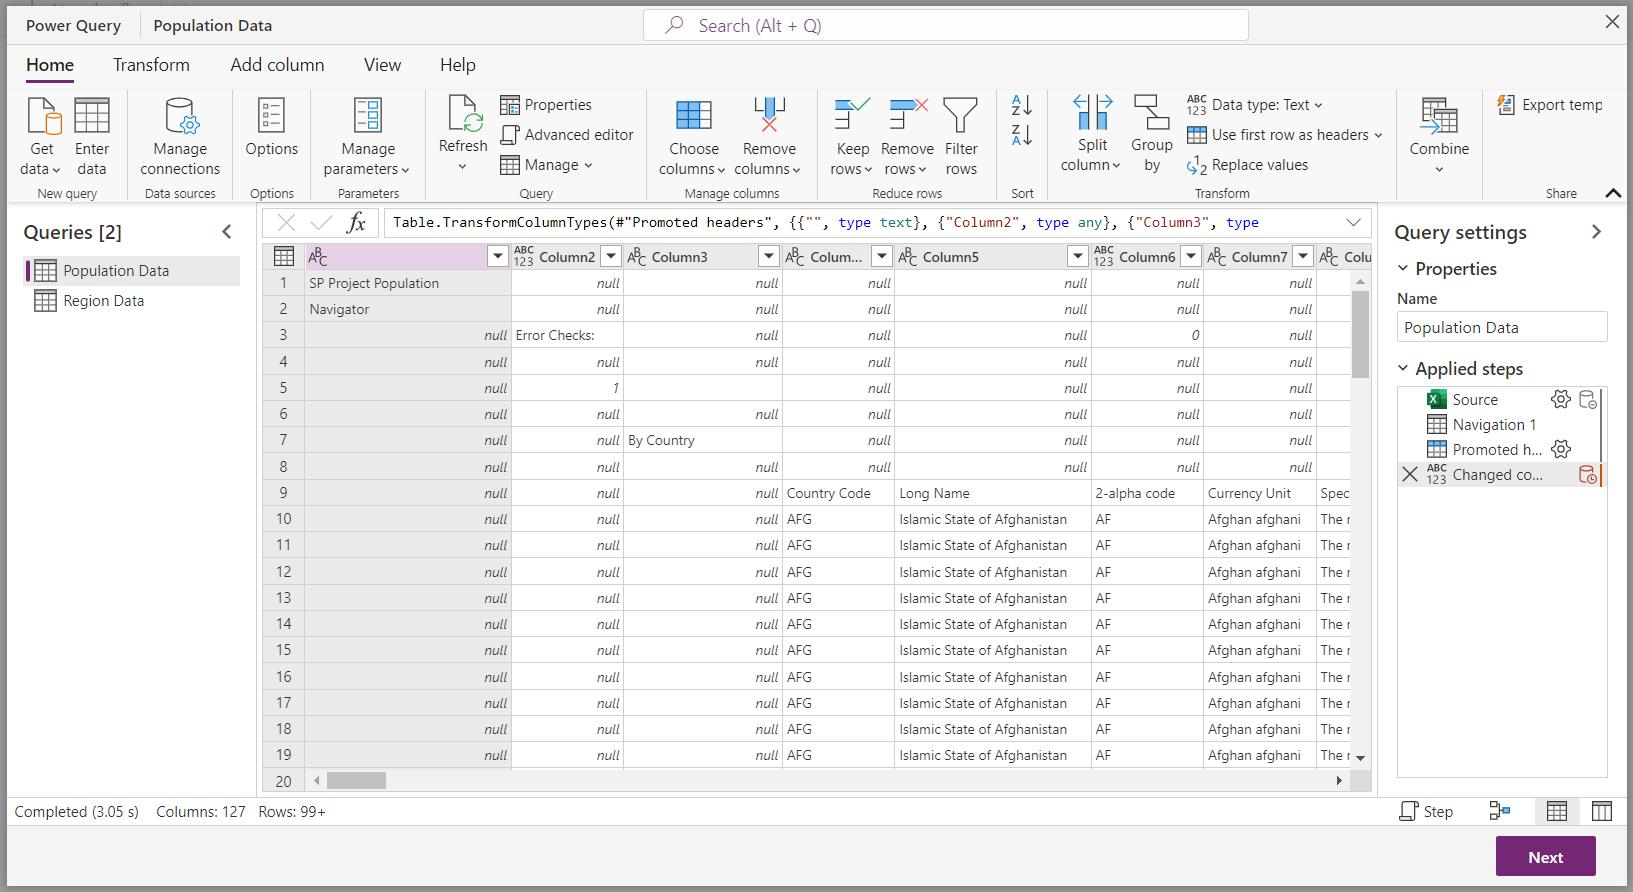
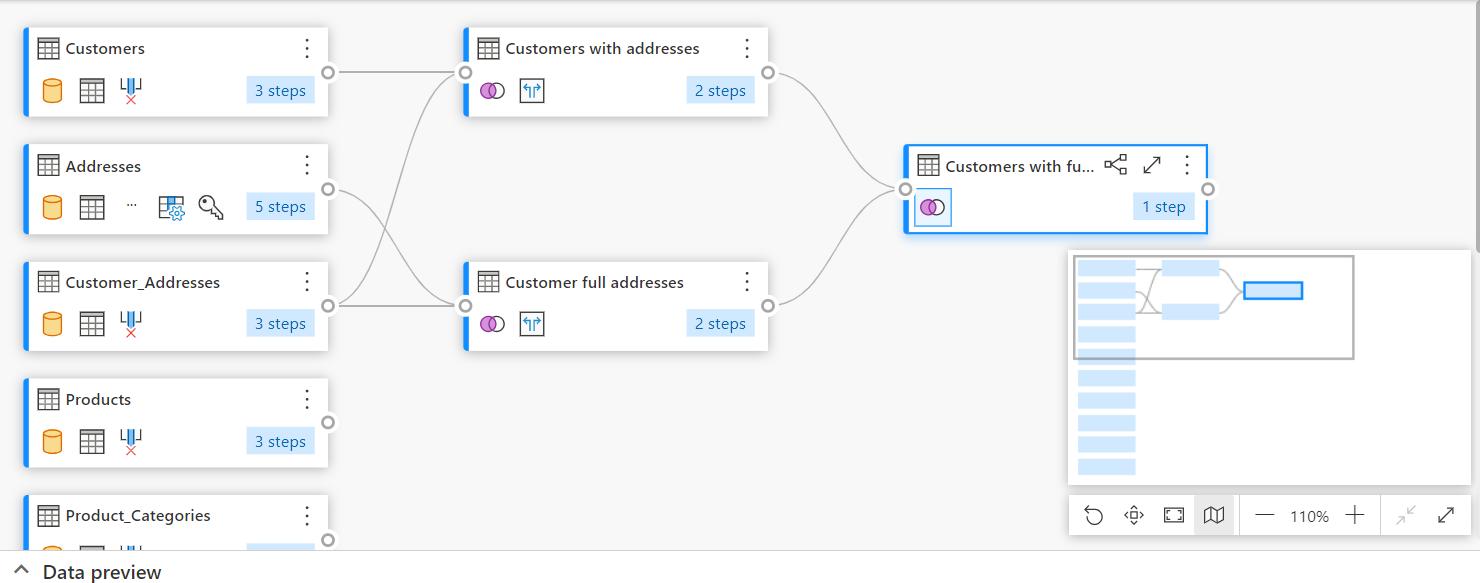
This time, I am going to look at how easy it is to analyse the relationships between queries in my current project. I have merged some of my queries:
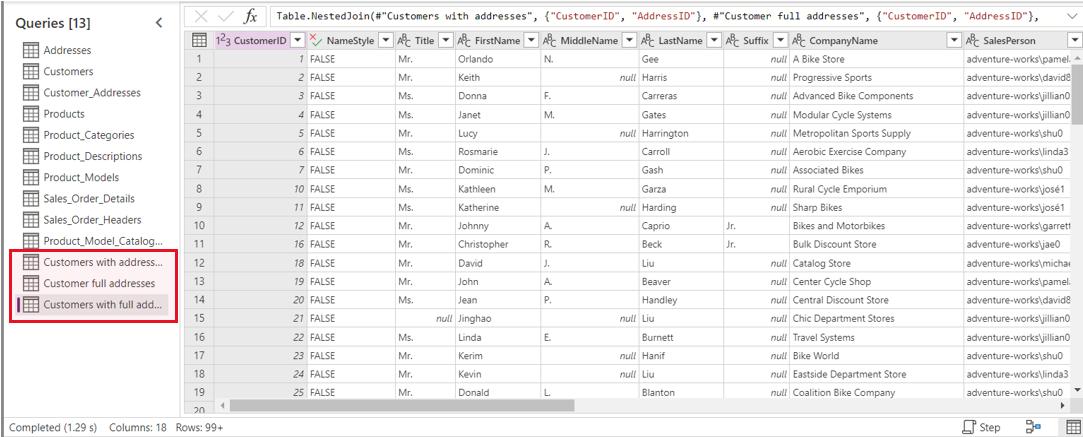
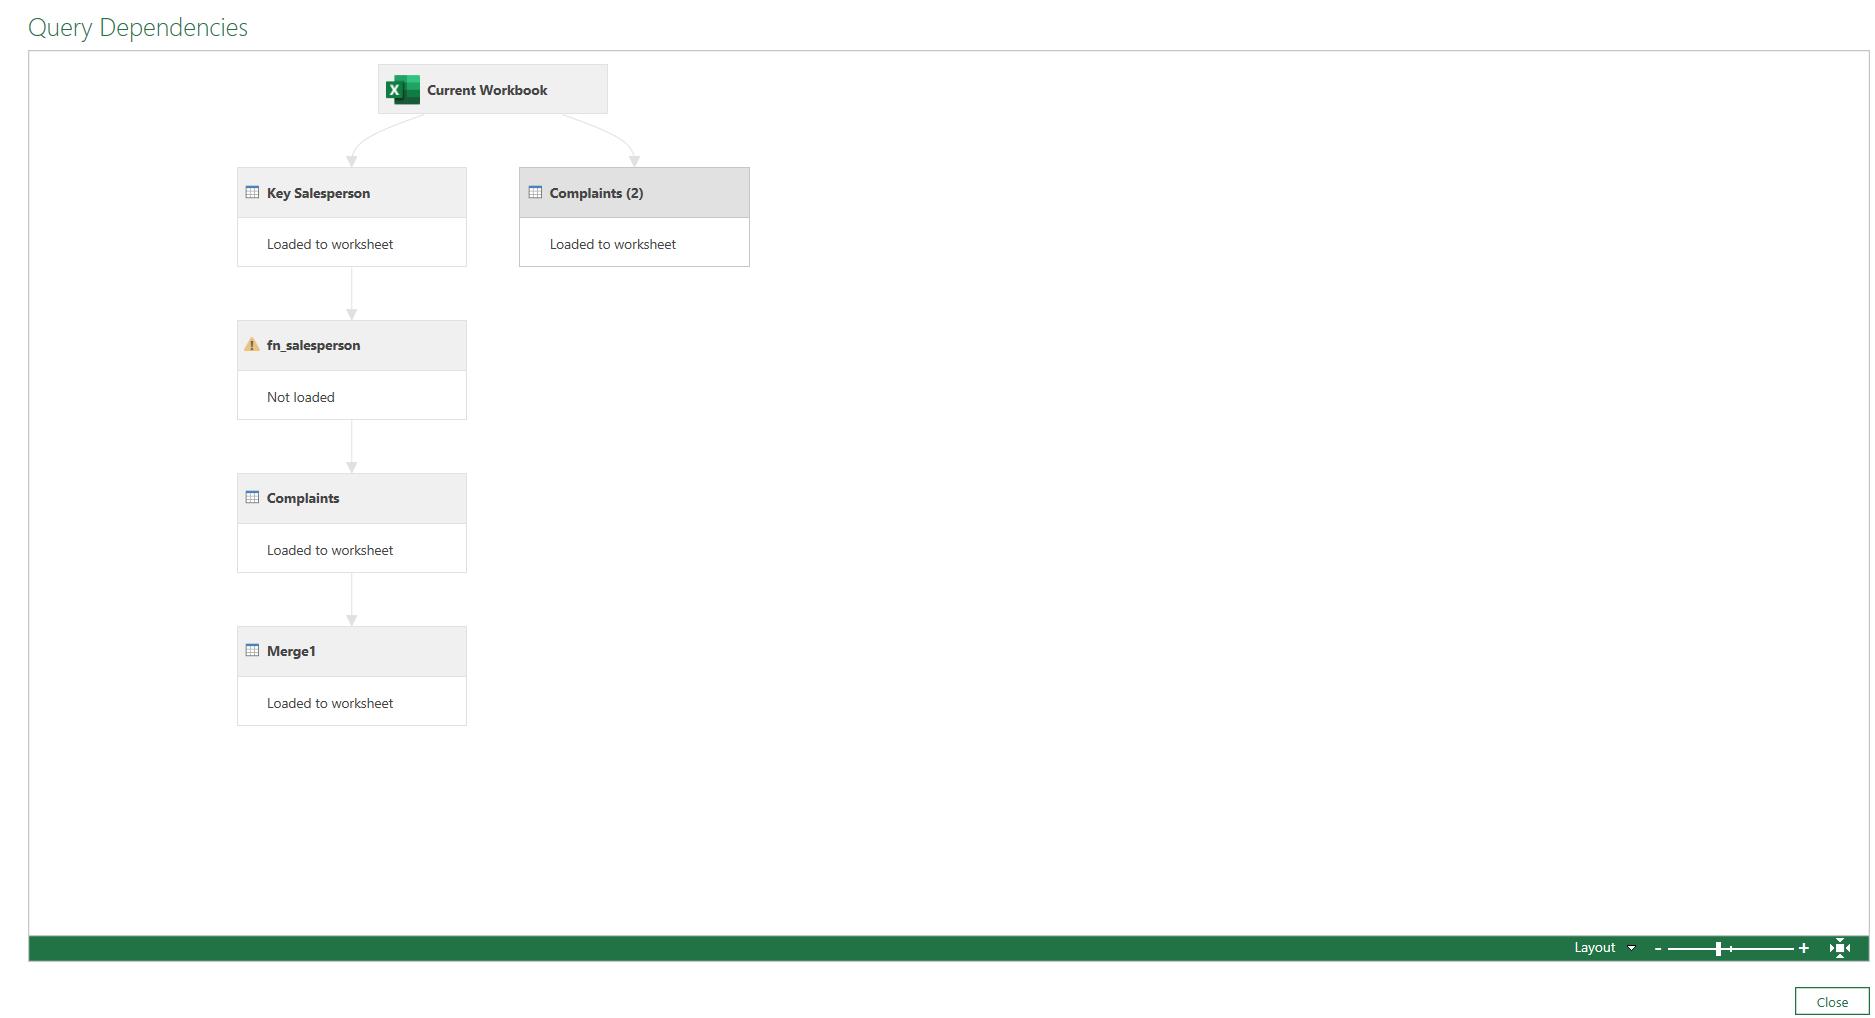
Whilst I have tried to give the new merged queries sensible names, I would like to be able to view the dependencies. In Power Query desktop, I am able to do this using ‘View Query Dependencies’ from the View tab (this is showing a different project):
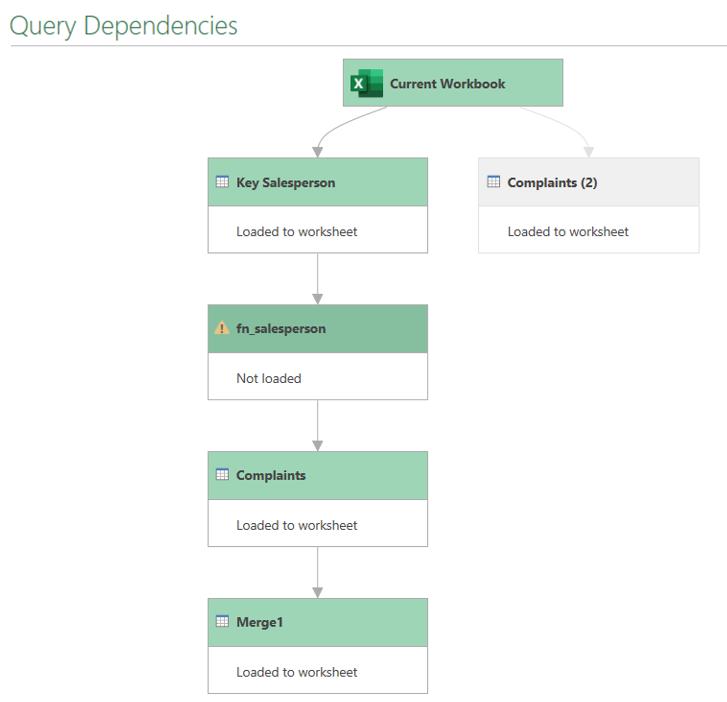
If I click on one query, then any dependent queries, and any queries that this query depends upon, are shown highlighted:
However, the diagram view in Power Query Online allows me to do much more:
I can access the settings for the diagram view by right-clicking in the pane without selecting a particular query:
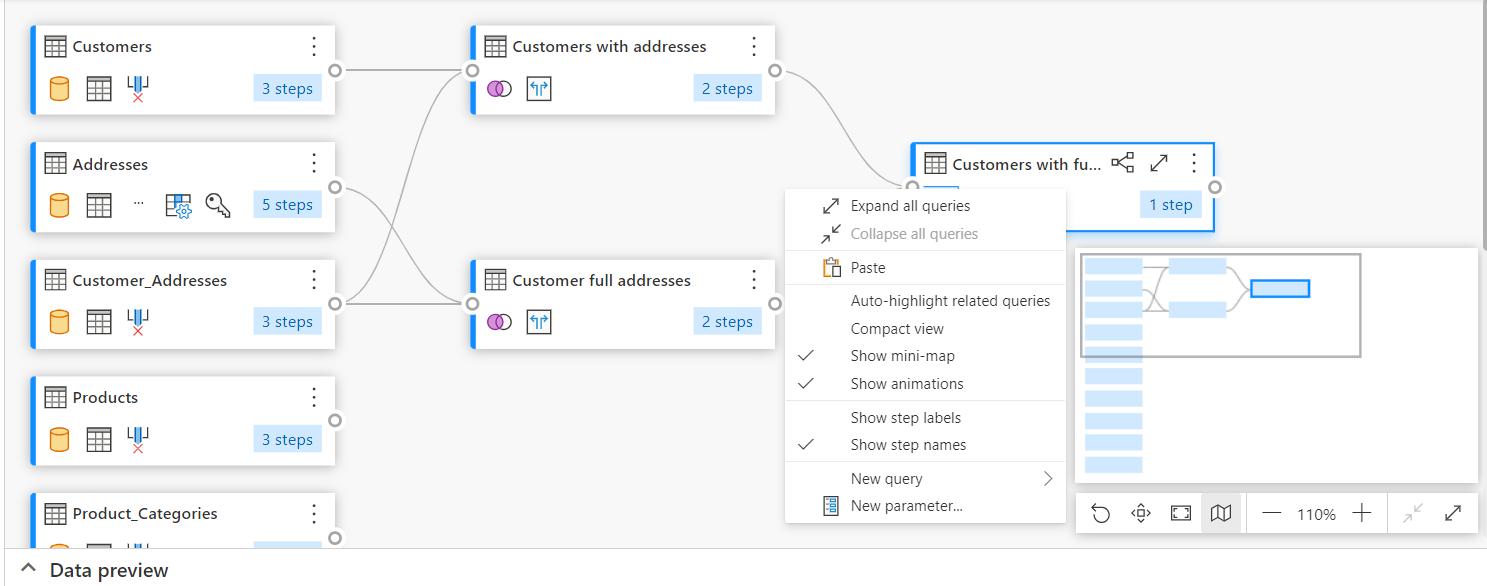
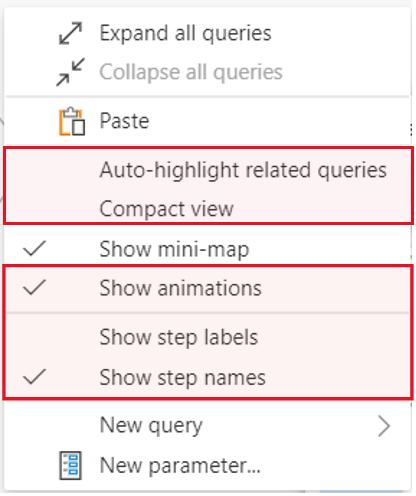
Before I move on to the tools I can use to see relationships between queries, let’s look at what else I can do here. The options I have are for all queries, apart from the options to create a new query, which I can do by using ‘Paste’, having copied a query, or by choosing ‘New query’:
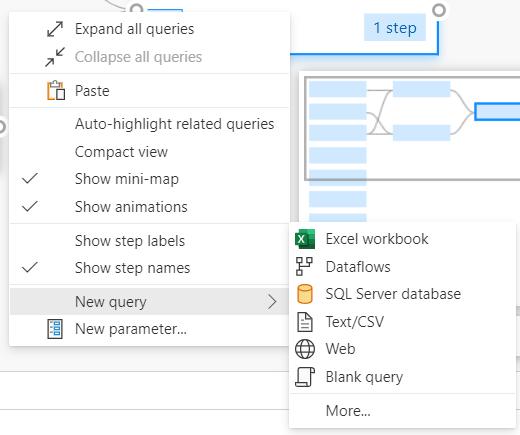
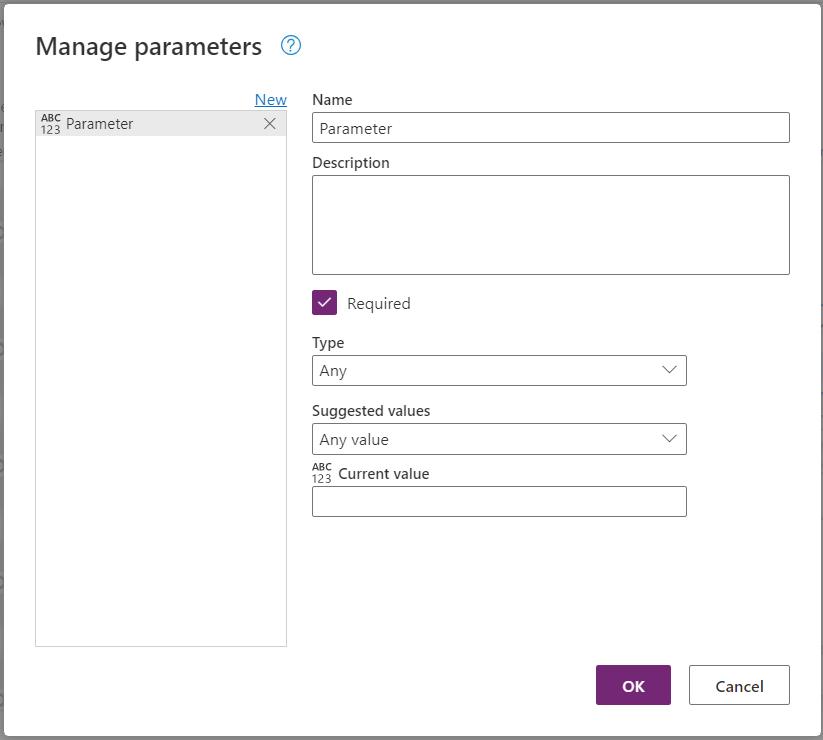
I can also create a ‘New Parameter’ from here, which takes me to the same ‘Manage Parameters’ dialog that I see in Power Query desktop:
I can ‘Expand all queries’ and ‘Collapse all queries’, which is a process I describe in Part 3, along with the mini-map functionality.
Next time, I’ll look at the rest of the options on the menu:
Come back next time for more ways to use Power Query!