
Power Query: PDF Pandemonium – Part 3
29 September 2021
Welcome to our Power Query blog. This week, I continue transforming some data that is coming in from a PDF file.
The tent business is doing well, and the UK division have plans to expand the workforce. I have a PDF file, and it contains tables for 10 stores. Last week, I created two Reference Queries, and this week I will continue transforming Pay Scales.
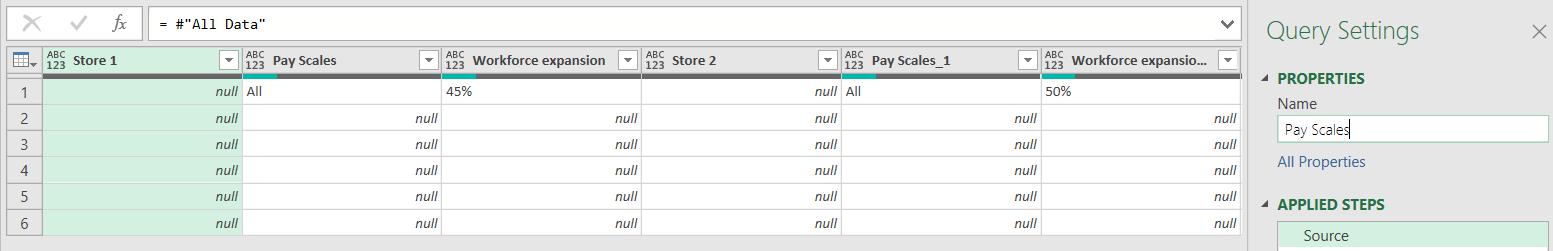
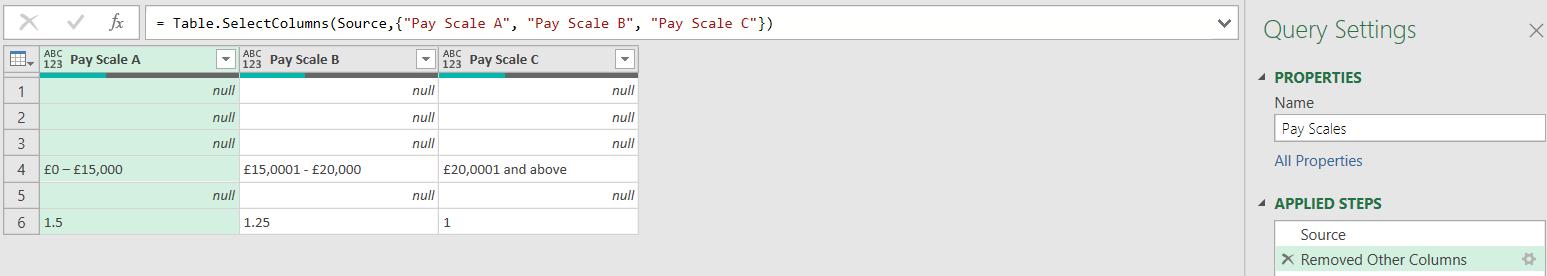
I start by keeping the columns I will be needing for this table.
This means I can concentrate on the data I need to transform for this table.
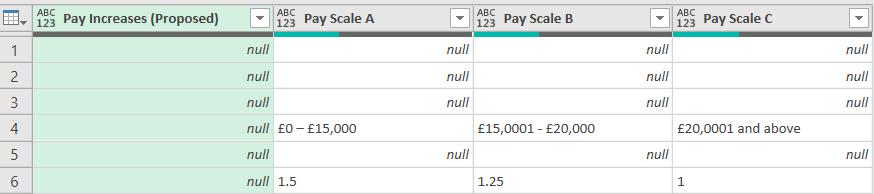
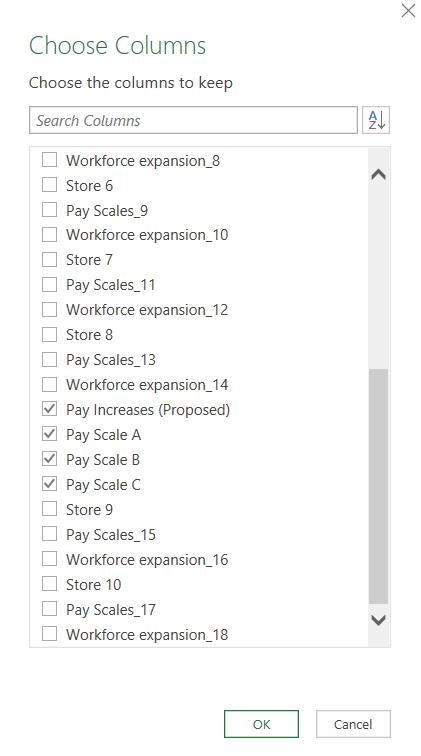
Having checked the data, I actually only need the pay scale columns, so I select them whilst holding down the CRTL key and click on ‘Remove Other Columns’.
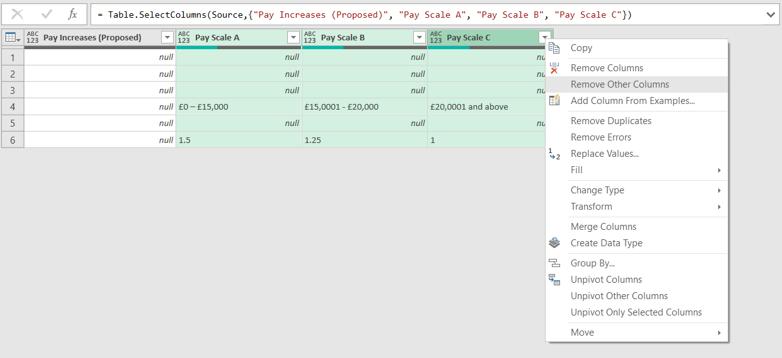
Power Query incorporates this into the existing ‘Remove Other Columns’ step.
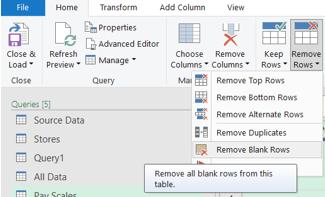
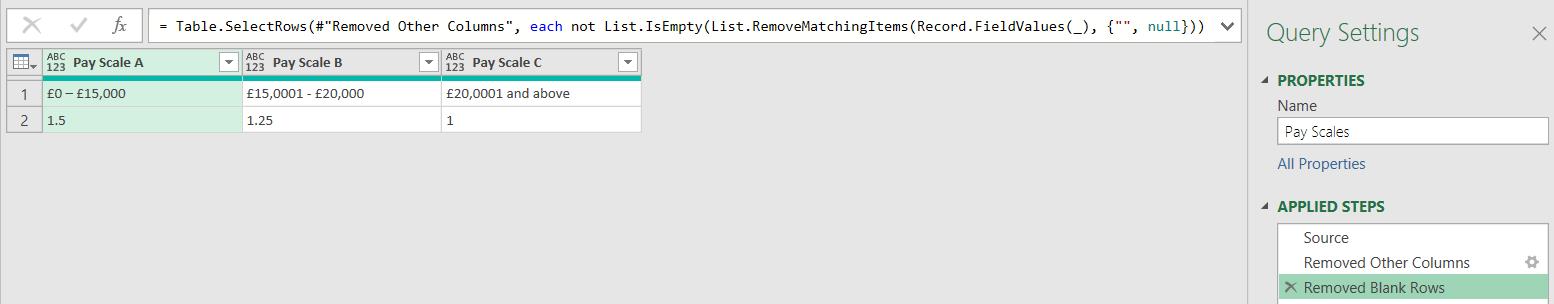
I can remove empty rows from the Home tab.
I can now look at how to transform my data from this into a useful table.
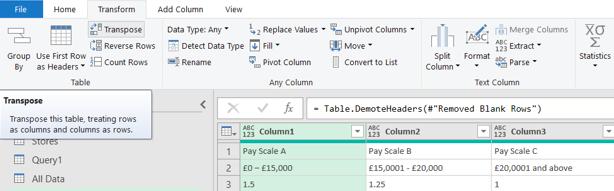
I want to transpose the data, but if I do this with some of the data I need in the column headings, I will lose it. First, I need to demote the column headings so that I have the information in a row. I can do this from the Home tab.
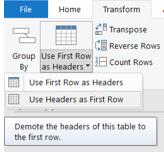
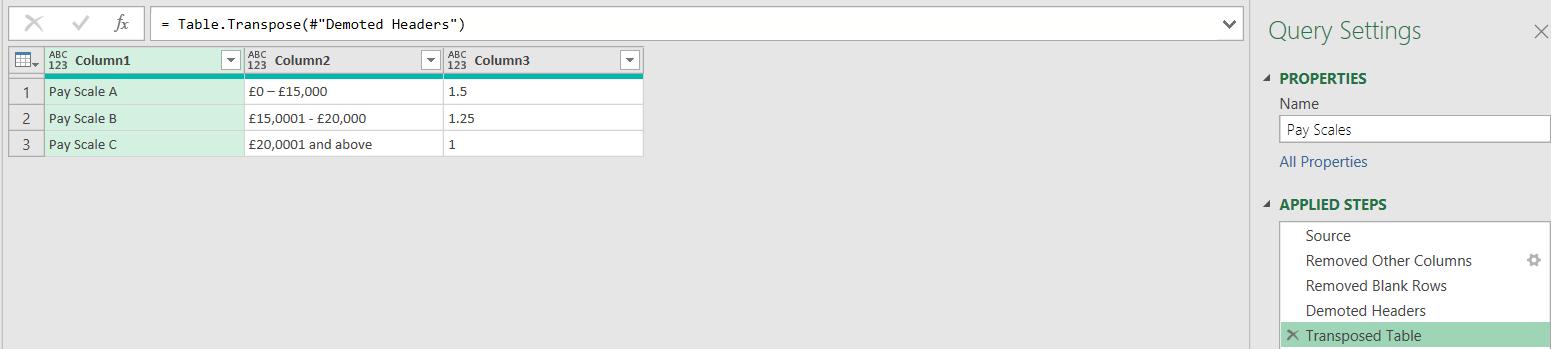
This creates a ‘Change Type’ step which I delete as I am not ready to decide column types yet. I am now ready to transpose my data, using the option on the Transform tab.
My data is starting to take shape.
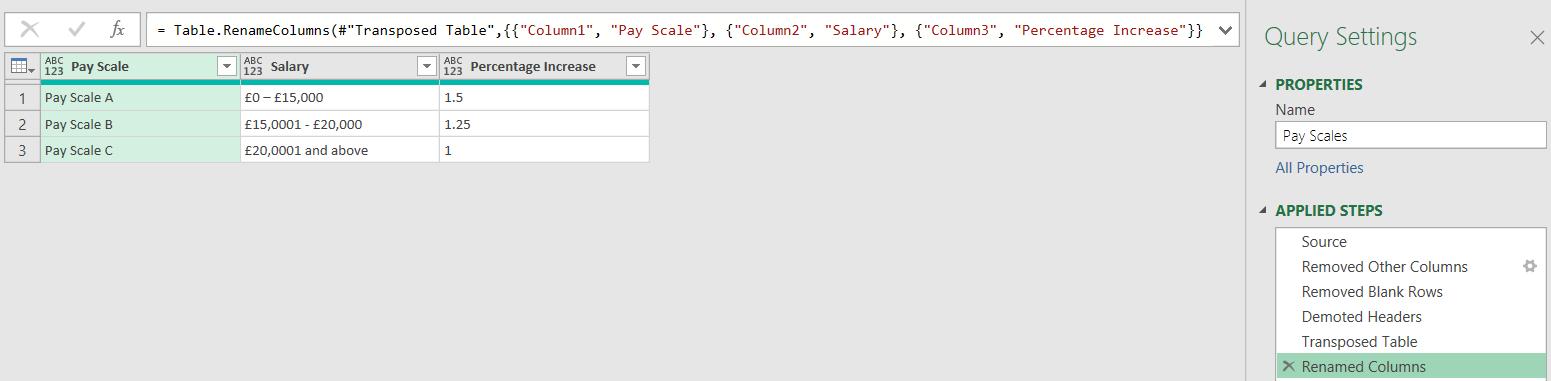
I can rename the headings.
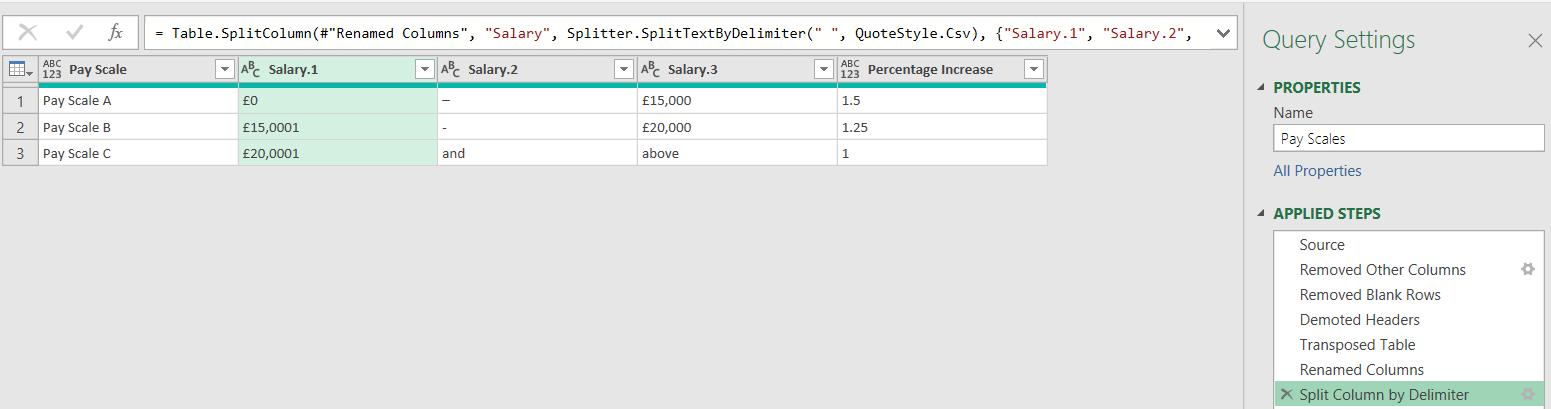
I want to show a start and end salary, rather than have the information in one column. I can split the Salary column from the Transform tab.
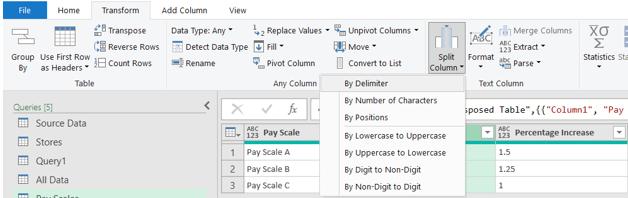
From the dropdown, I choose to split ‘By Delimiter’; this brings up a dialog.
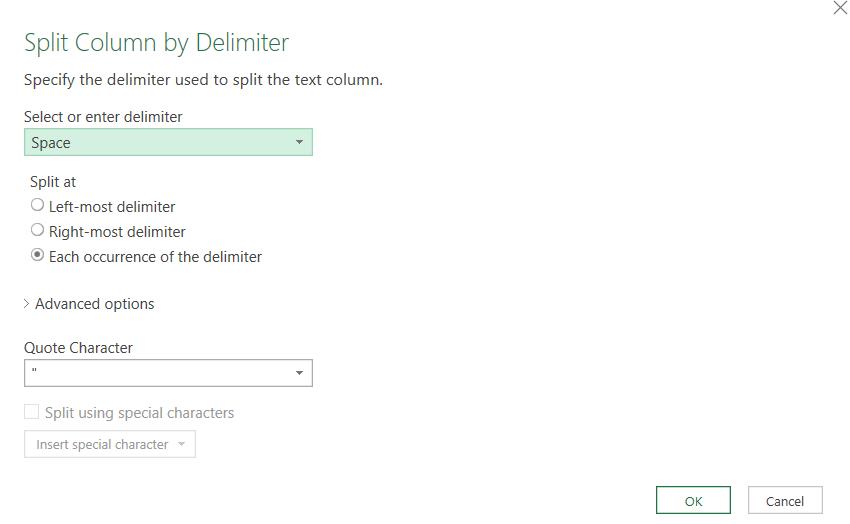
I choose to split by space at each occurrence of a space, because this will give me a column with the lower and upper limit.
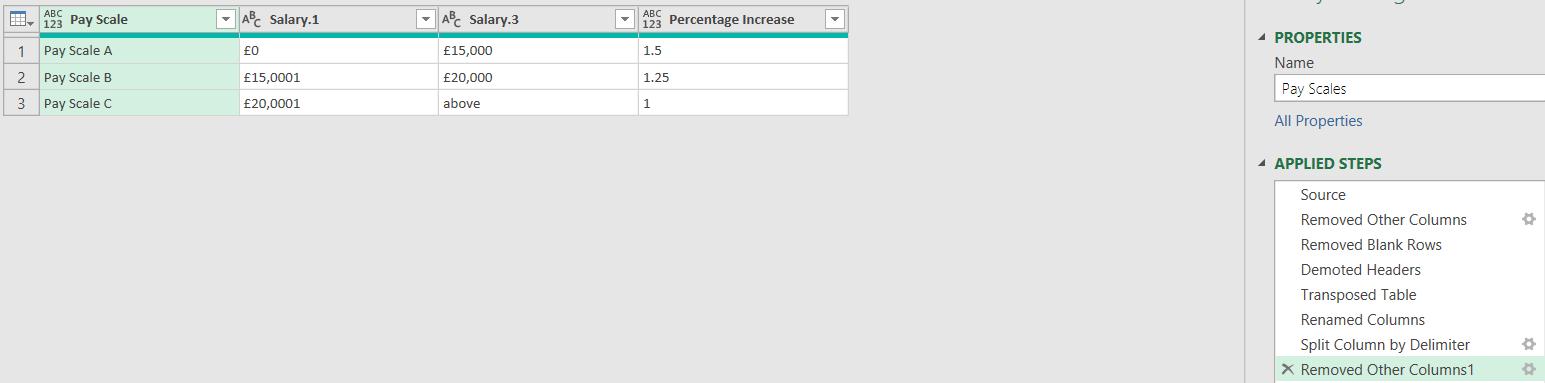
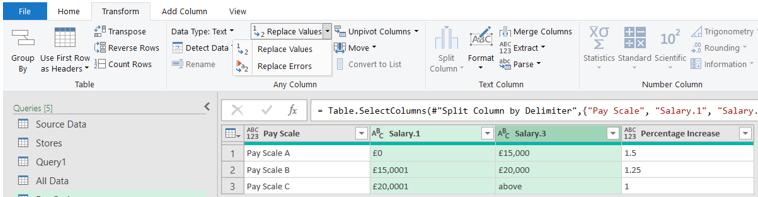
I delete the automated ‘Changed Type’ step again. I don’t need Salary.2, so I can remove this. As usual, I do this by selecting the columns I want to keep and ‘Remove Other Columns’.
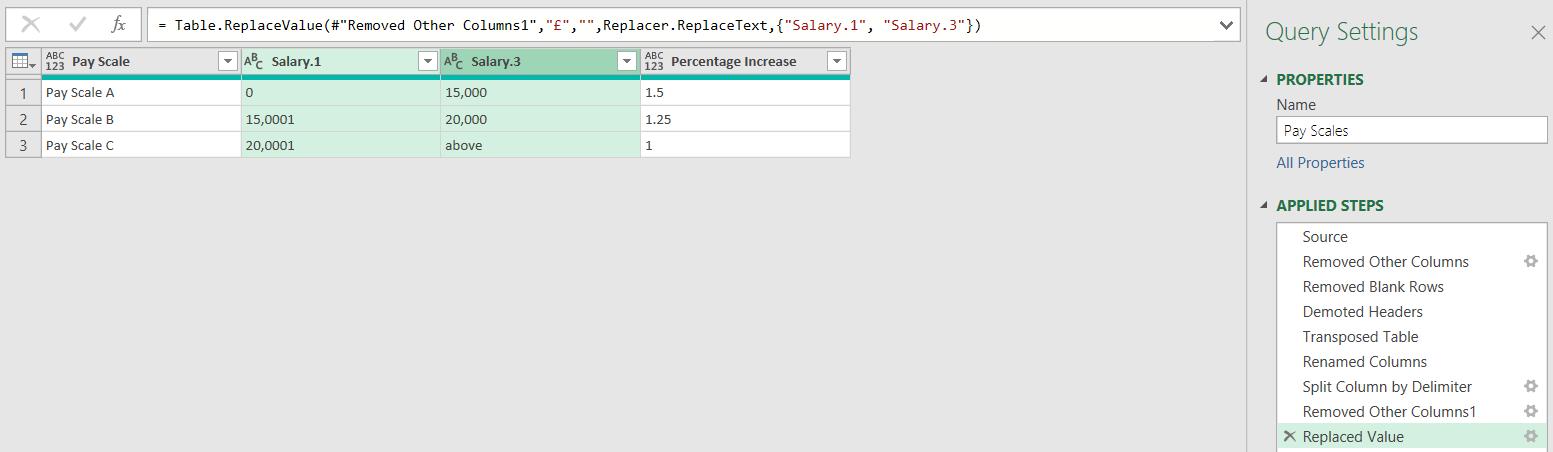
I want Salary.1 and Salary.2 to be numeric columns, so I need to remove the £ signs. I can do this by selecting the columns and replacing £ with blank. I start by using ‘Replace Values’ on the Transform tab.
This provides a dialog where I can enter the details.
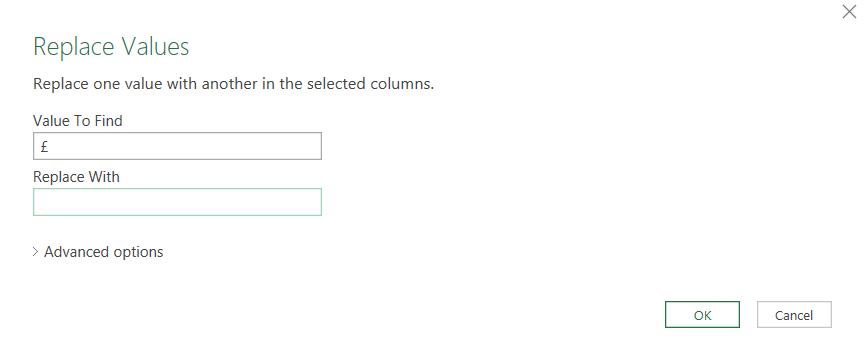
This will remove the £ signs.
Next, I change both columns to whole numbers. I can do this from the Home tab or the Transform tab, or by using the right-click menu, and changing the data type.
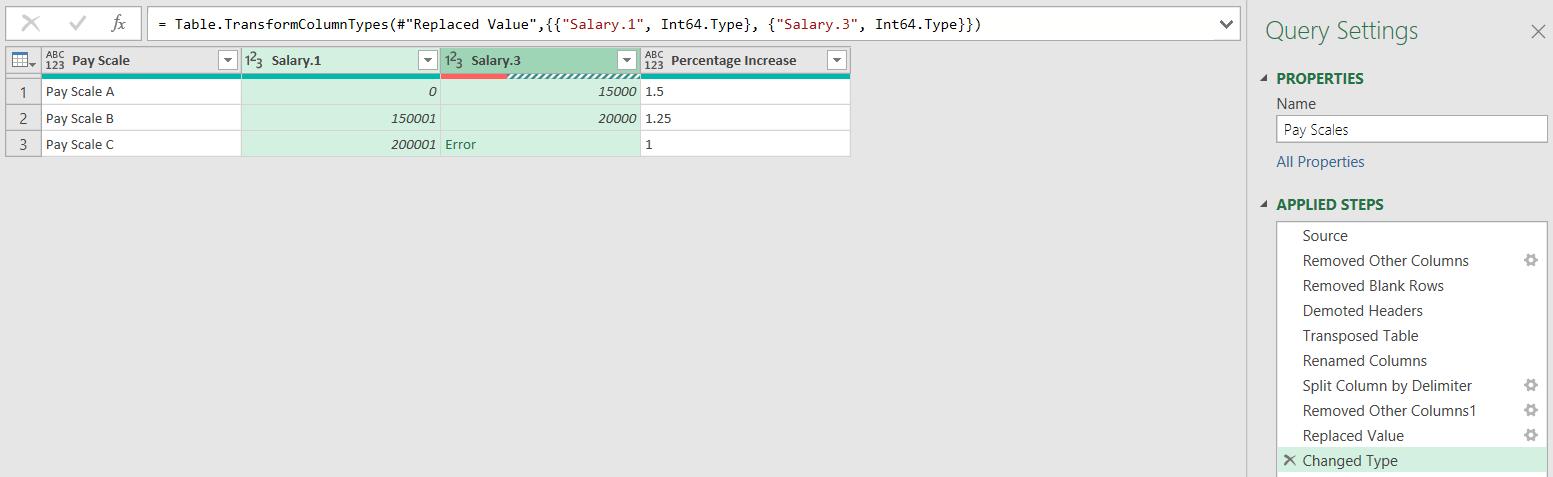
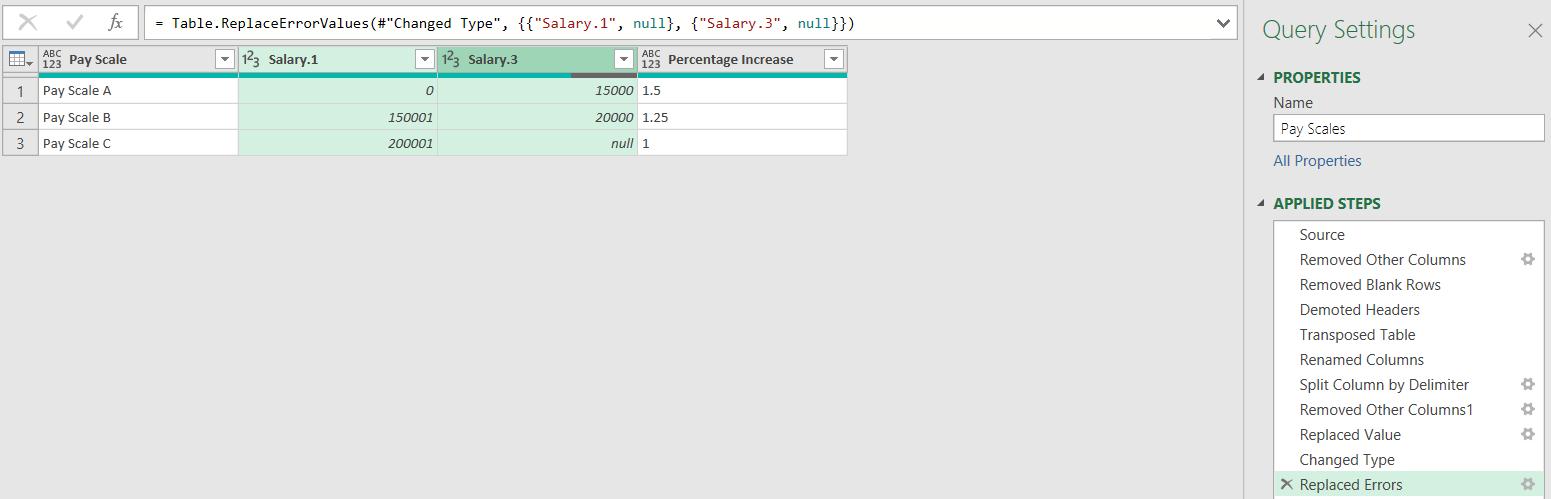
I get an error, but I can use ‘Replace Values’ again; this time, I choose ‘Replace Errors’.
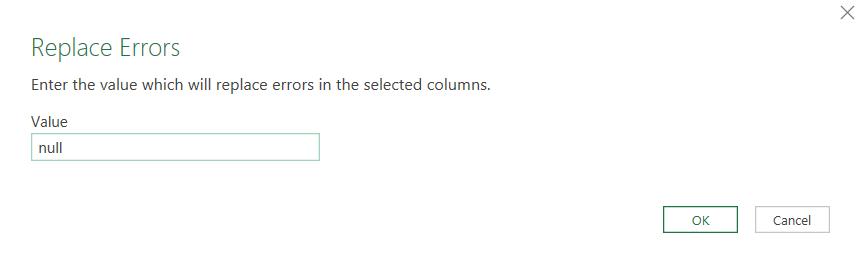
I want to replace it with null, not zero [0], since zero is the starting point for ‘Pay Scale A’.
Next, I need to transform the Percentage Increase column. If I make it the data type Percentage, I will get values of over 100: I need to divide the values by 100 first, which I can do from the Transform tab, but first I change the data type to ‘Decimal Number’. This will allow me to access the ‘Standard’ dropdown.
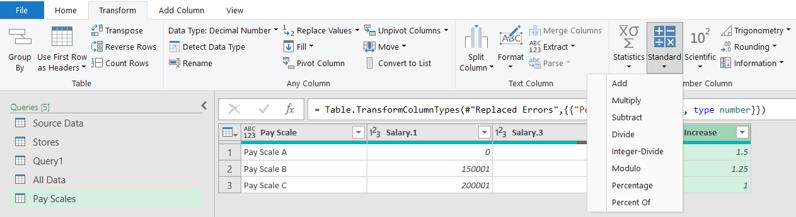
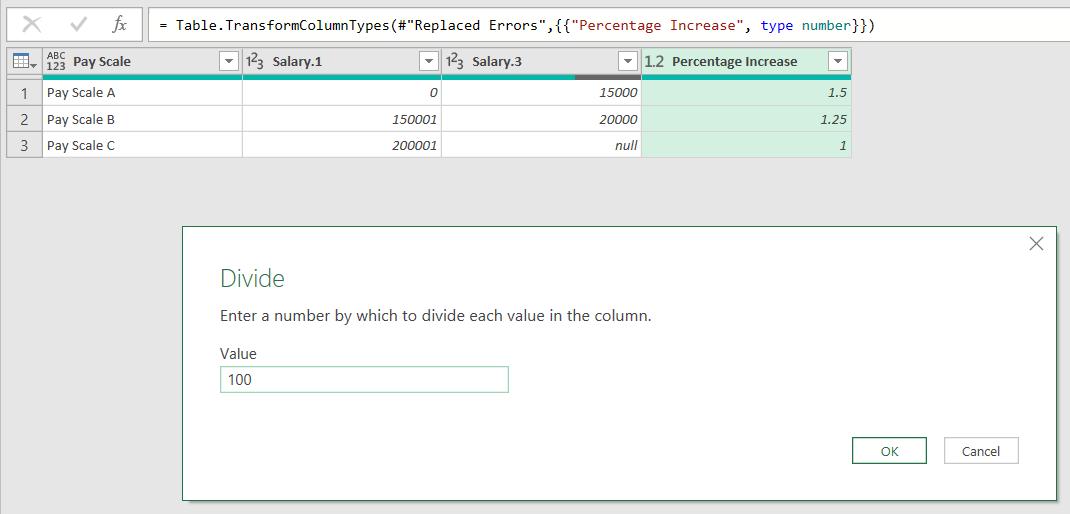
I choose ‘Divide’ and enter 100 in the dialog.
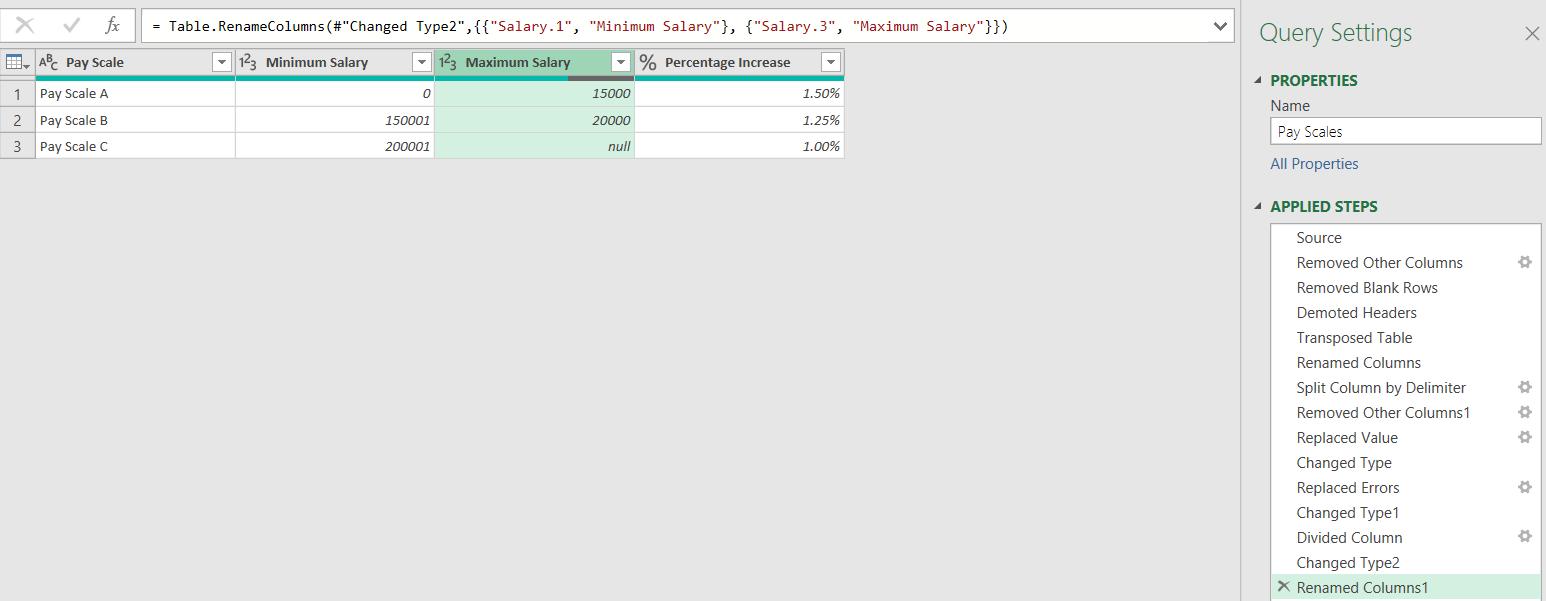
I can now set the correct data types for all of the columns.
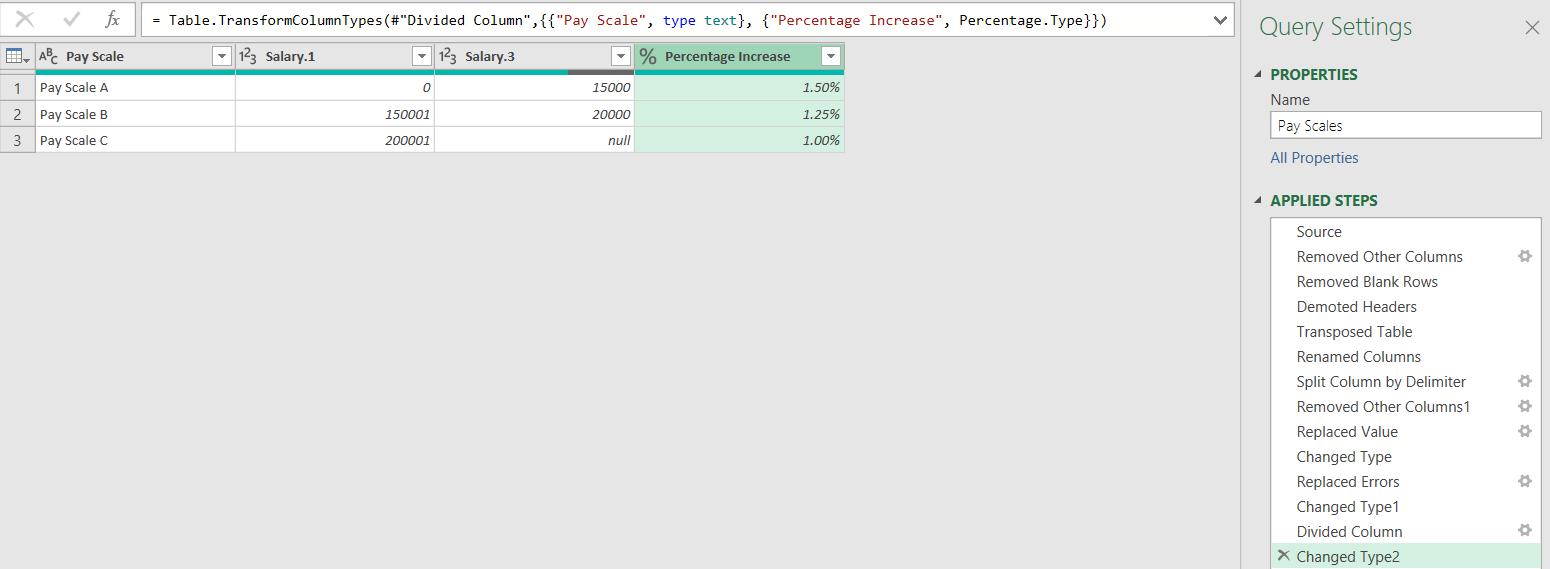
I rename the salary columns, and my table is ready to ‘Close & Load’.
Next time, I will look at the Stores query.
Come back next time for more ways to use Power Query!