
Power Query: See it, Save it, Sort it - Part 2
25 May 2022
Welcome to our Power Query blog. This week, I continue looking at a sorting issue.
Last time, I started with some data for my imaginary salespeople:
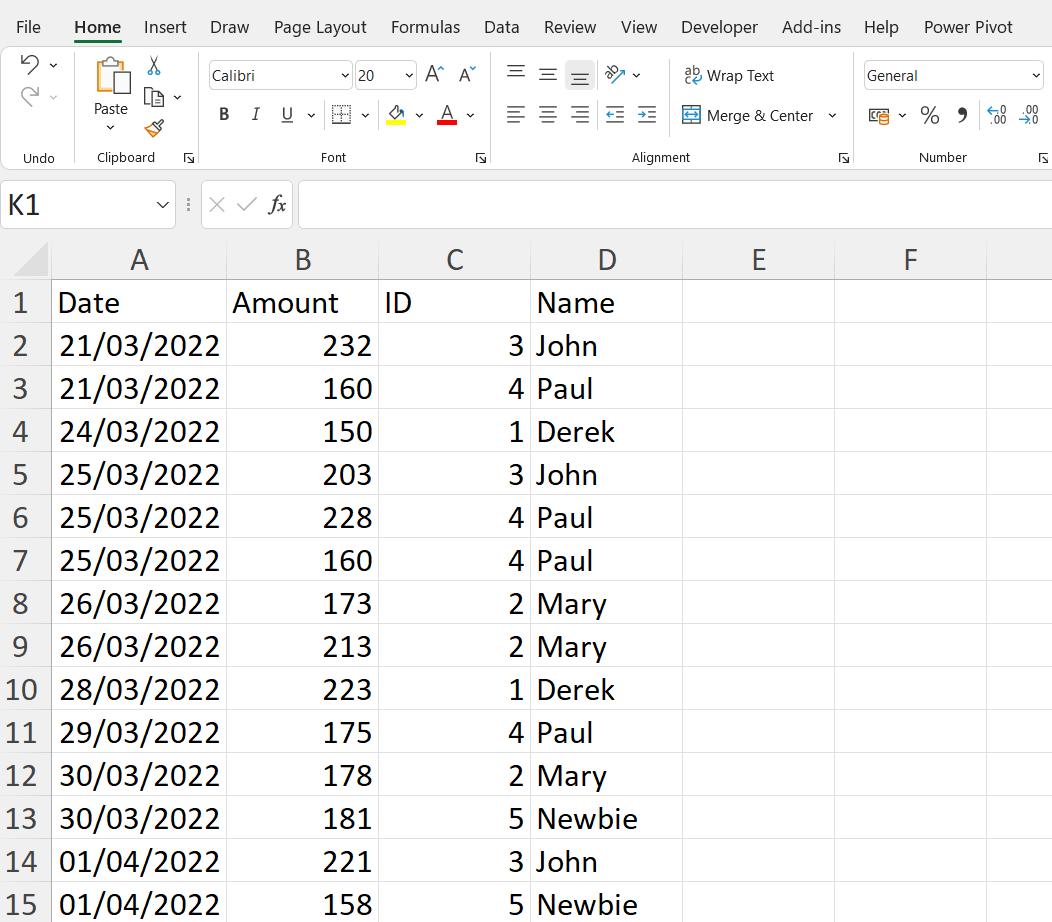
and extracted it into Power Query, in order to perform some transformations.
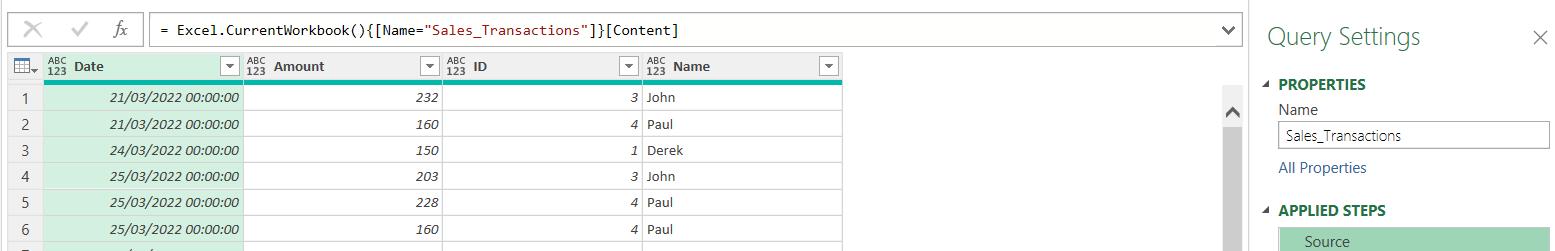
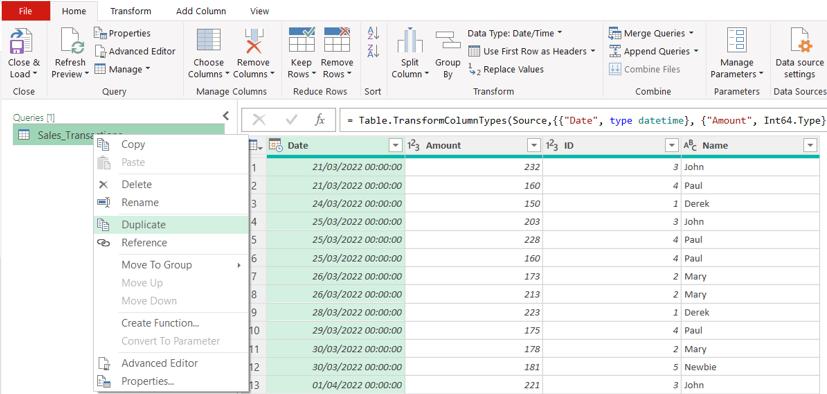
I want to ensure that I have a row for every date, as I plan to apply time intelligence calculations to my data. To do this, I am going to create a list of all dates that I can append to my data. To find the range of dates I need, I start by right-clicking on Sales_Transactions in the Queries pane, and then I choose to make a Duplicate query. As the new query is copied from, but not linked to Sales_Transactions, any new dates will be picked up, but if I add steps to Sales_Transactions, they will not be picked up by the new query.
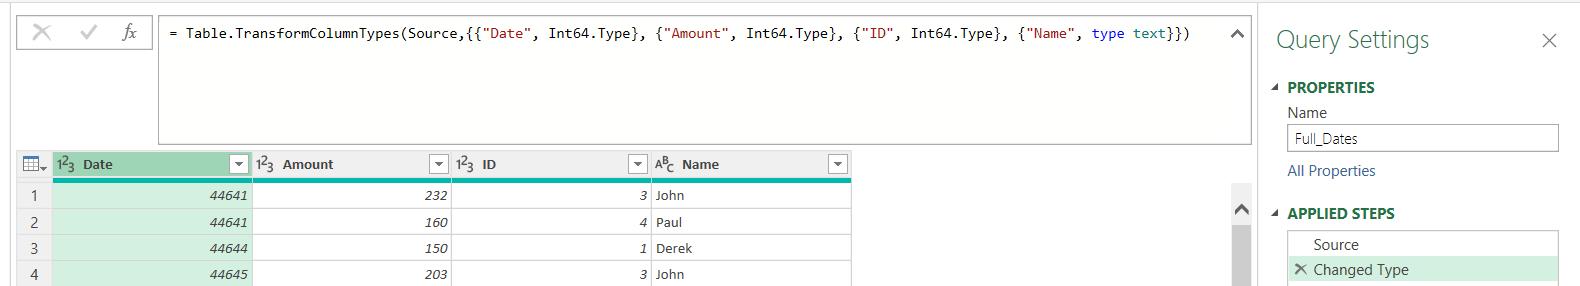
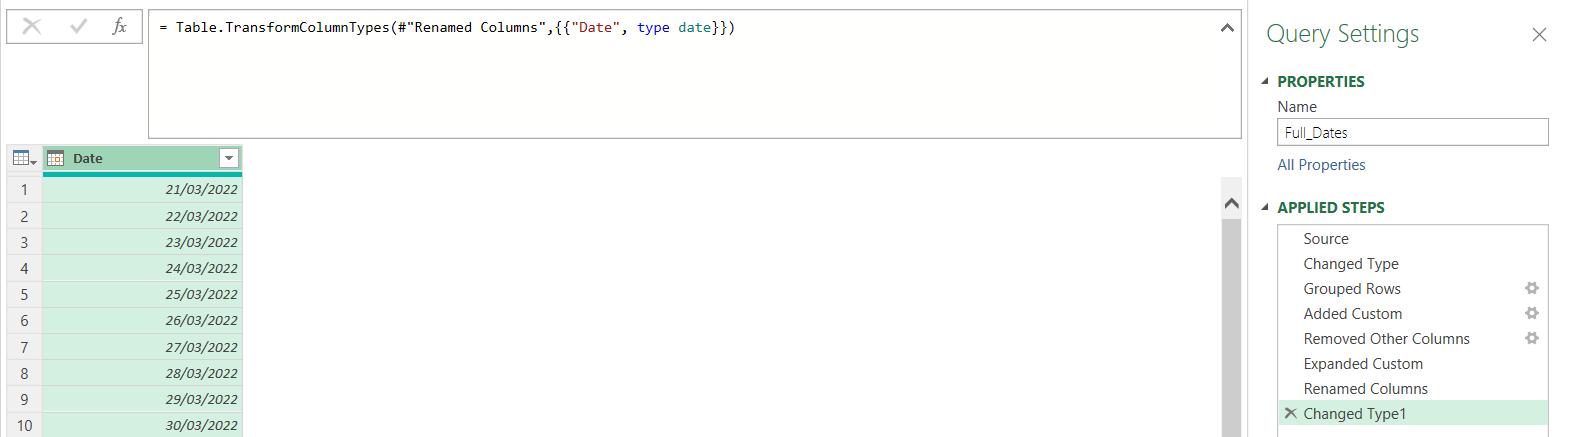
I call my new query Full_Dates:
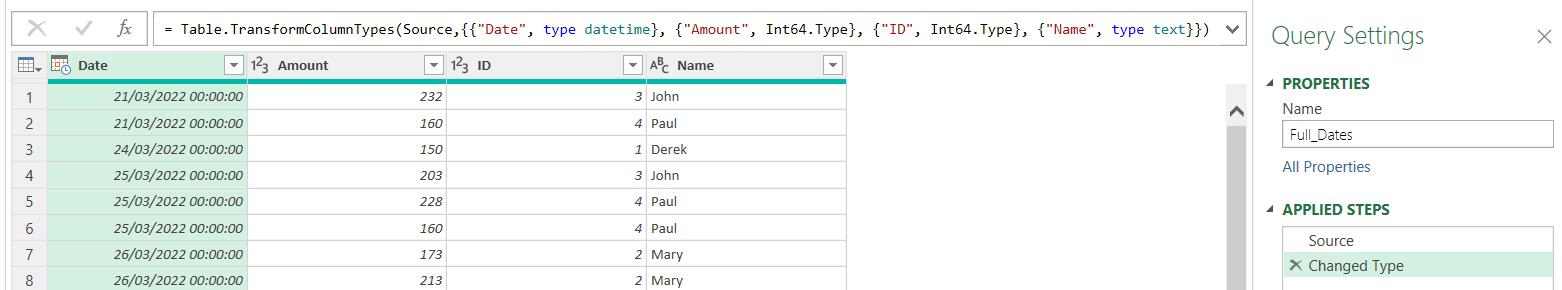
Power Query has generated a ‘Changed Type’ step based on algorithms that sample the data.
= Table.TransformColumnTypes(Source,{{"Date", type datetime}, {"Amount", Int64.Type}, {"ID", Int64.Type}, {"Name", type text}})
Although Date does indeed contain dates, I want to use the data type ‘Whole Number’. I plan to create a list, and lists currently work with numbers, but not dates.
I could either change the M code is this step, or I can get Power Query to do it for me by using the dropdown under the data type icon:
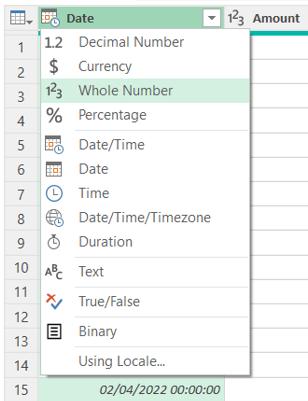
When I choose ‘Whole Number’ , Power Query recognises that this would be another ‘Changed Type’ step, so it offers to combine them:
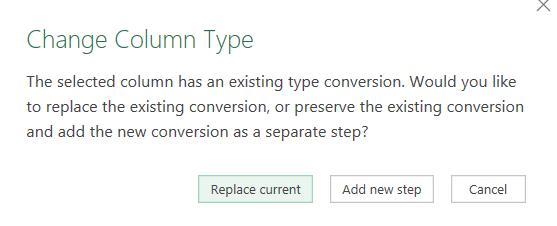
This is exactly what I want, so I choose to ‘Replace current’:
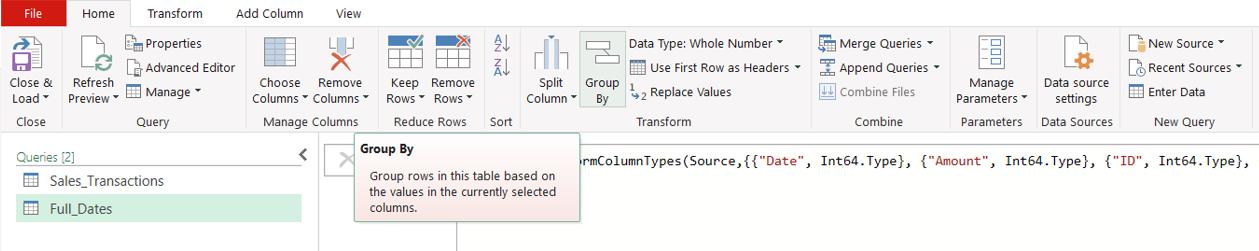
Date is now shown as a ‘Whole Number’. To find the maximum and minimum date, I can use the ‘Group By’ functionality which is on the Transform tab and the Home tab:
This opens a dialog. I need to choose the ‘Advanced’ option, and I need to remove the grouping on date by clicking on the ellipsis (…) and deleting it.
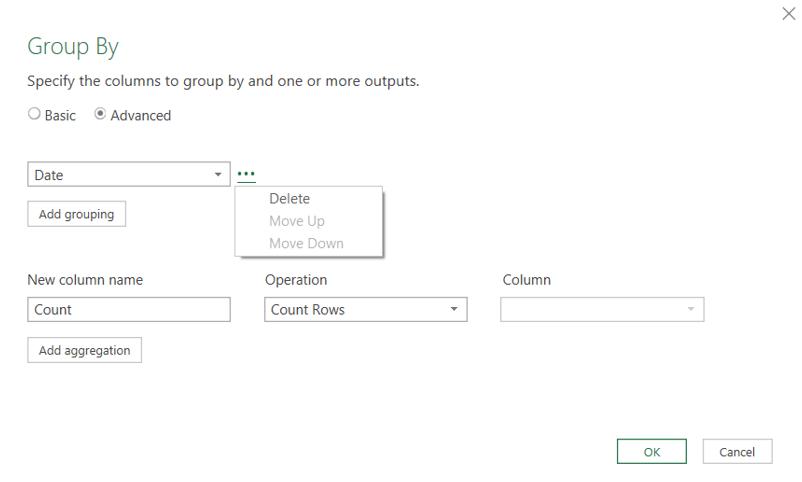
I add two [2] aggregations:
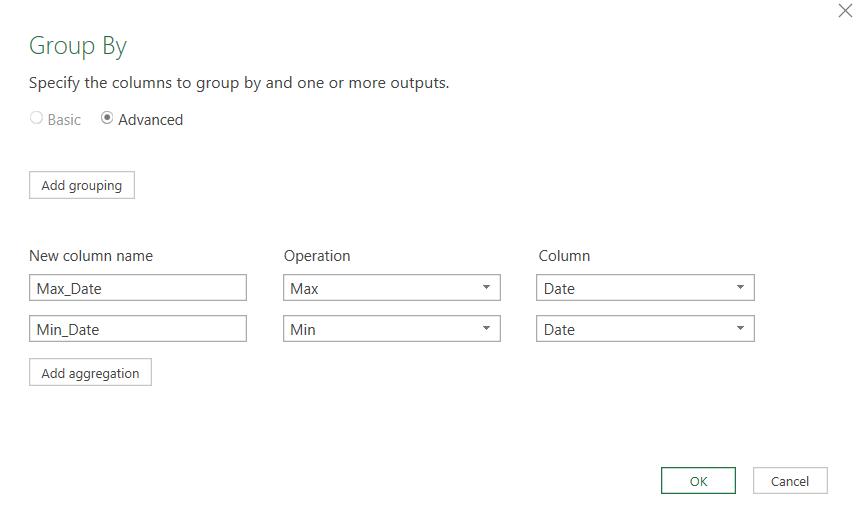
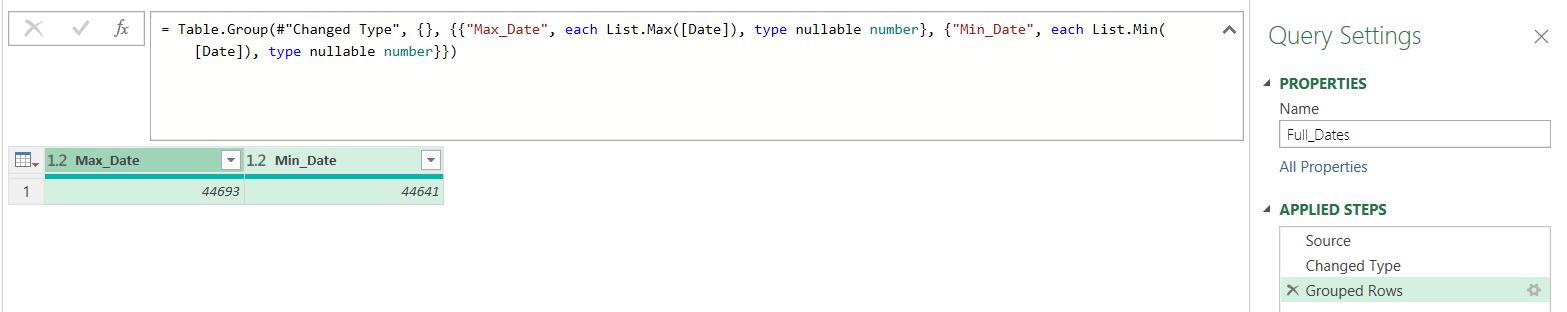
Clicking OK gives me the values I need to create a list of dates:
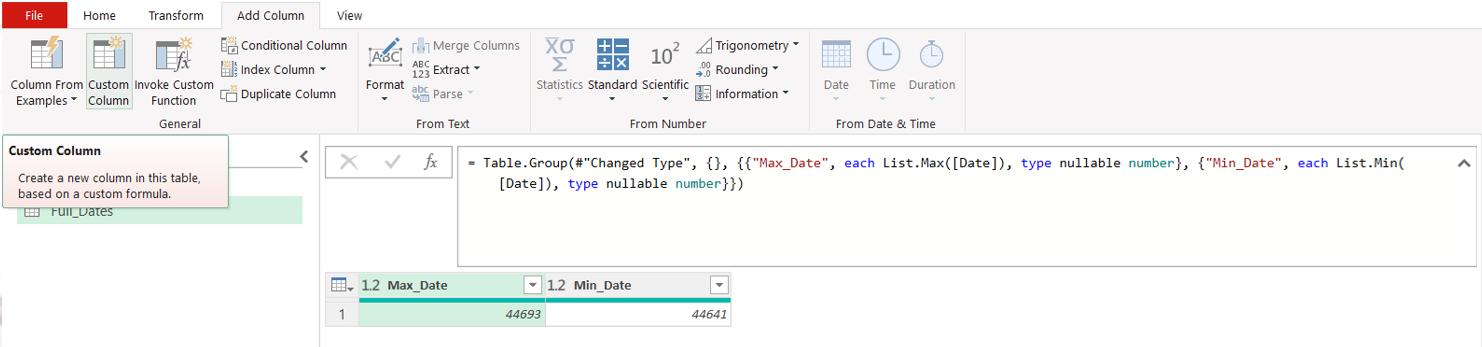
Now I can enter the M code to create the list of dates; to do this, I add a ‘Custom Column’ from the ‘Add Column’ tab:
In the dialog, I create a list from the columns:
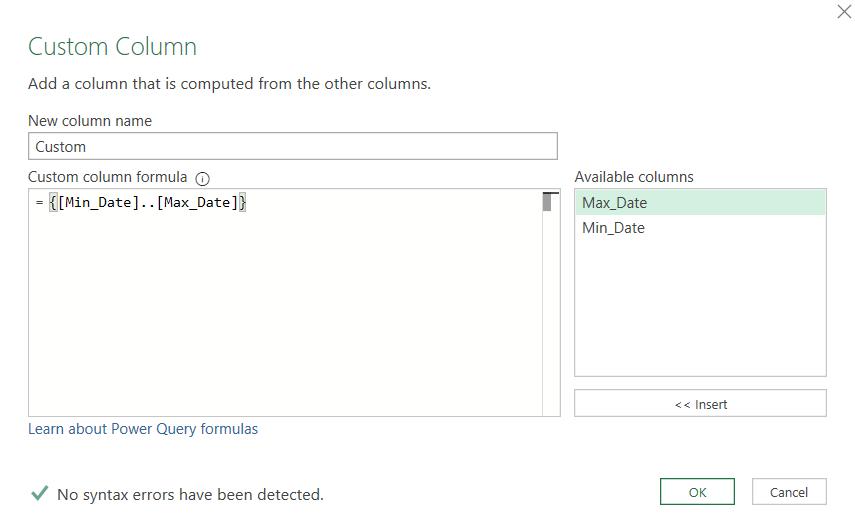
The M code is:
= {[Min_Date]..[Max_Date]}
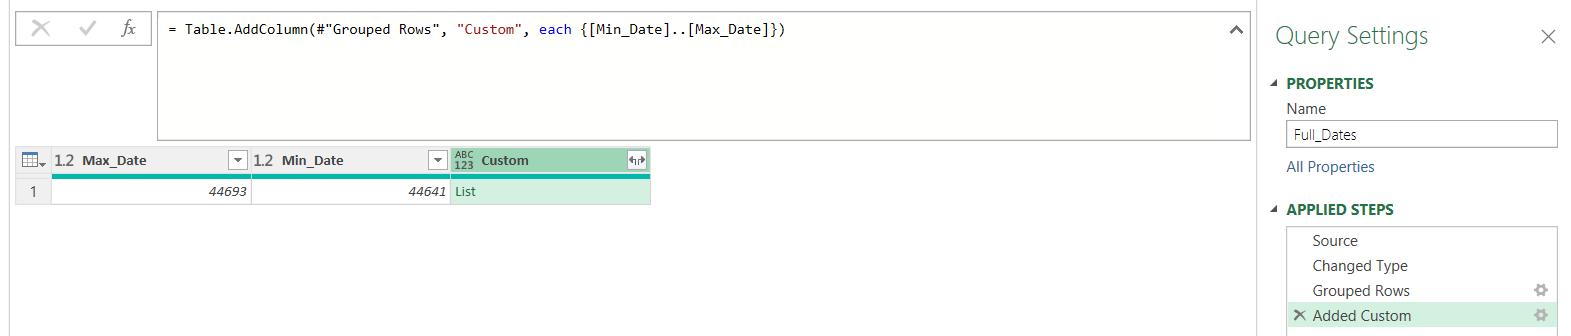
This gives me a column with a List in it, which will start from [Min Date] and end at [Max Date] and contain every number in between.
I right-click on Custom and ‘Remove Other Columns’. I can then click on the expand icon to extract the List values:
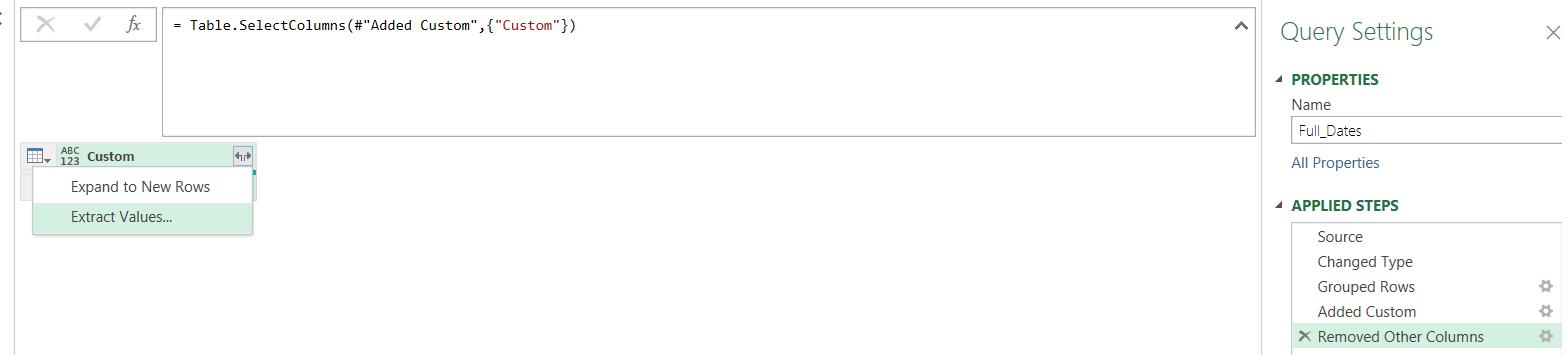
I can ‘Expand to New Rows’ as I want a column containing all the dates:
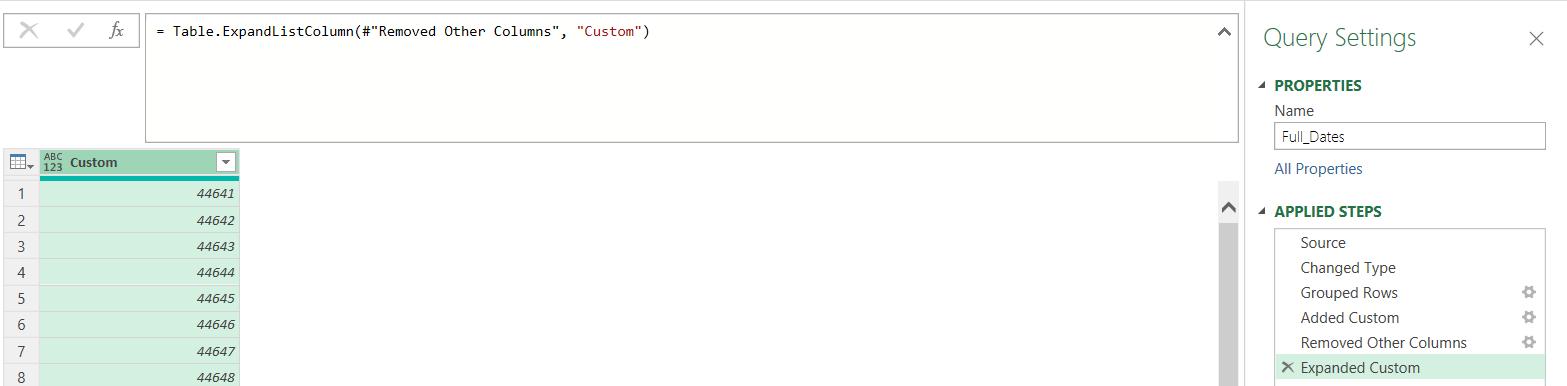
I rename my column Date and change the data type to ‘Date’ using the dropdown from the data type icon. Full_Dates is now ready to use:
Next time, I will append this to my original query.
Come back next time for more ways to use Power Query!