
Power Query: Top Tied
2 October 2019
Welcome to our Power Query blog. Today, I look at how to rank tied places.
The figures have come in for my imaginary salespeople:
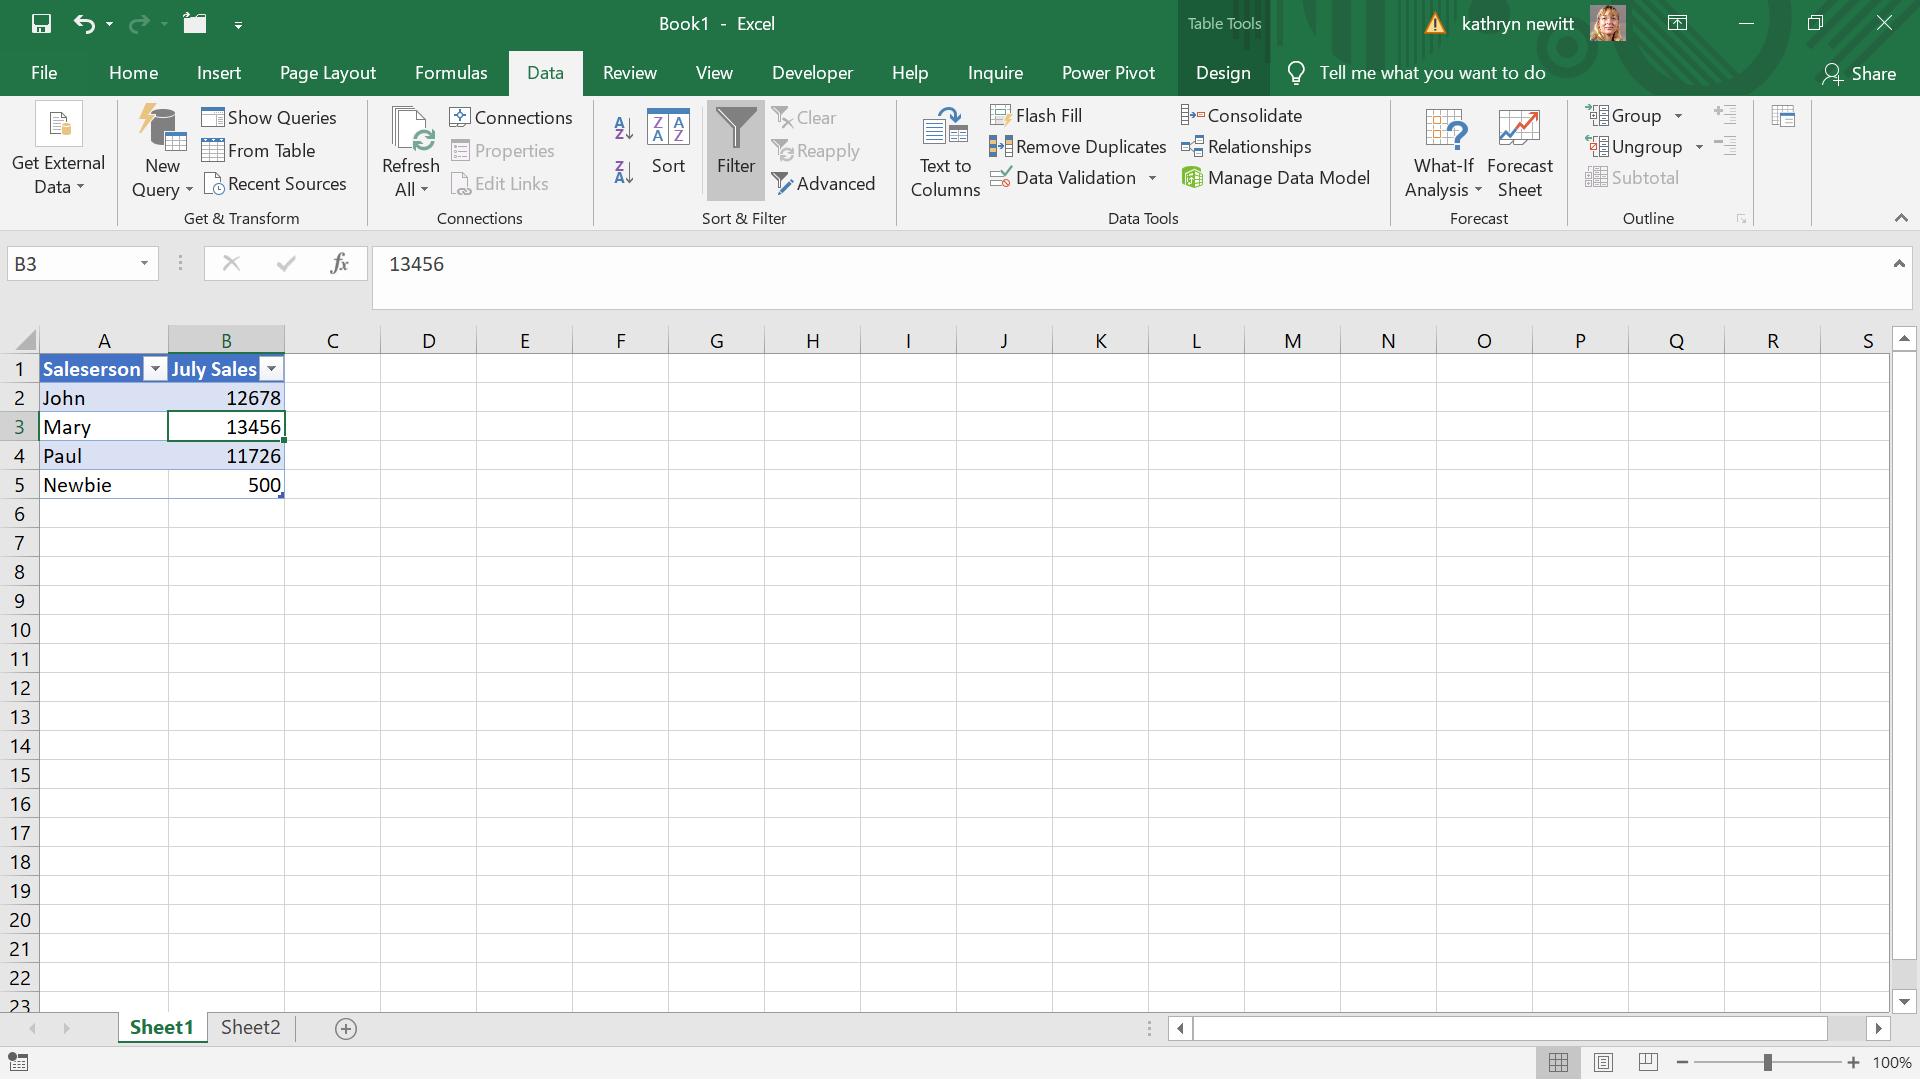
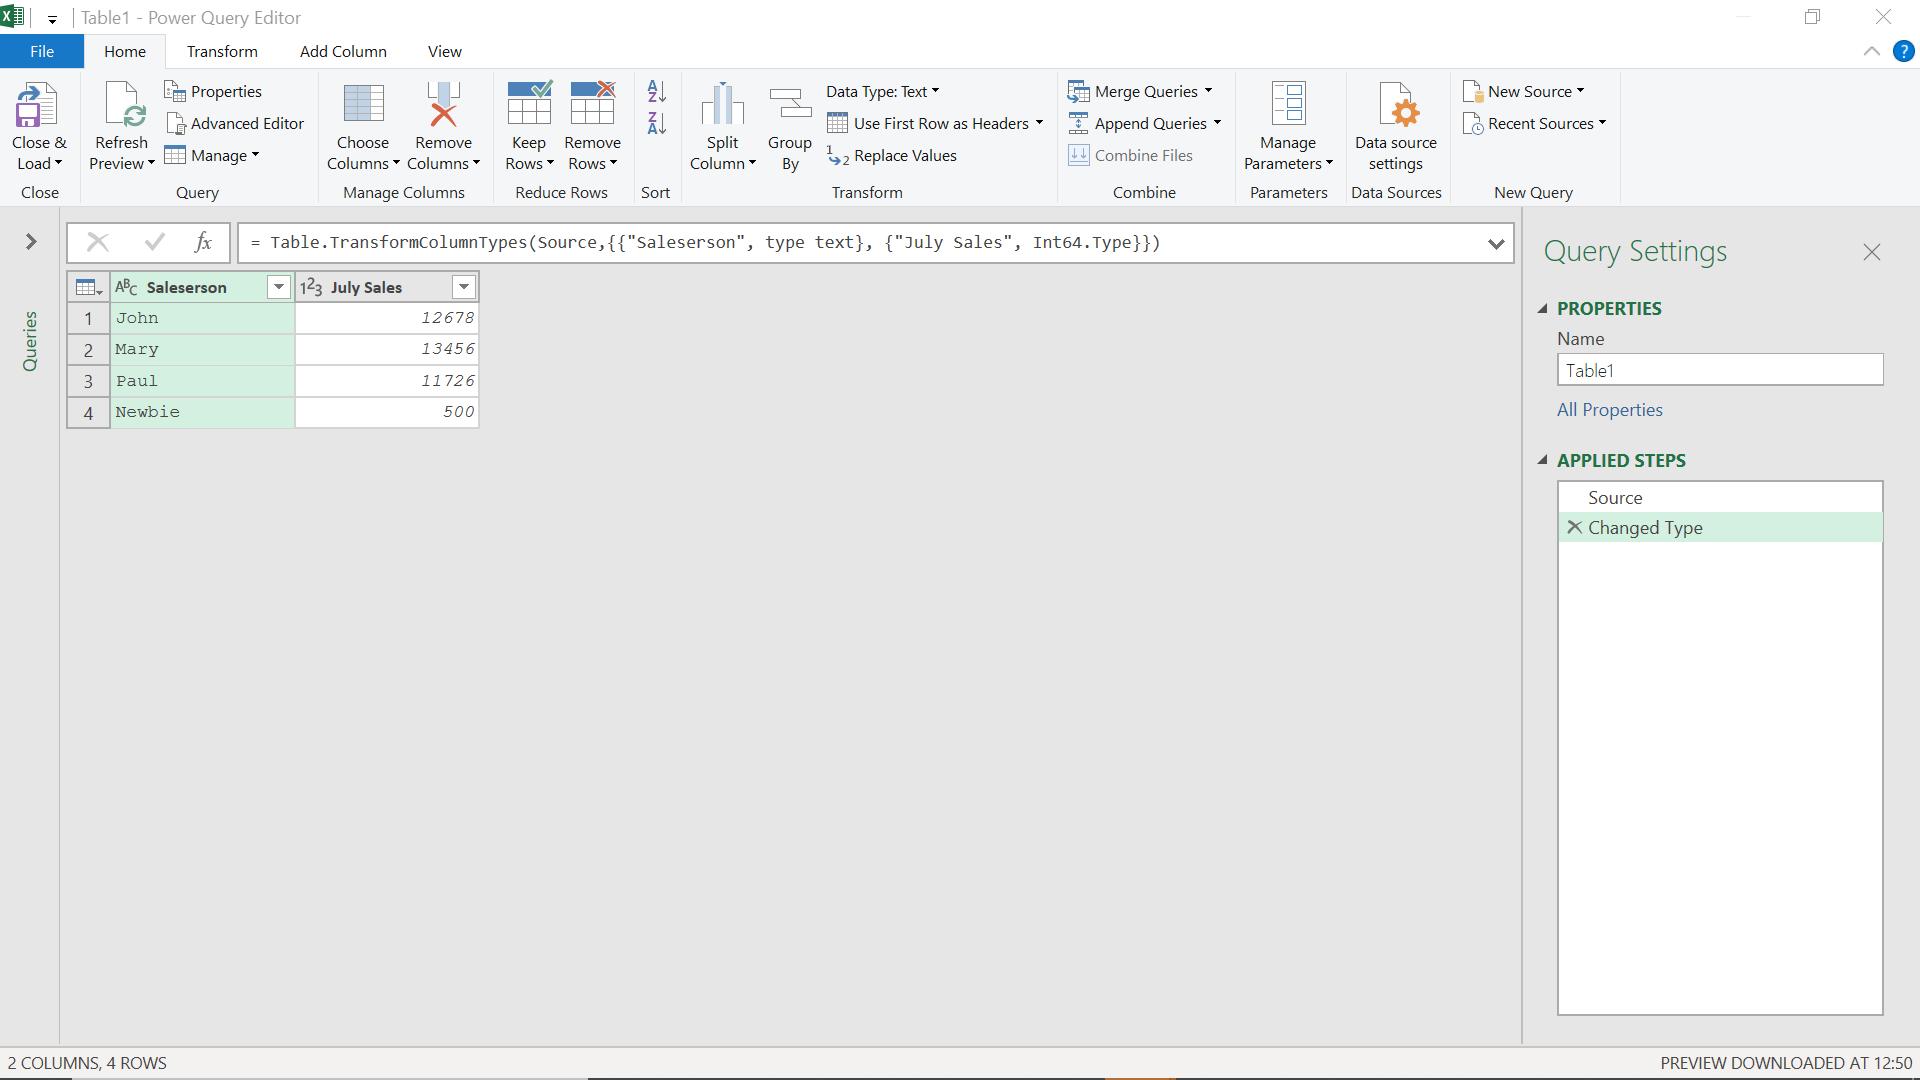
Since the top salesperson gets a bonus, I want to indicate clearly who is top. This principle can be expanded to include as many places as I like. I pull my data into Power Query using ‘From Table’ from the ‘Get & Transform’ section of the ‘Data’ tab.
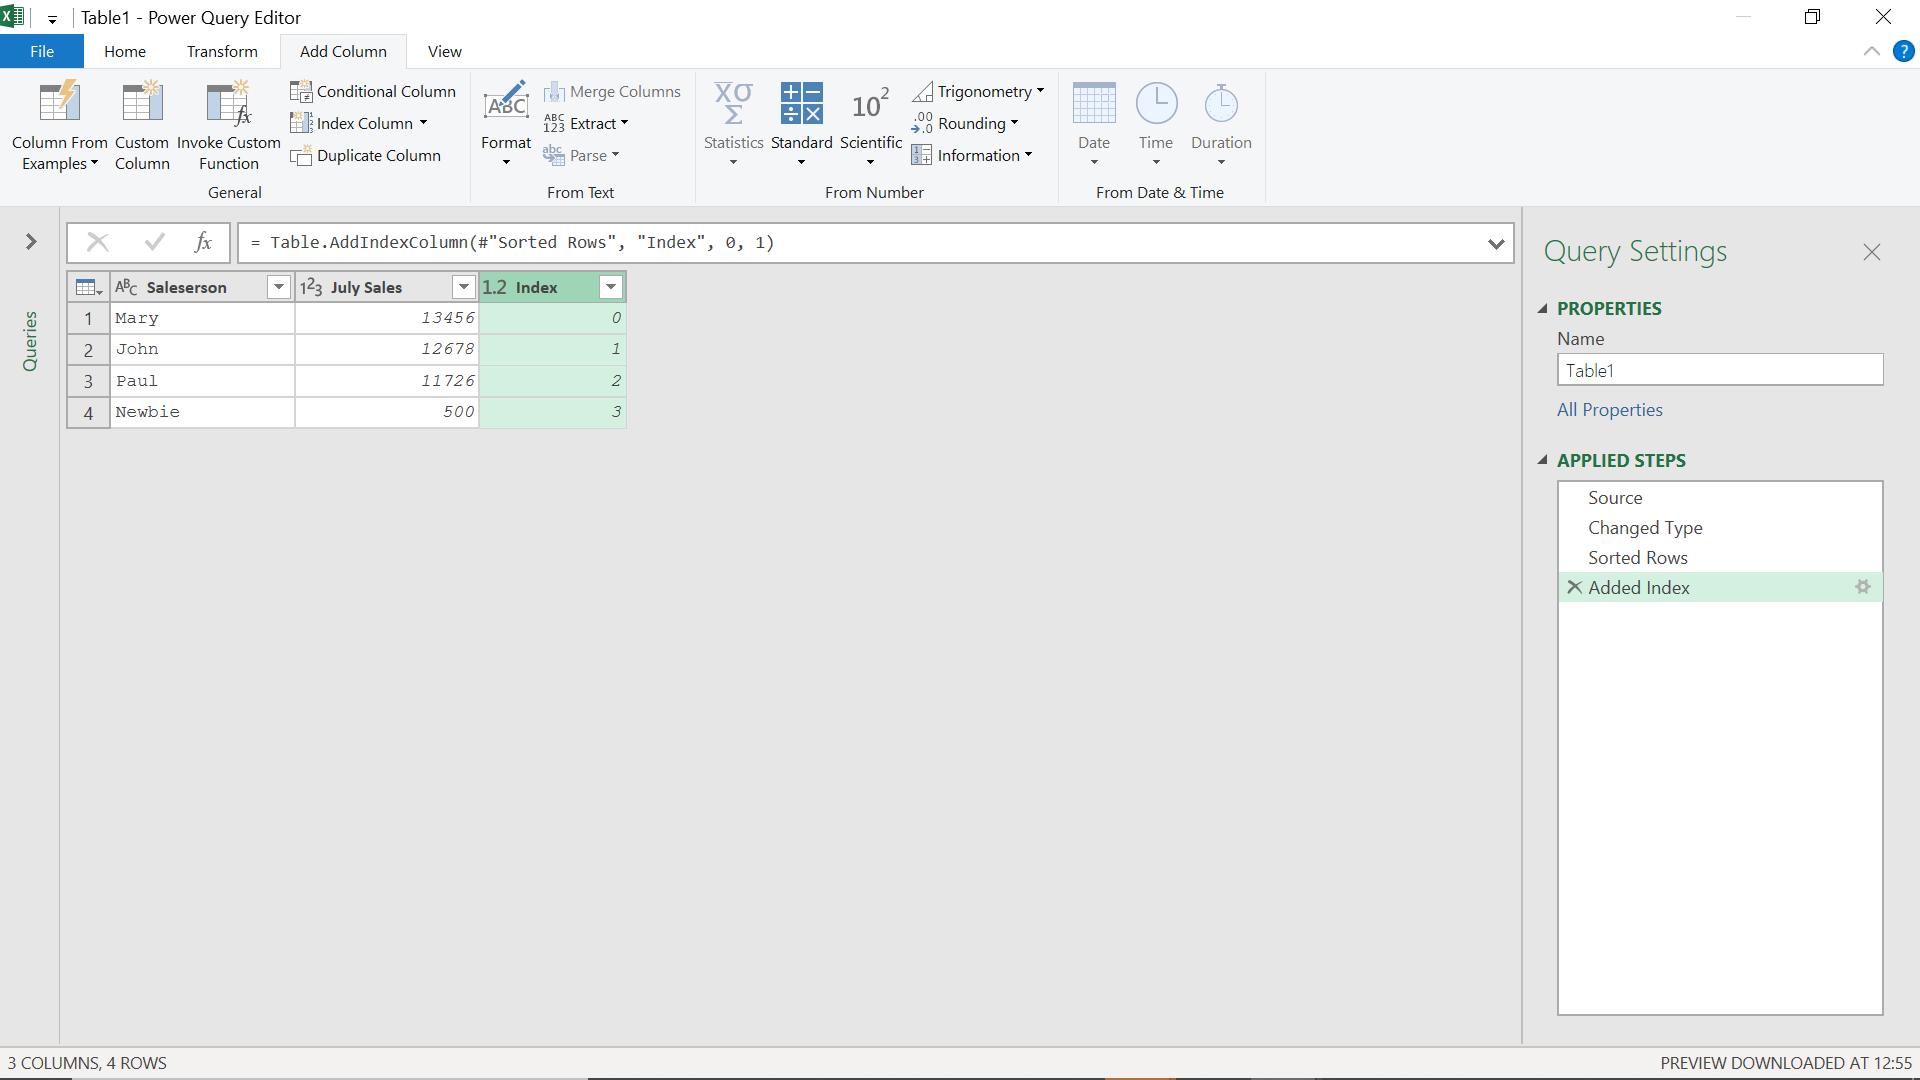
I sort my data by July Sales using the arrow next to the column name. I then choose to add an index column from the ‘Add Column’ tab (starting at zero).
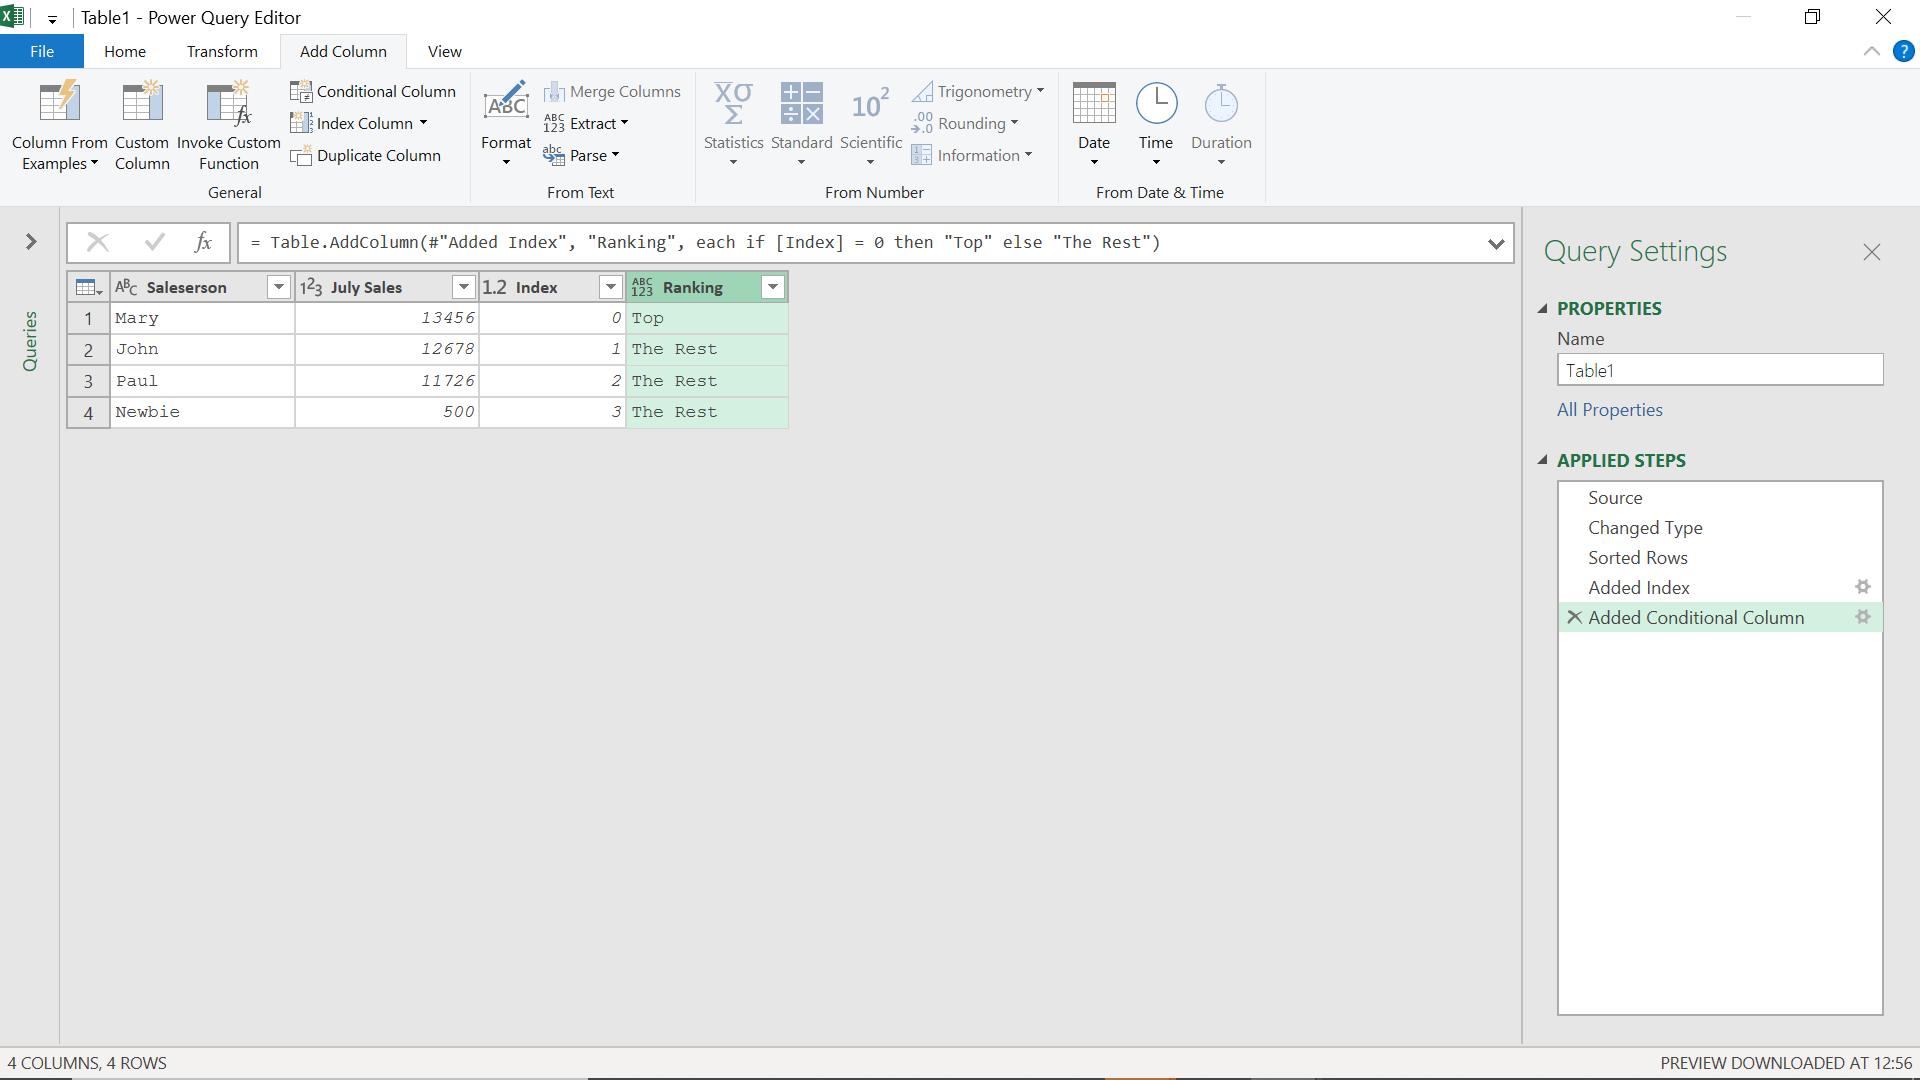
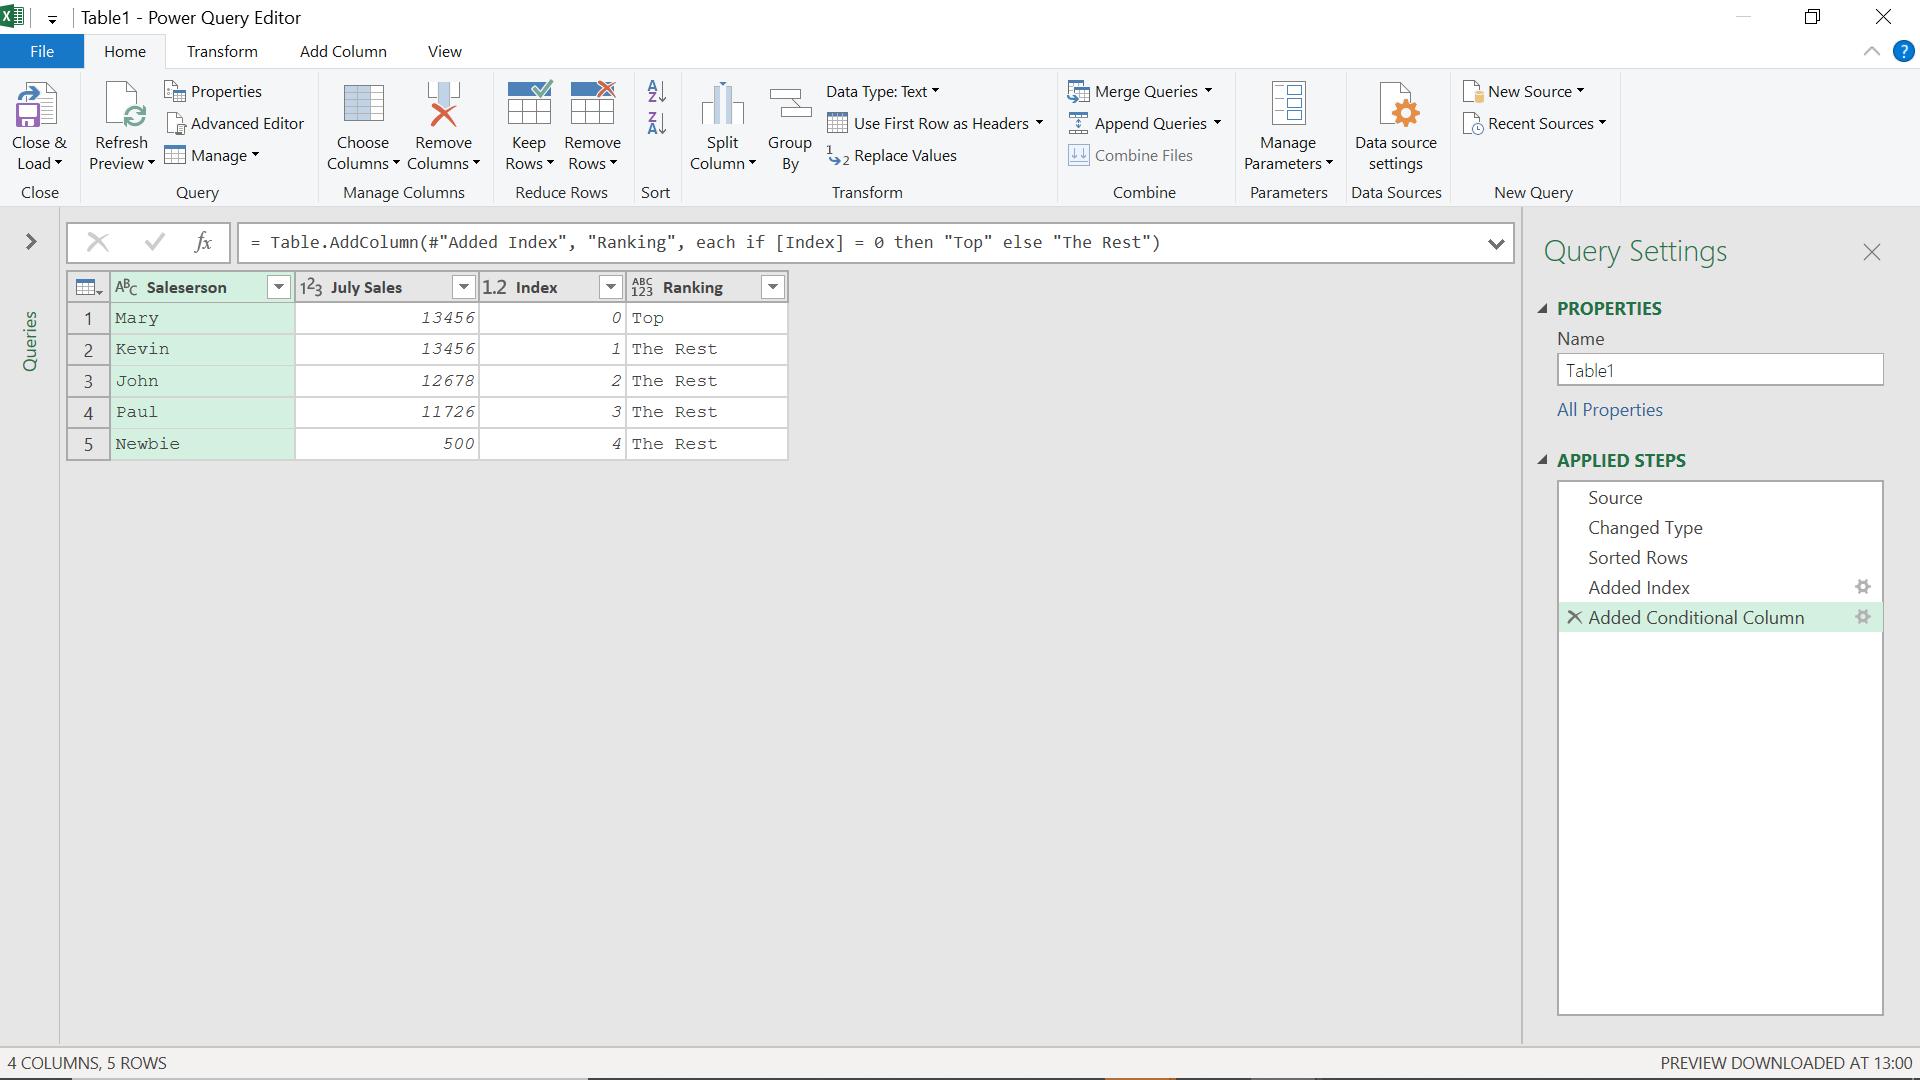
I can now create a custom column, which will allocate the top place if Index is 0.
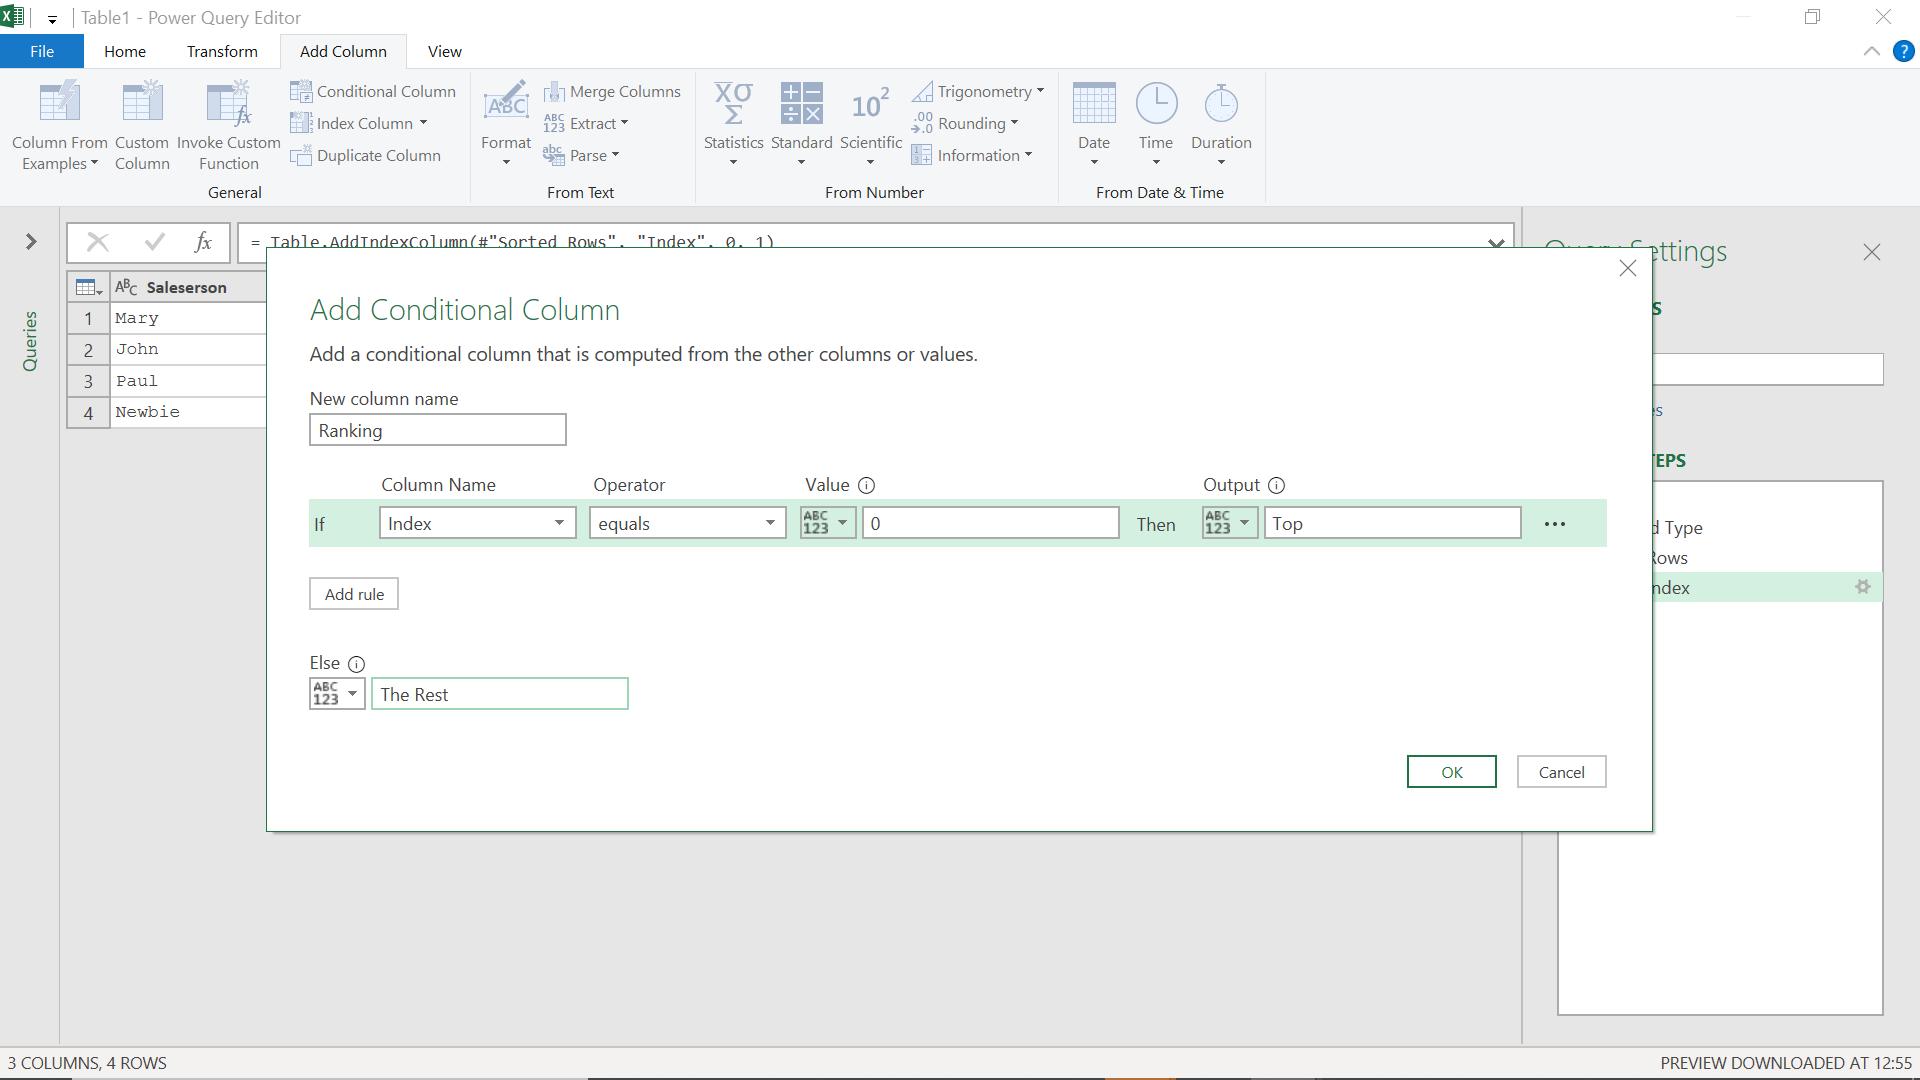
I click OK, and I can see the top salesperson, Mary.
I ‘Close & Load’ this to Excel from the ‘Home’ tab.
However, I have some late results, so I need to go back to my source data.
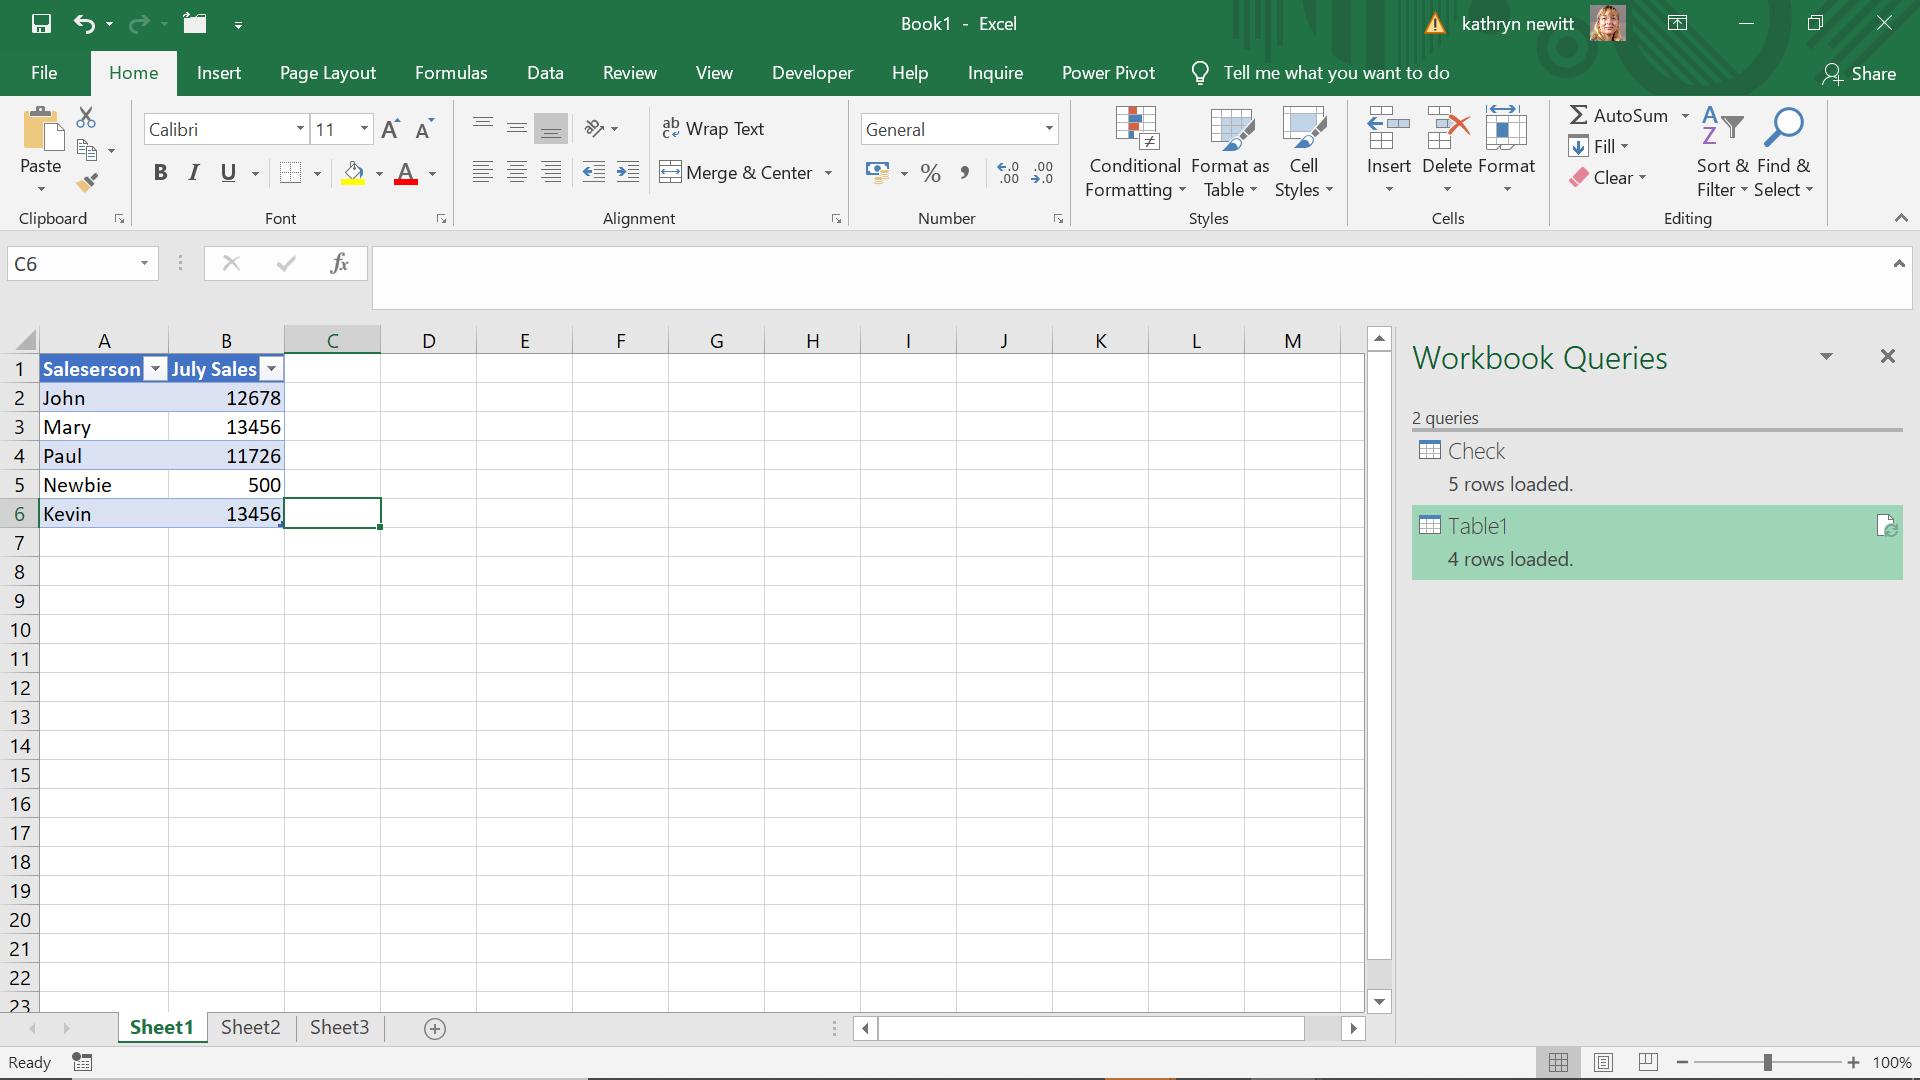
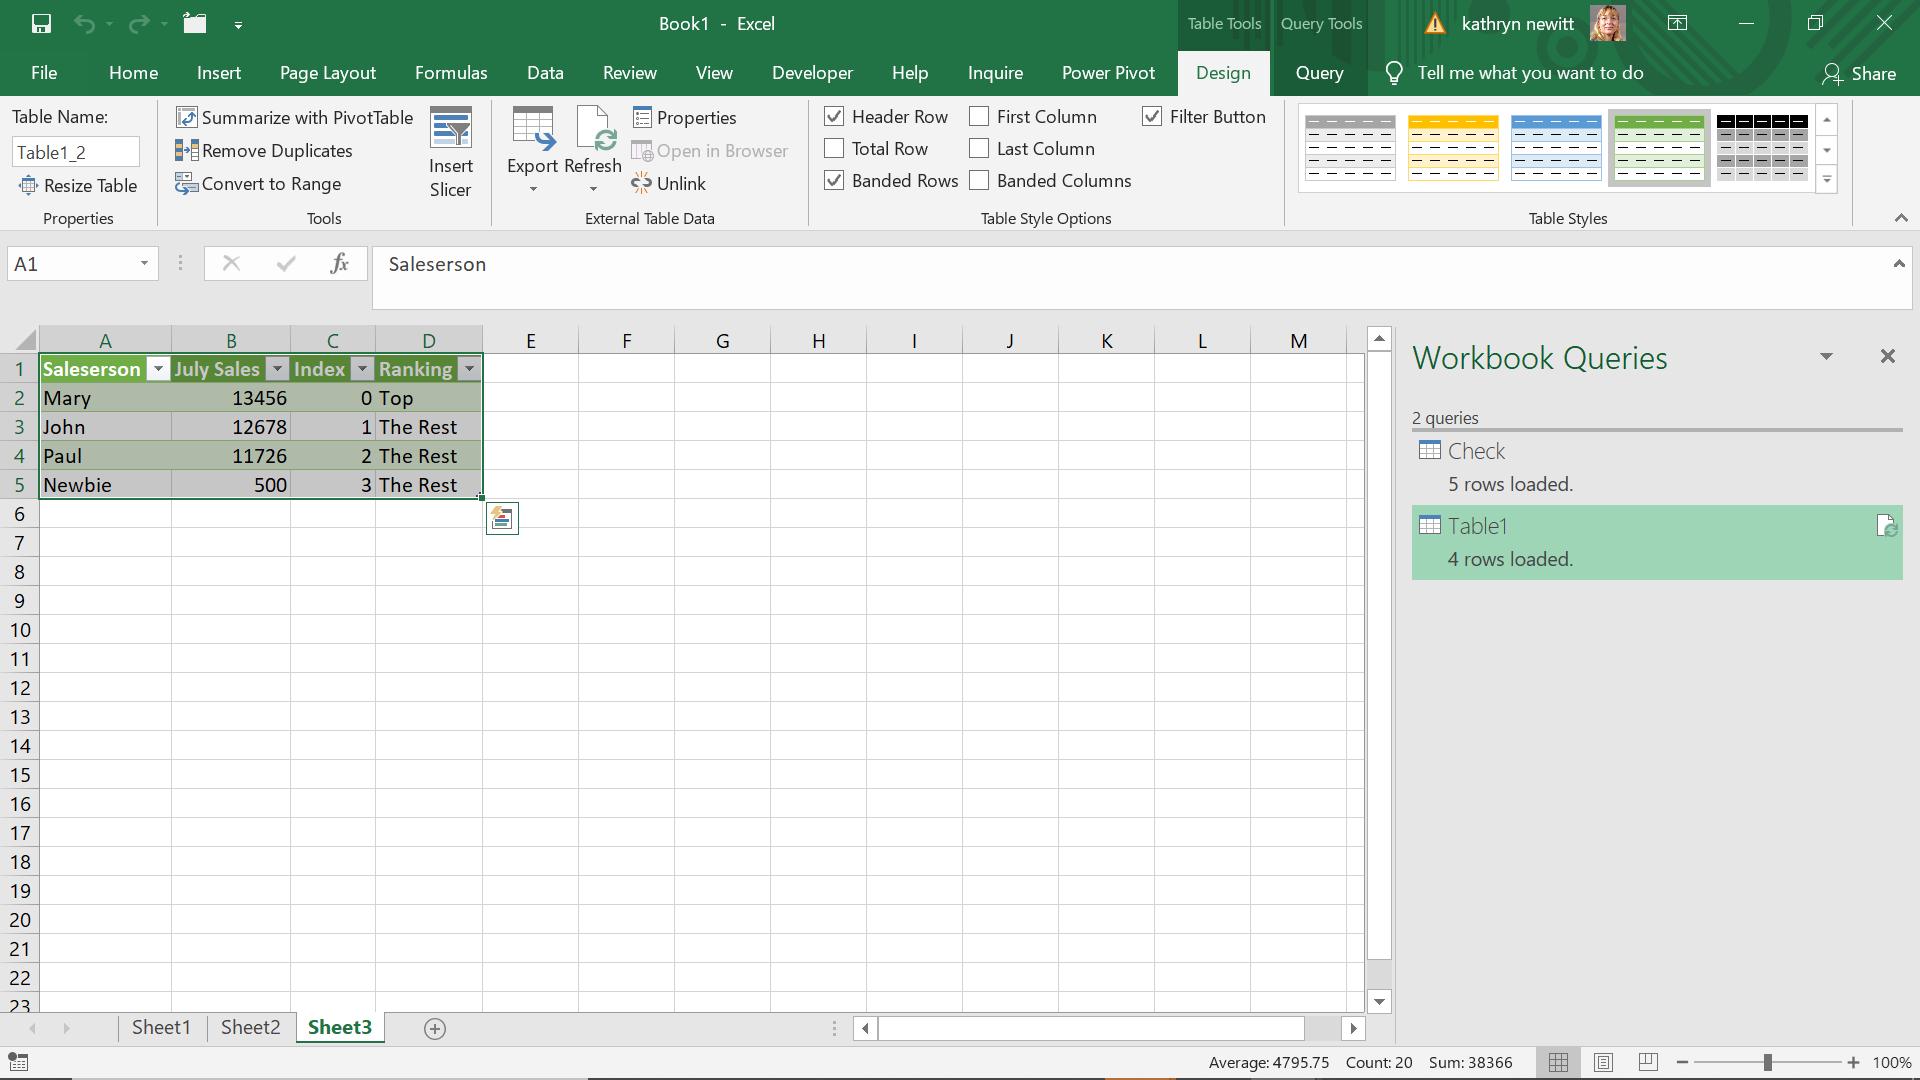
Kevin’s results have been added, so I check the results of my query.
Well that doesn’t seem fair: Kevin has not reached the bonus category. I need to amend my query.
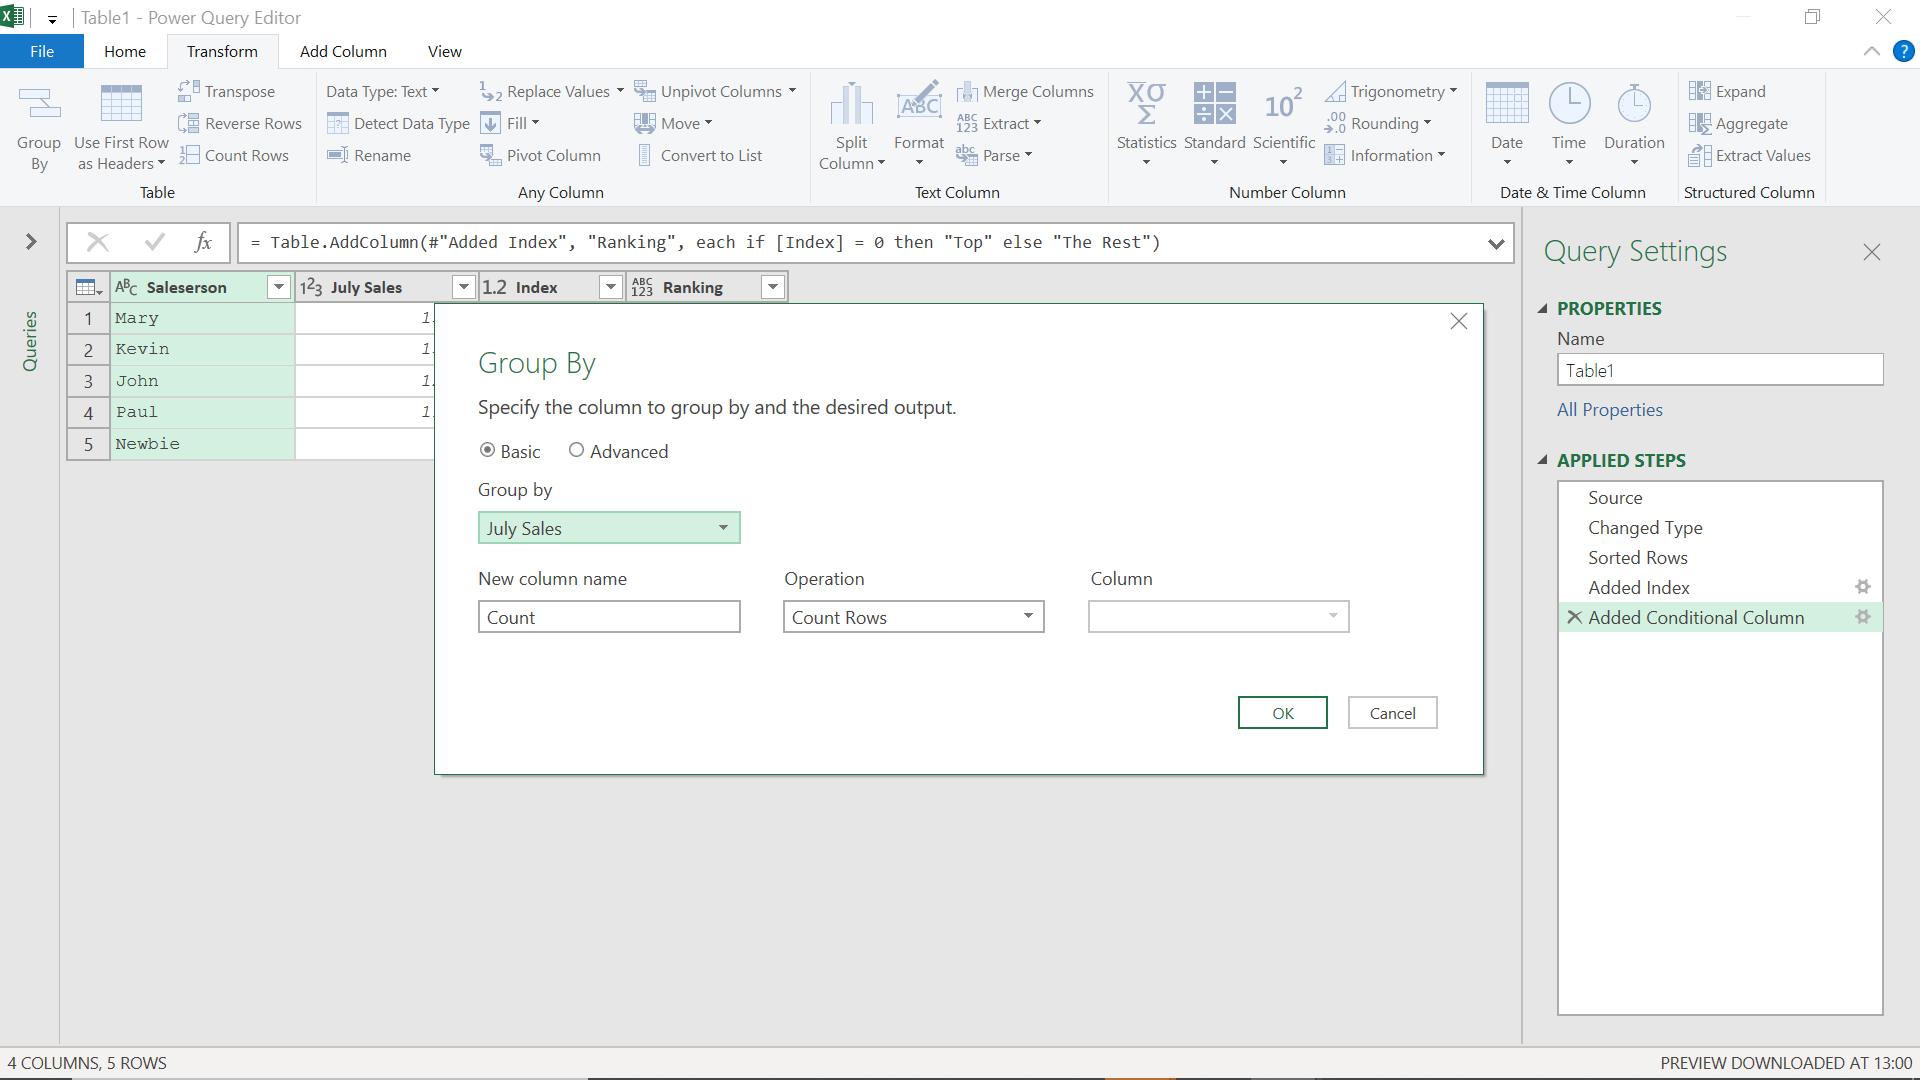
Since the index is incremented for each salesperson, Kevin is not getting the correct ranking. I need to group by July Sales. I can do this using ‘Group By’ on the ‘Transform’ tab.
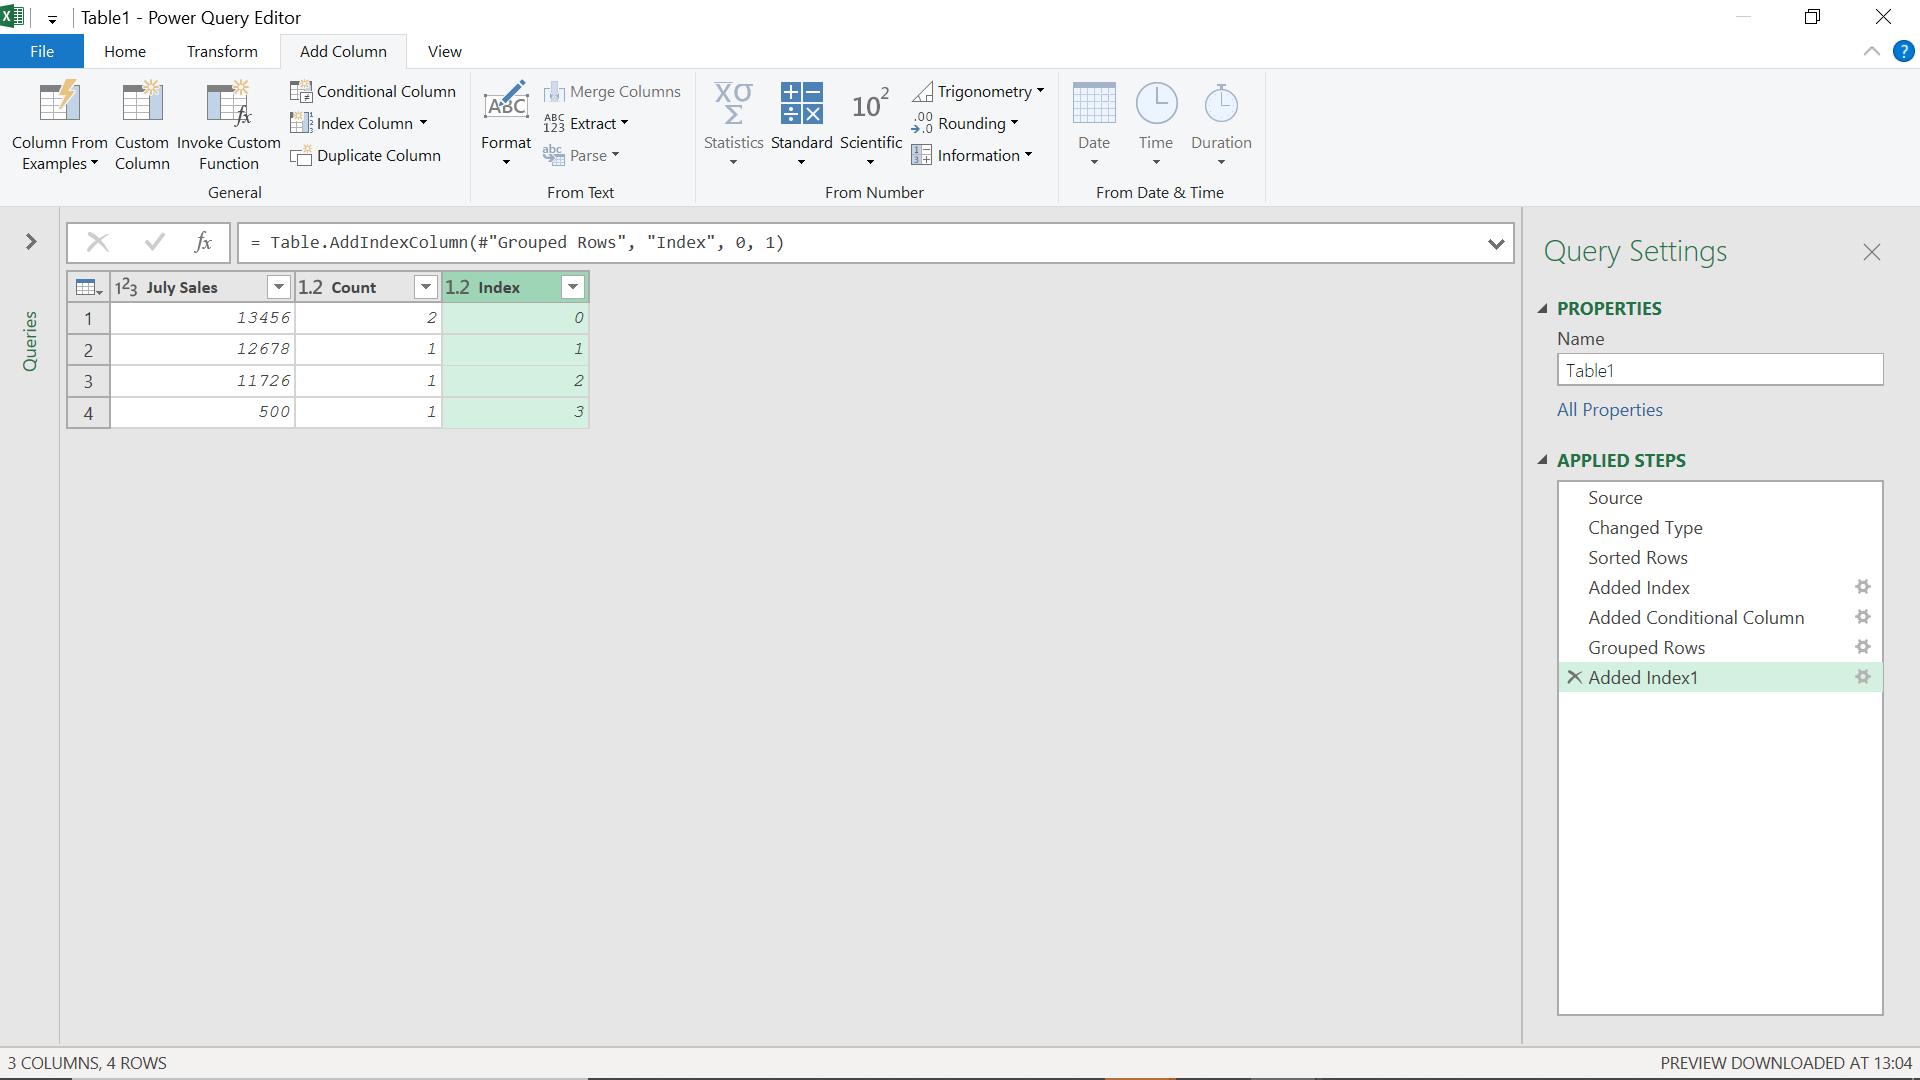
I also add a new index column.
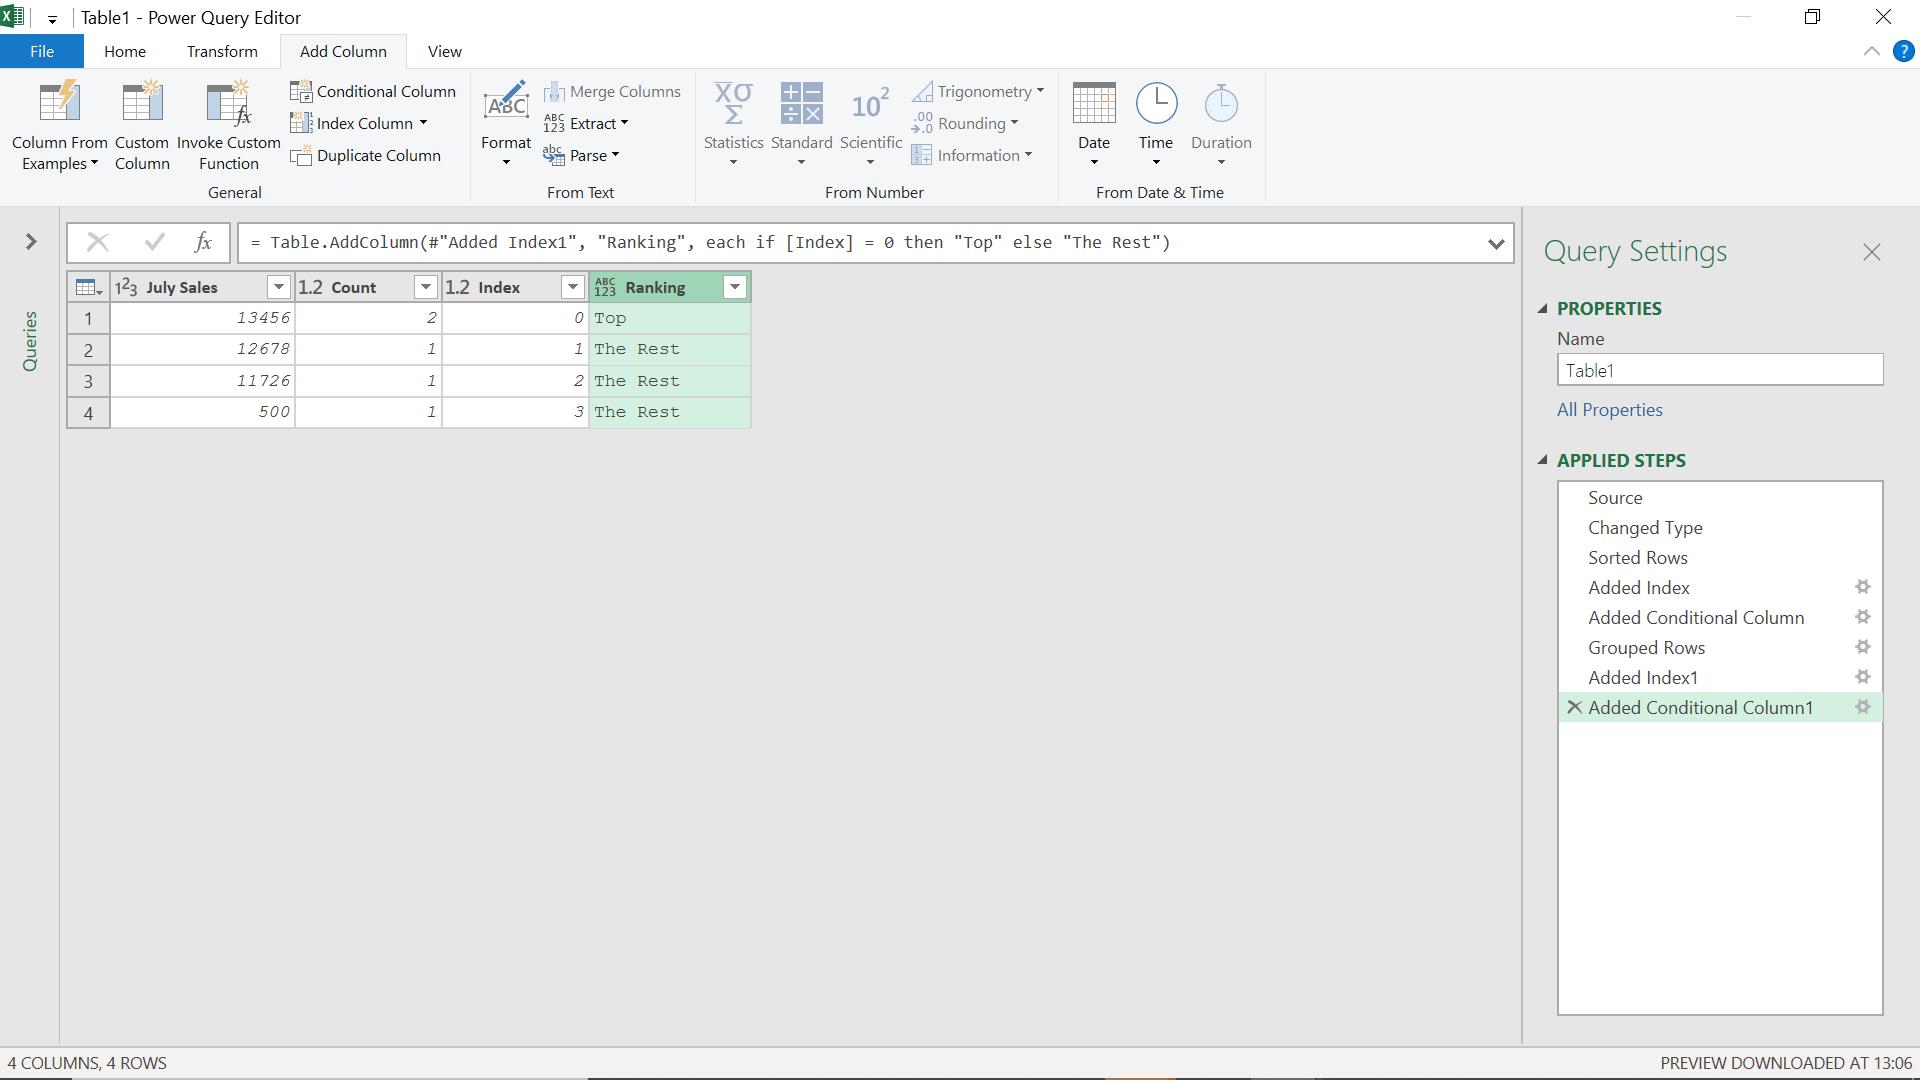
I can now add a new conditional column which will indicate top ranking.
I need to link this back to my salespeople. I will link this table to the table I had at step ‘Added Conditional Column’, before I grouped my data. If I look at the ‘Home’ tab, I have the option to ‘Merge Queries’.
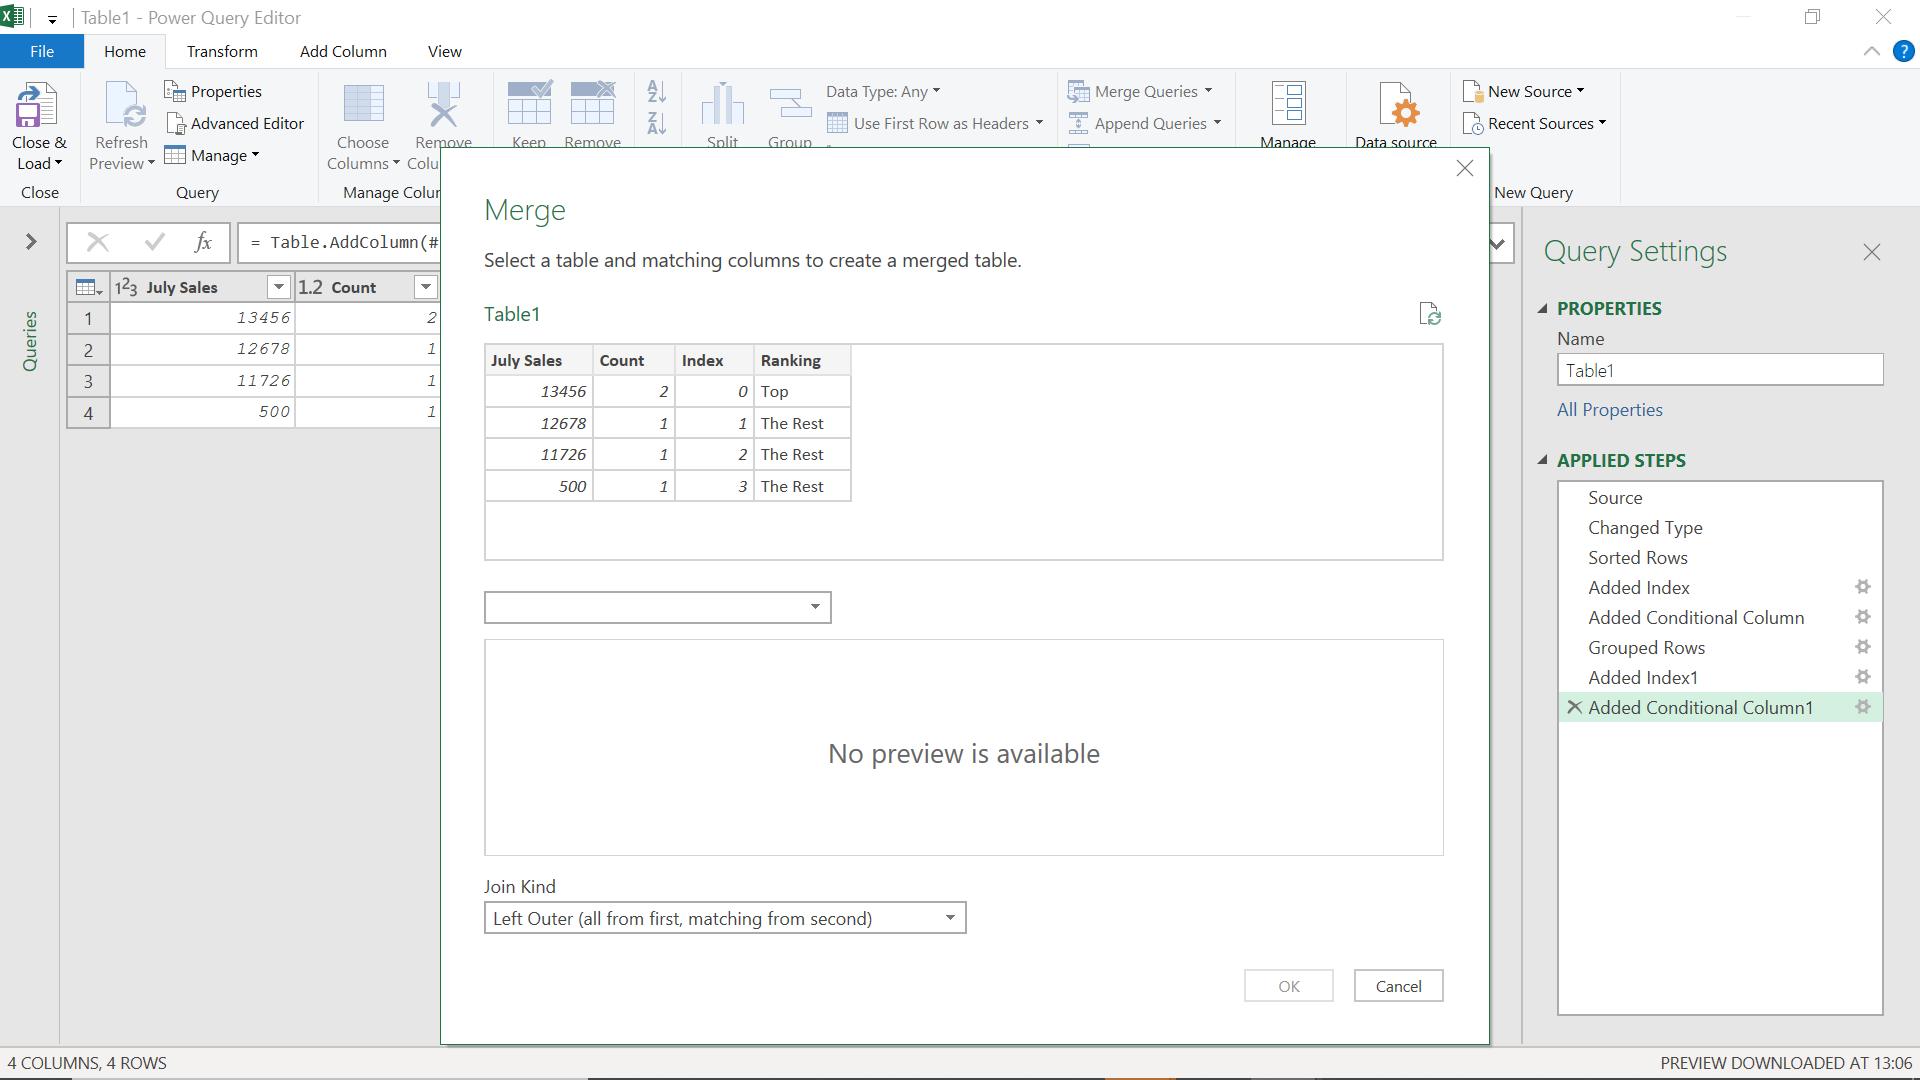
Since I only have one query, I have to link it to itself, but I can amend the M code later.
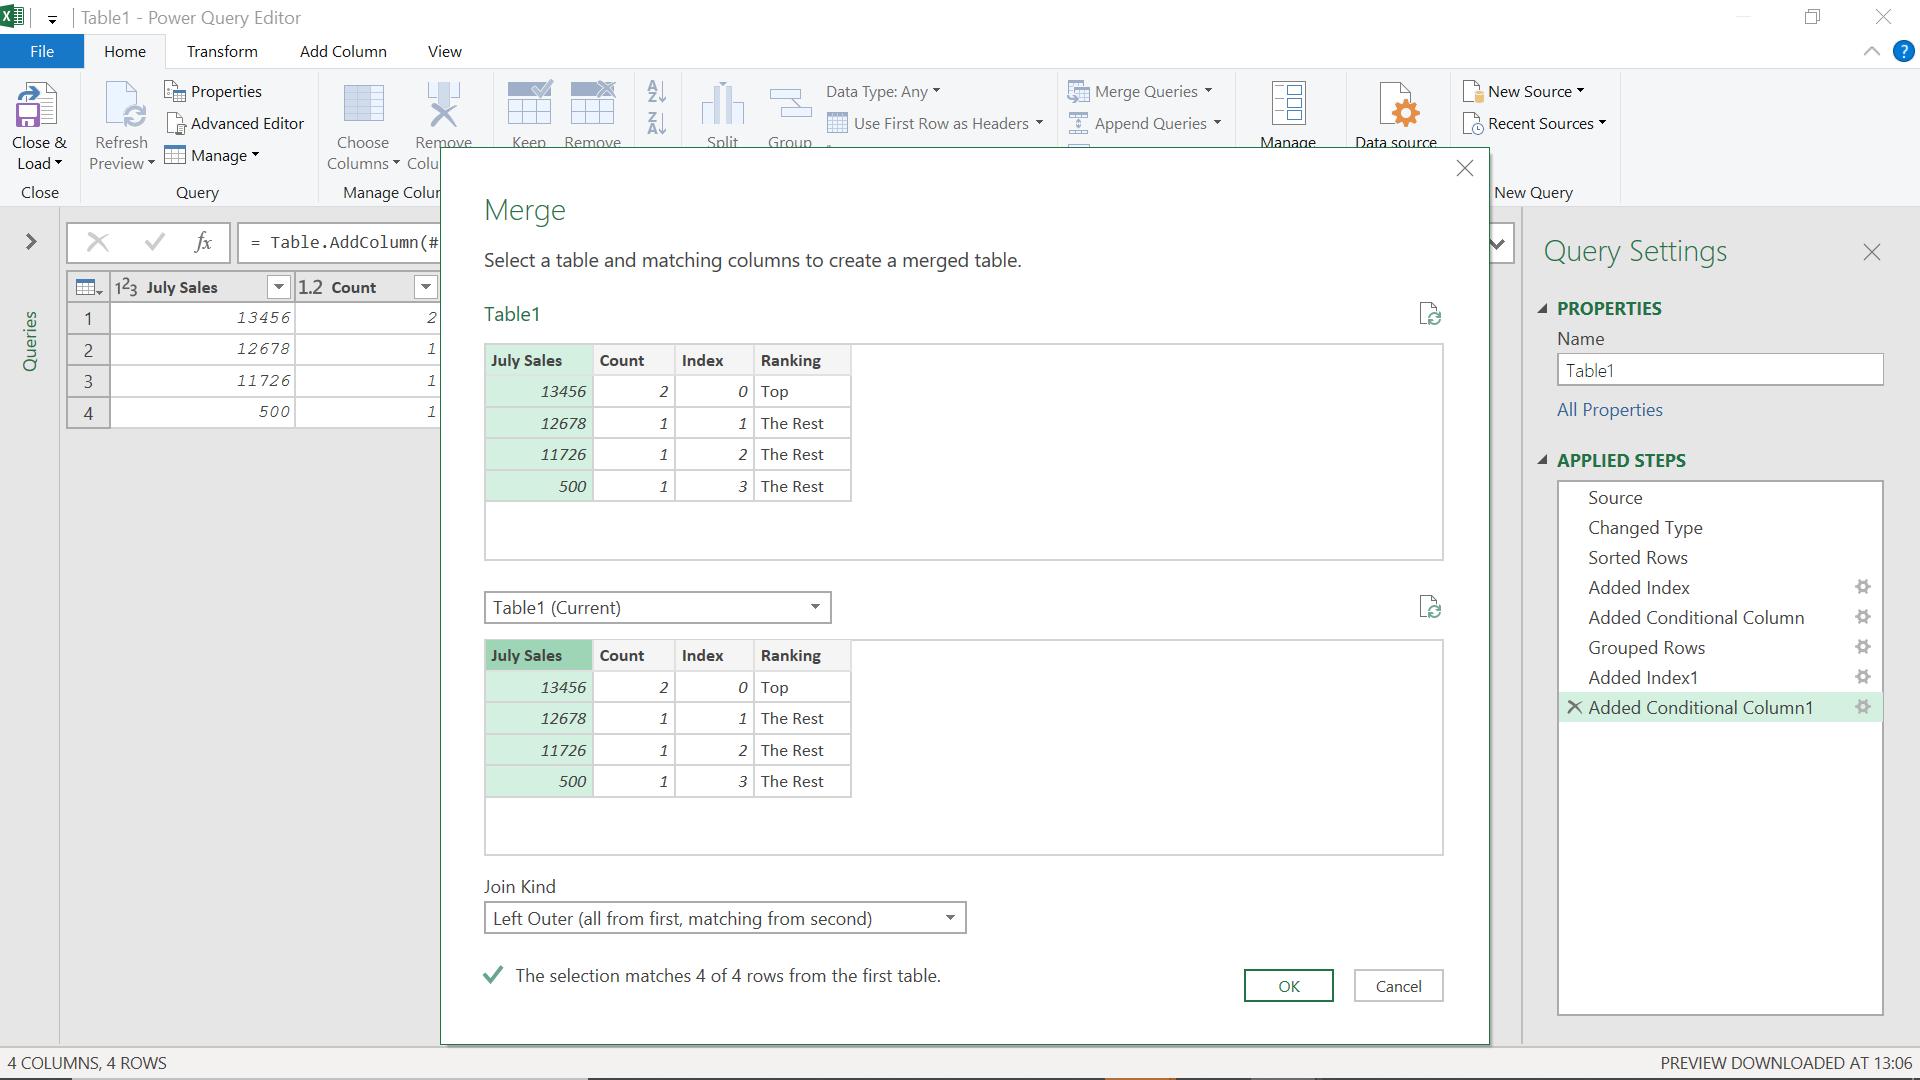
I link on July Sales, since that will eventually give me all the salespeople.
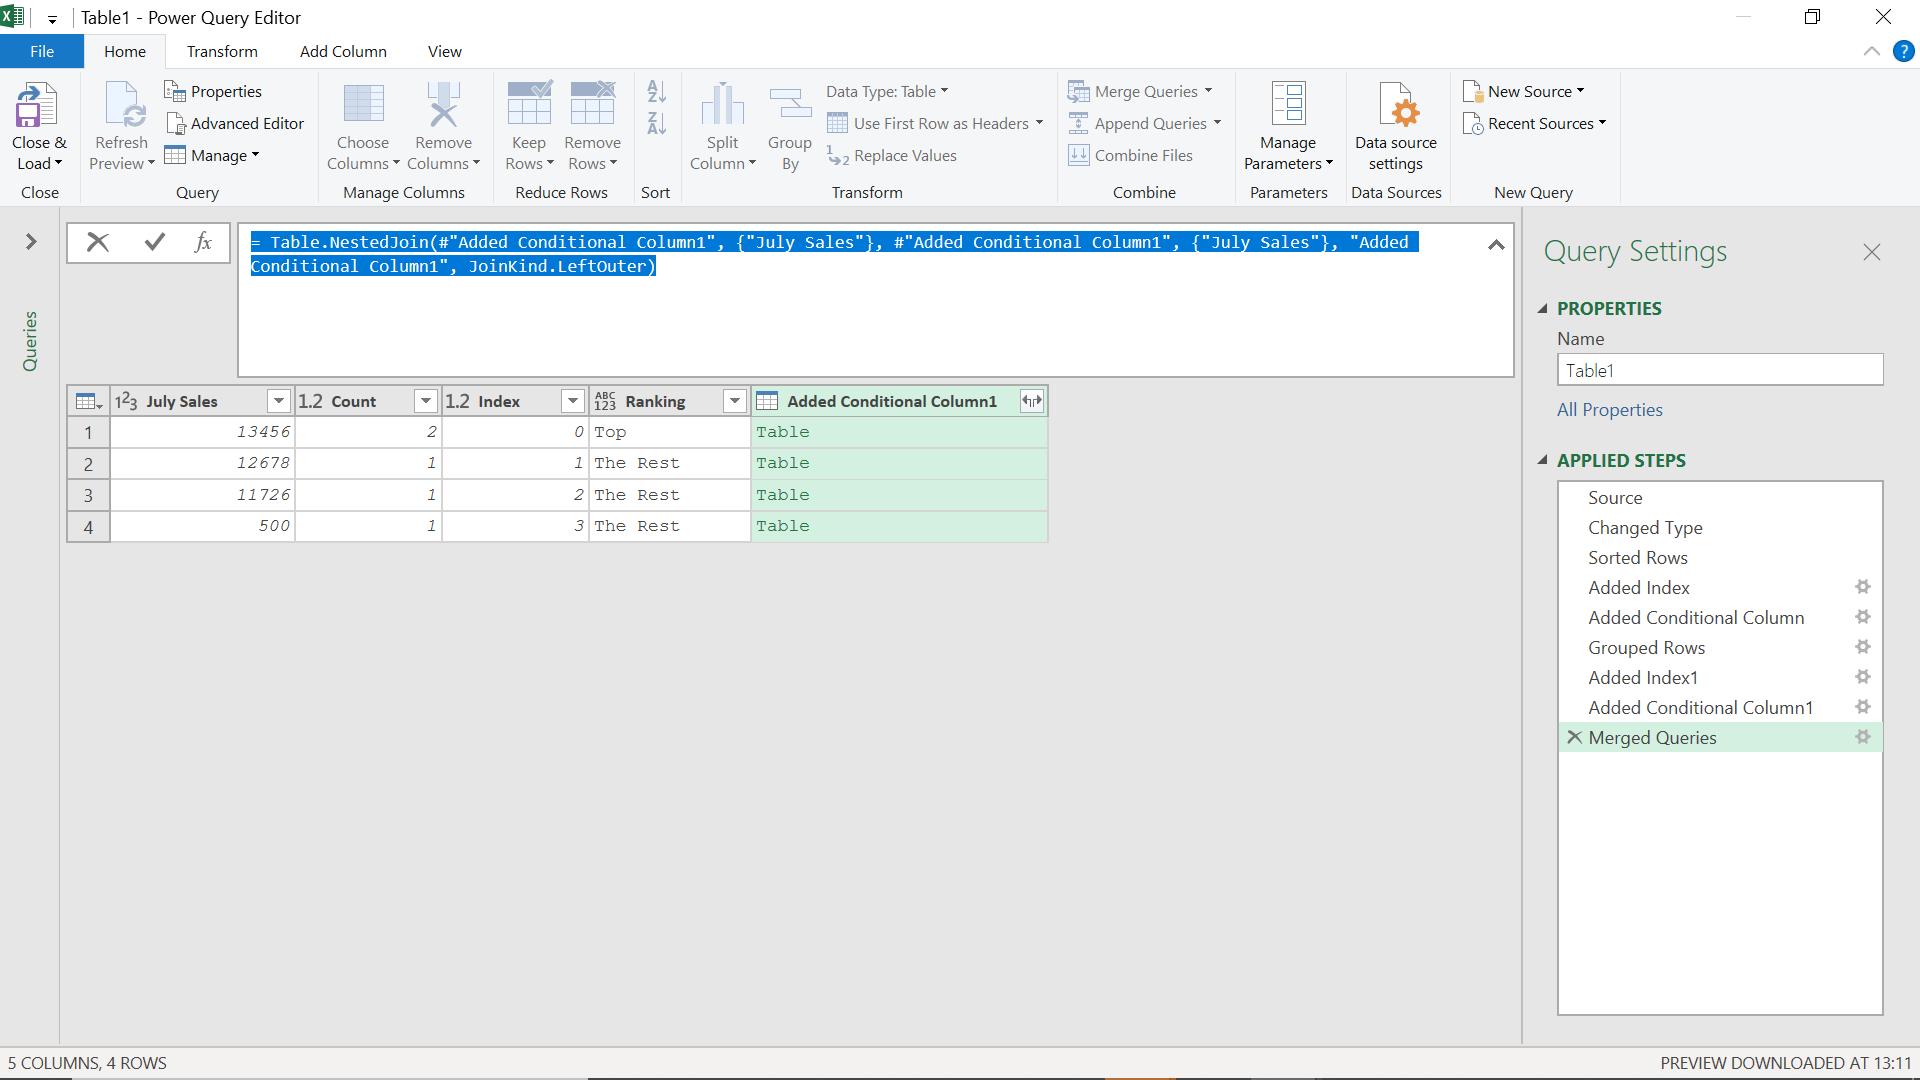
I have generated the following M code:
= Table.NestedJoin(#"Added Conditional Column1", {"July Sales"}, #"Added Conditional Column1", {"July Sales"}, "Added Conditional Column1", JoinKind.LeftOuter)
This joins the query to itself at the same point, but I will amend it to link back to the earlier step.
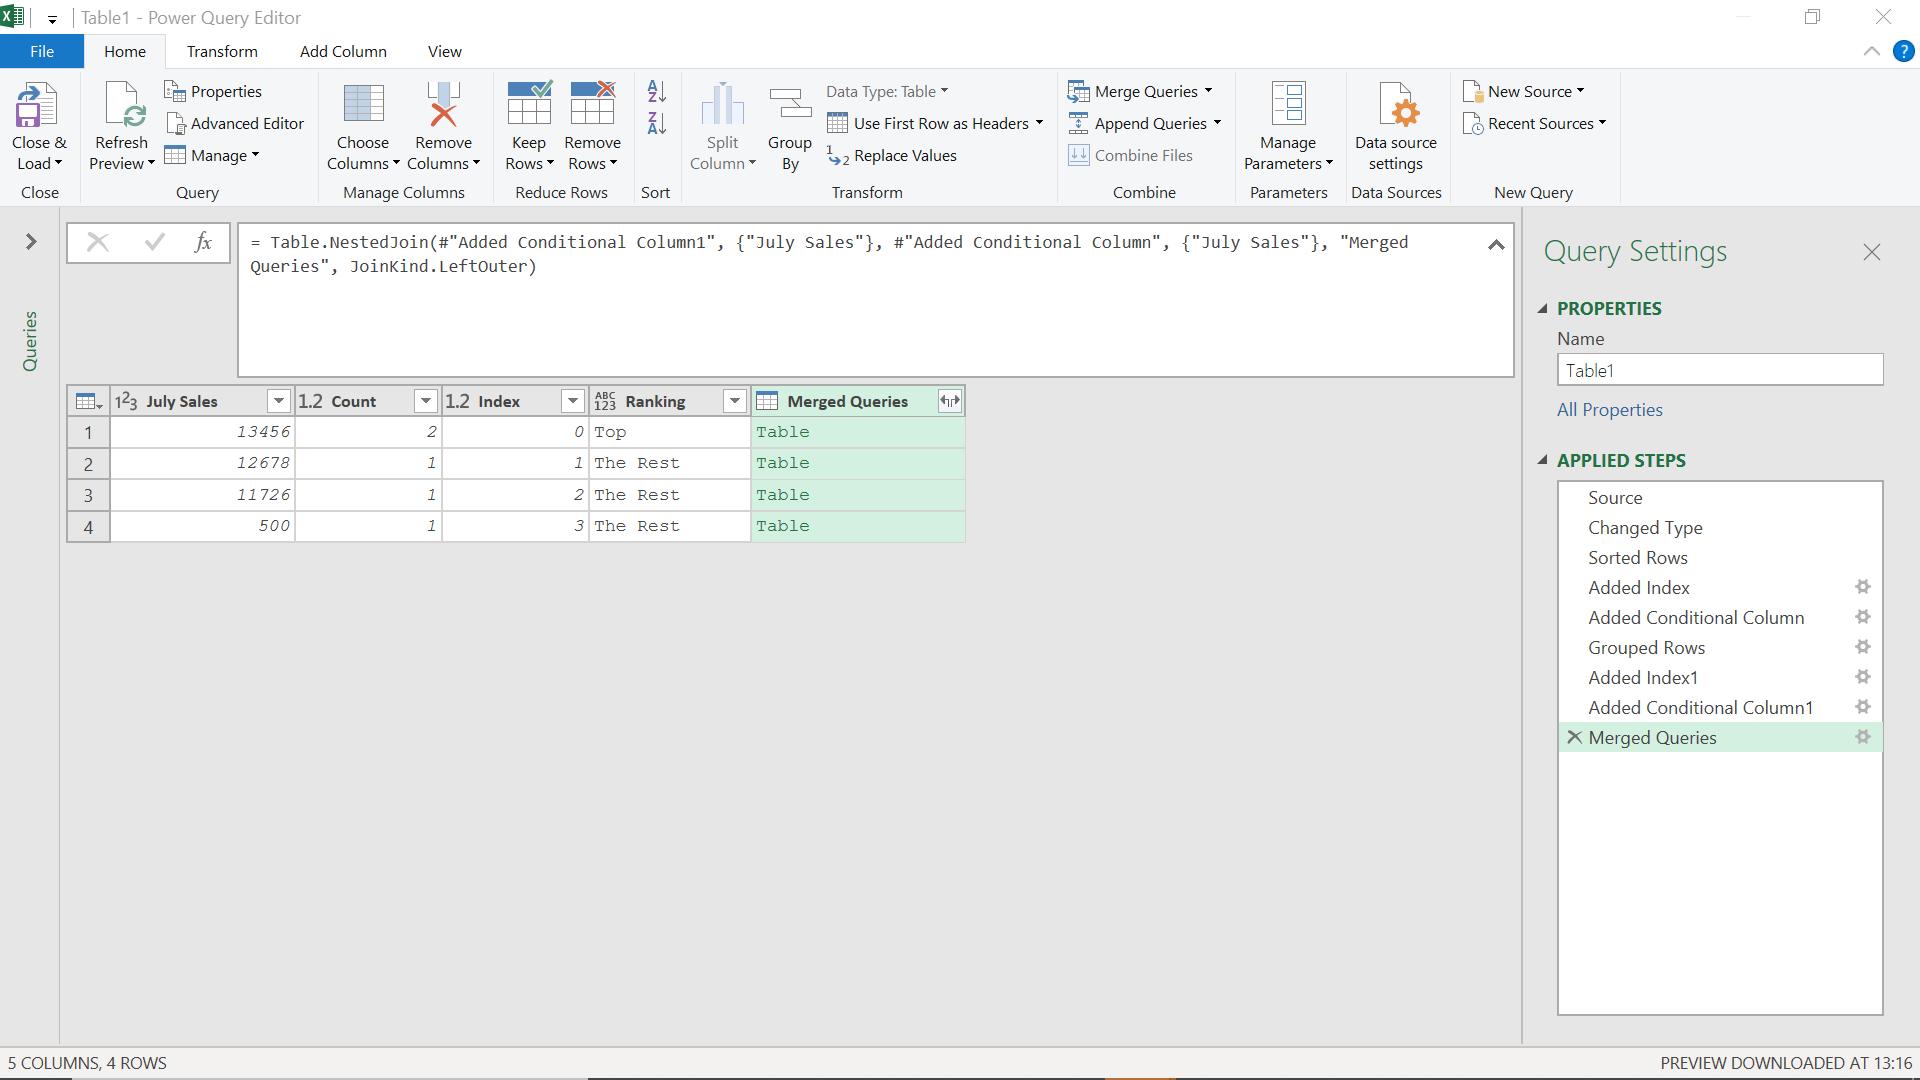
= Table.NestedJoin(#"Added Conditional Column1", {"July Sales"}, #"Added Conditional Column", {"July Sales"}, "Merged Queries", JoinKind.LeftOuter)
Thanks to the similar step names, I only have to change the second “Added Conditional Column1” to “Added Conditional Column”. I call my new column Merged Queries.
I can expand my new column to get all the rows back, and I will choose to retrieve only the name of the salesperson from Merged Queries.
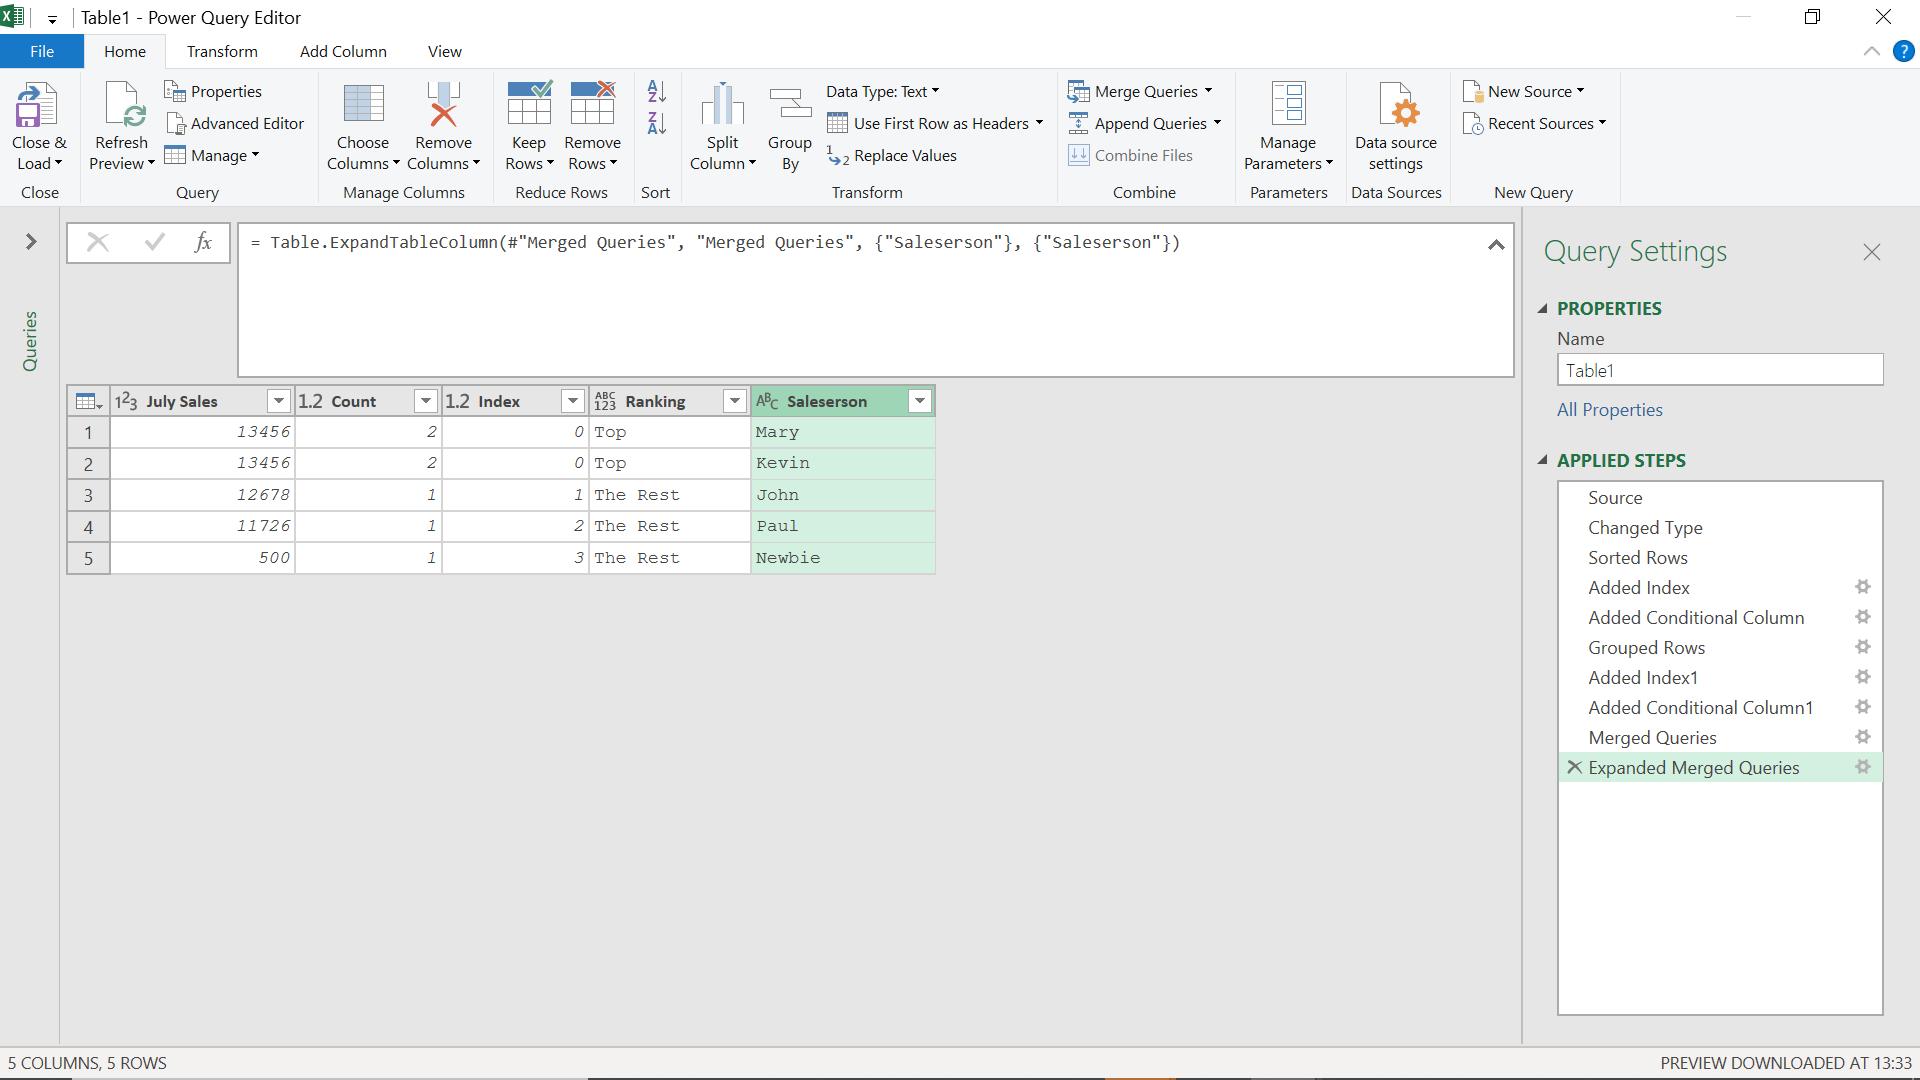
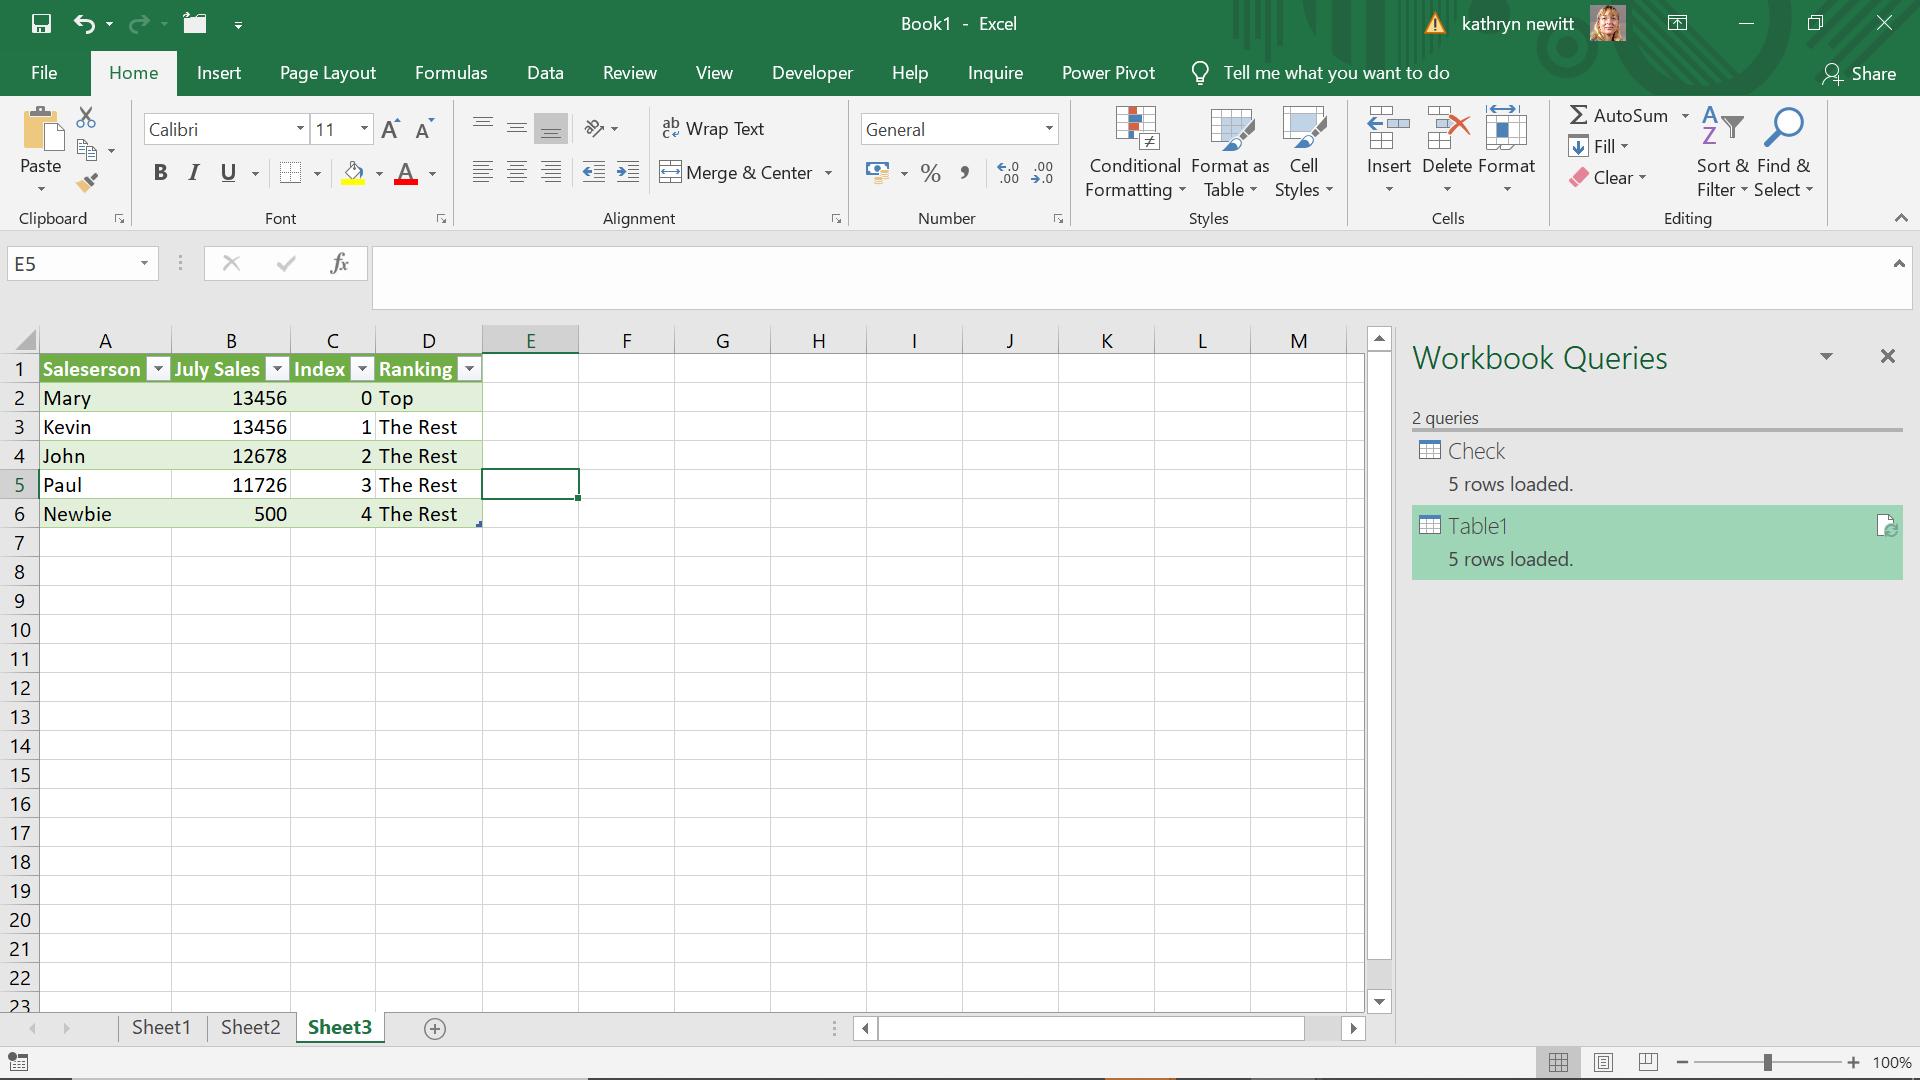
I can now see that Mary and Kevin are both Top, and they will get their bonus! I remove Index and Count and reorganise my data before I ‘Close & Load’ to Excel.

To check the query for more data, I enter the details for more salespeople.
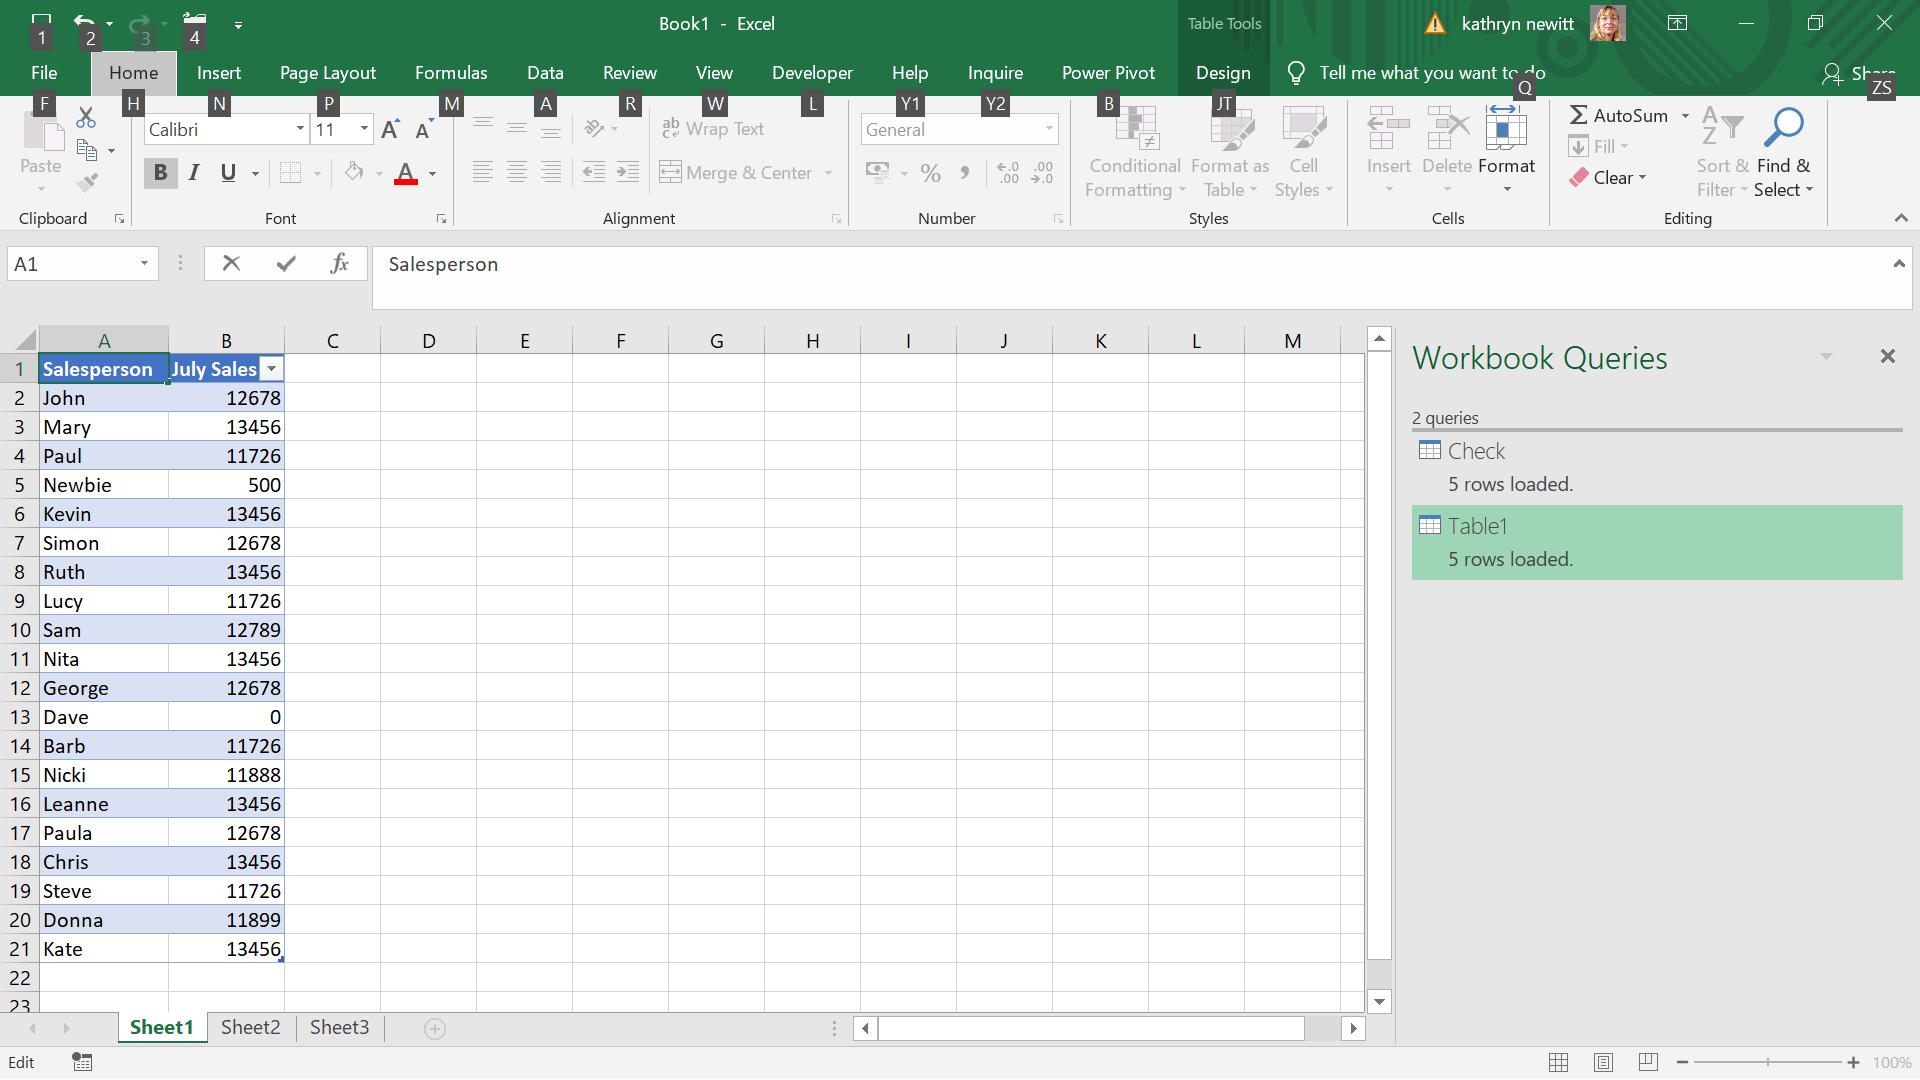
When I refresh my query, the results are clear.

I clearly have lots of top salespeople due for a bonus!
Come back next time for more ways to use Power Query!