
Power Query: Totals by Type
14 July 2021
Welcome to our Power Query blog. This week I look at selective running totals.
I have some tent data (yet again).
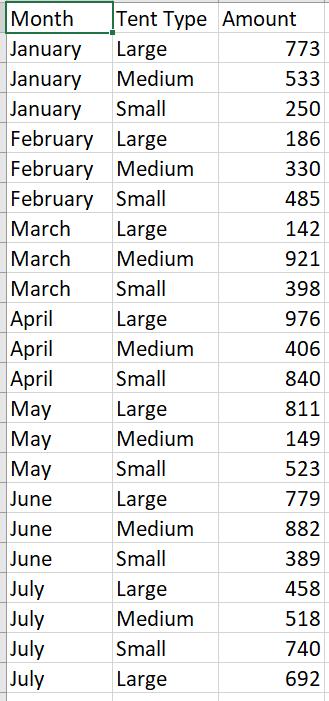
I am going to create some running totals. I start by loading my data to Power Query using ‘From Table/Range’ from the ‘Get & Transform Data’ section of the Data tab.
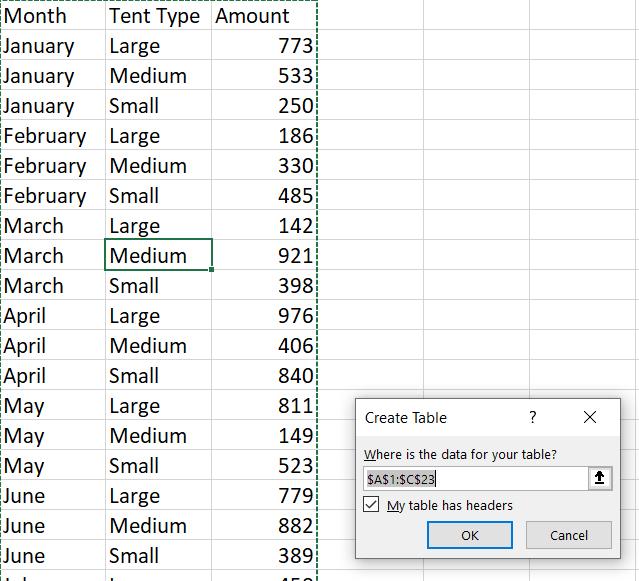
I take the defaults and load my data.
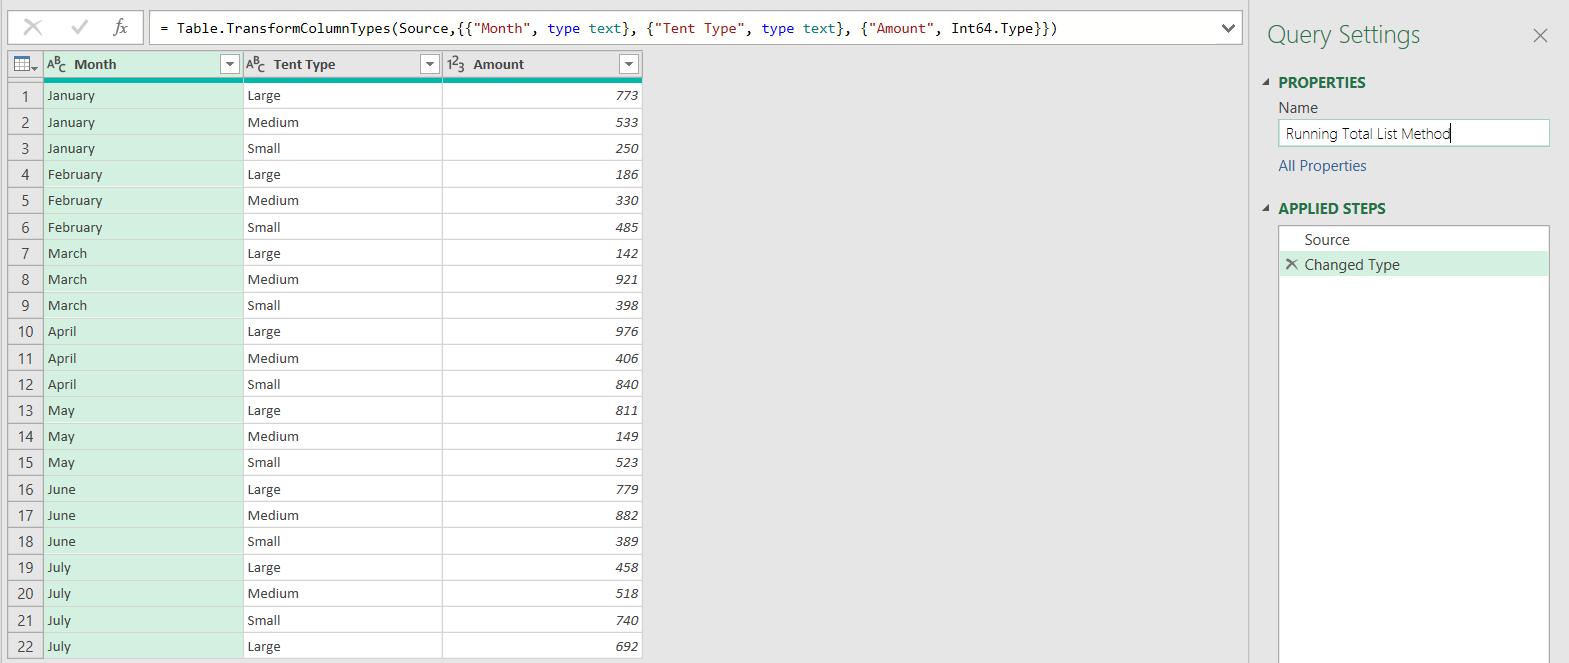
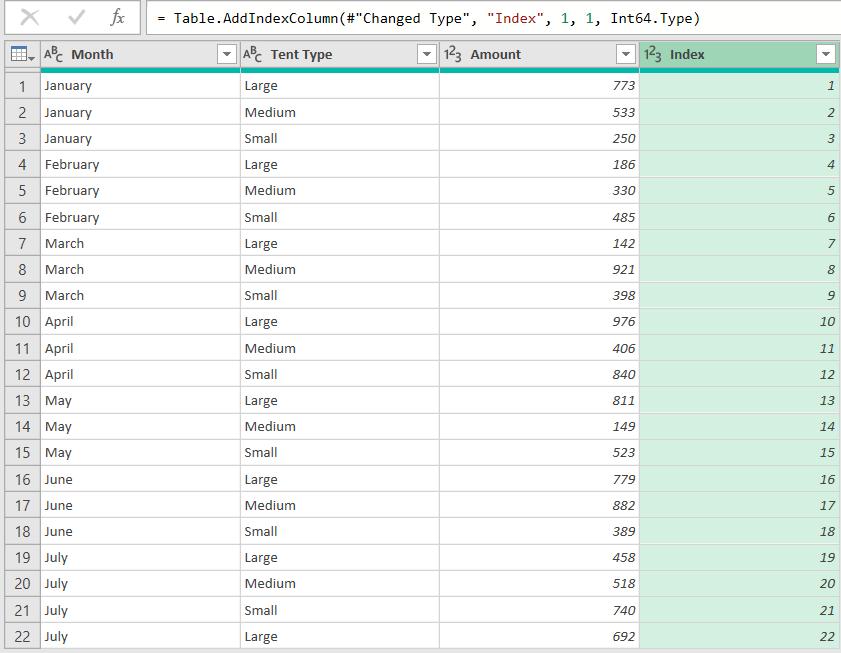
I will start by creating a running total using List() functionality, as I did in Power Query: Keep On Running. To achieve this, I start by adding an Index column from the ‘Add Column’ tab.
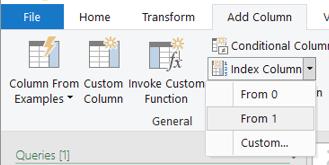
I’ll start from one [1].
Now, I can create a Custom Column to calculate the running total.
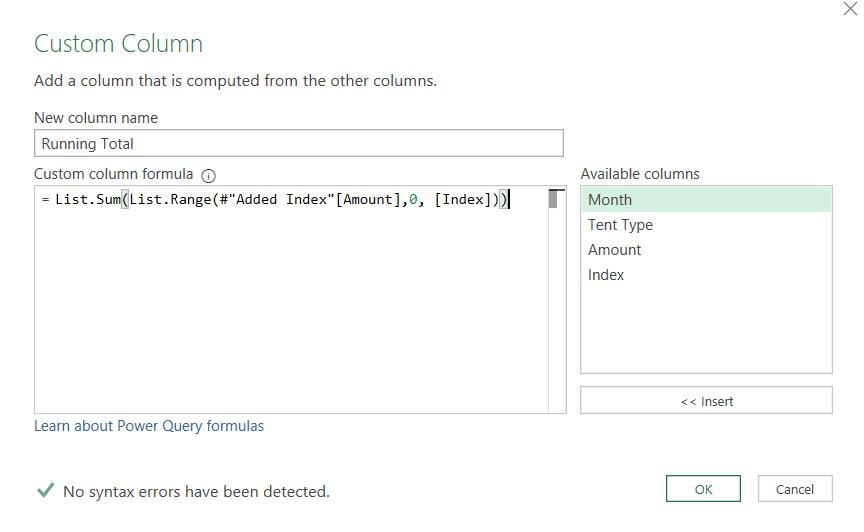
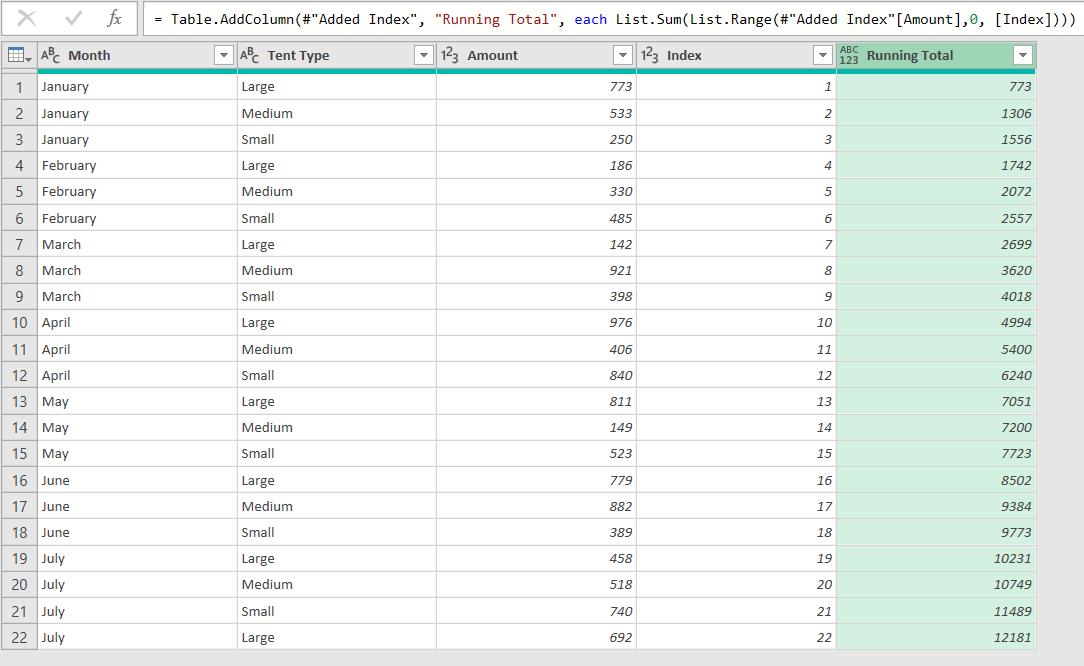
This gives me the running total.
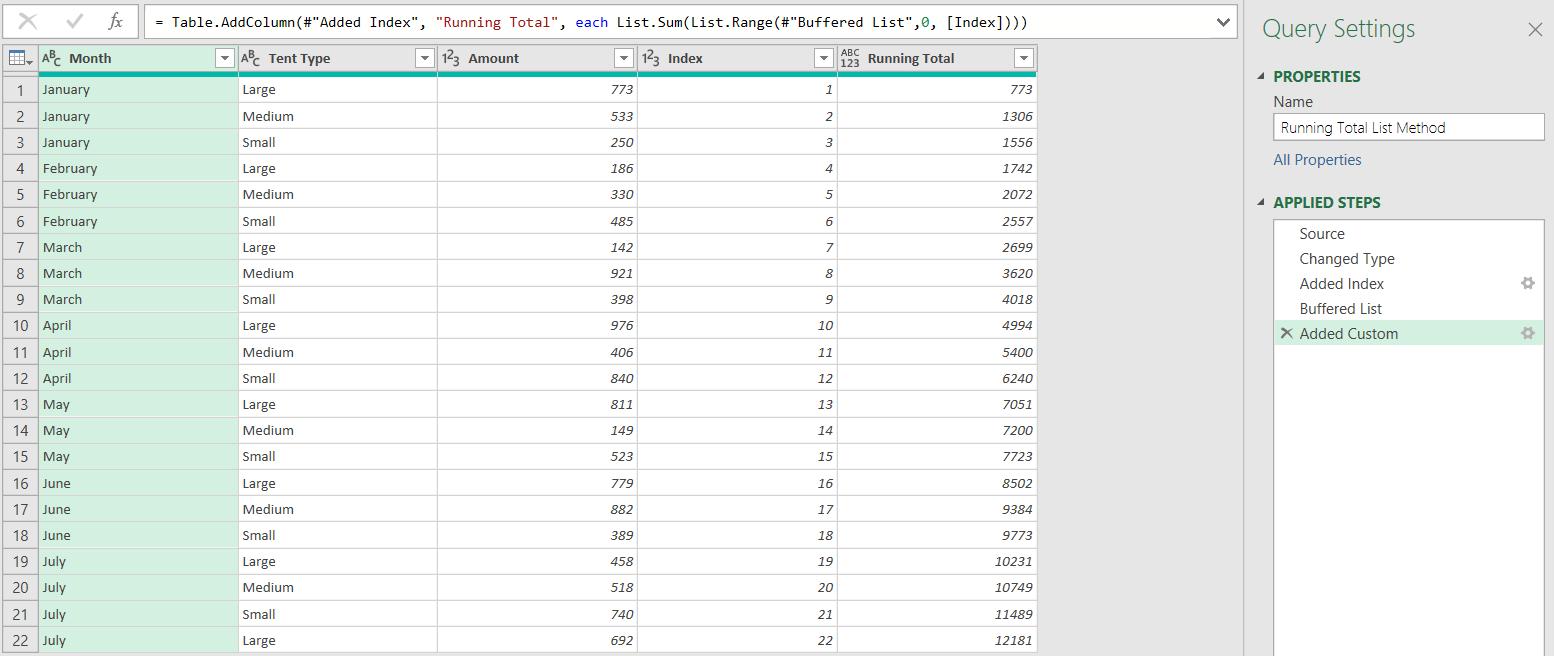
I can then add list buffering to stop it from reading the list of amounts every time it calculates a running total field.
However, now I want to see the running total for each Tent Type. The method I will use this week is specific to this dataset. I will look at a more generic method next week.
I start from the Added Index step. I need to sort my data by Tent Type and then by Index.
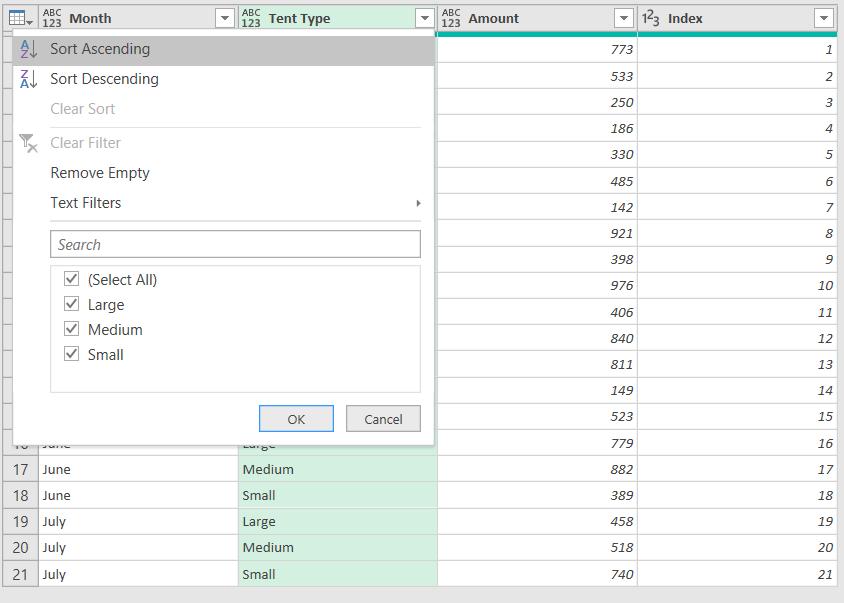
Having done both sorts, my data is ready for the next step.
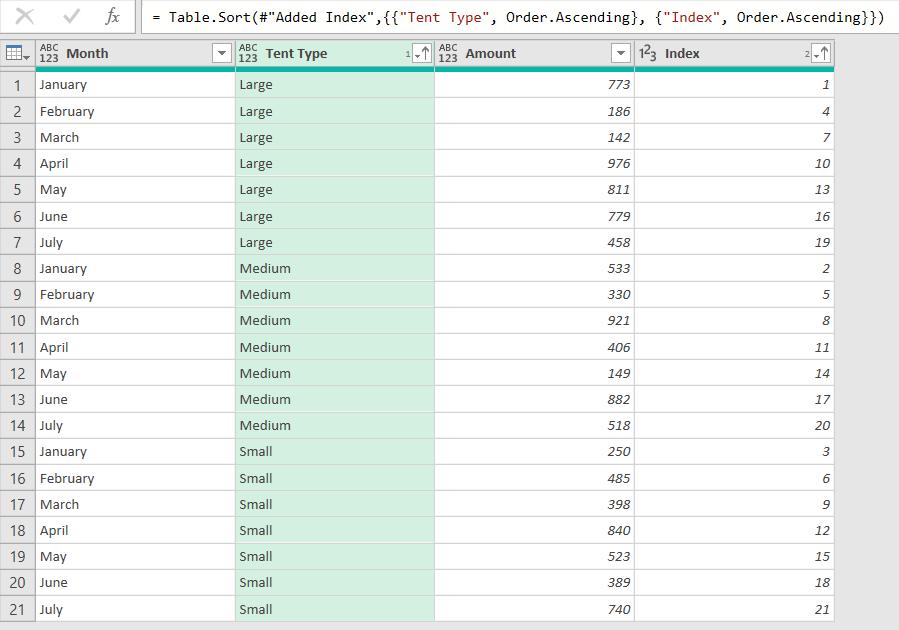
I am going to use similar M code to the overall running total, which was:
= List.Sum(List.Range(#"Buffered List",0, [Index])))
However, this time I want the values in [Index] to only increment within each Tent Type, and instead of using an offset of zero, I will offset to read the values for each Tent Type.
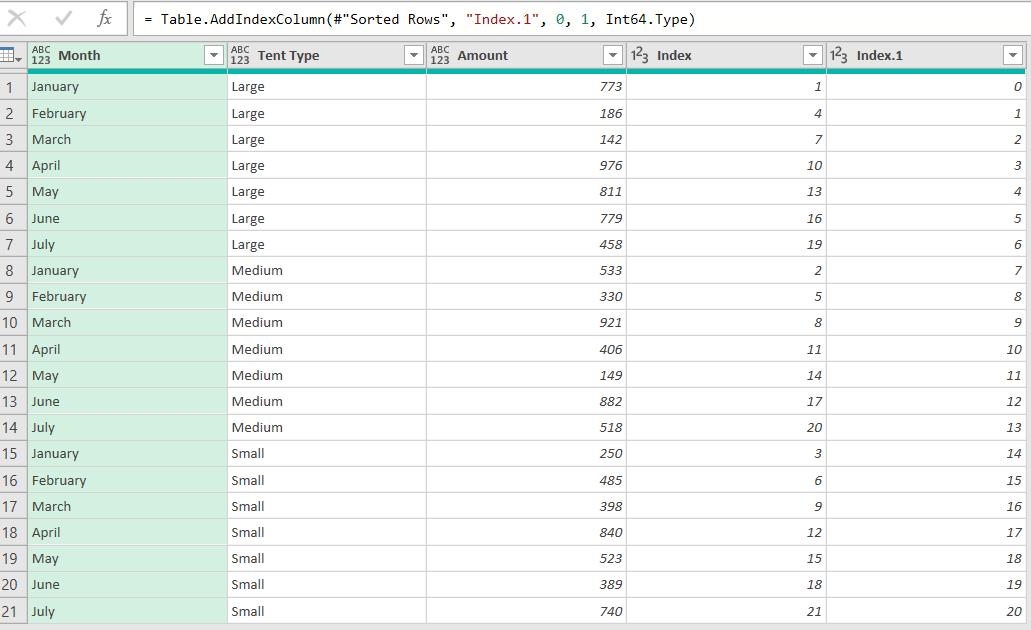
I start by creating a new Index column from the ‘Add Column’ tab.
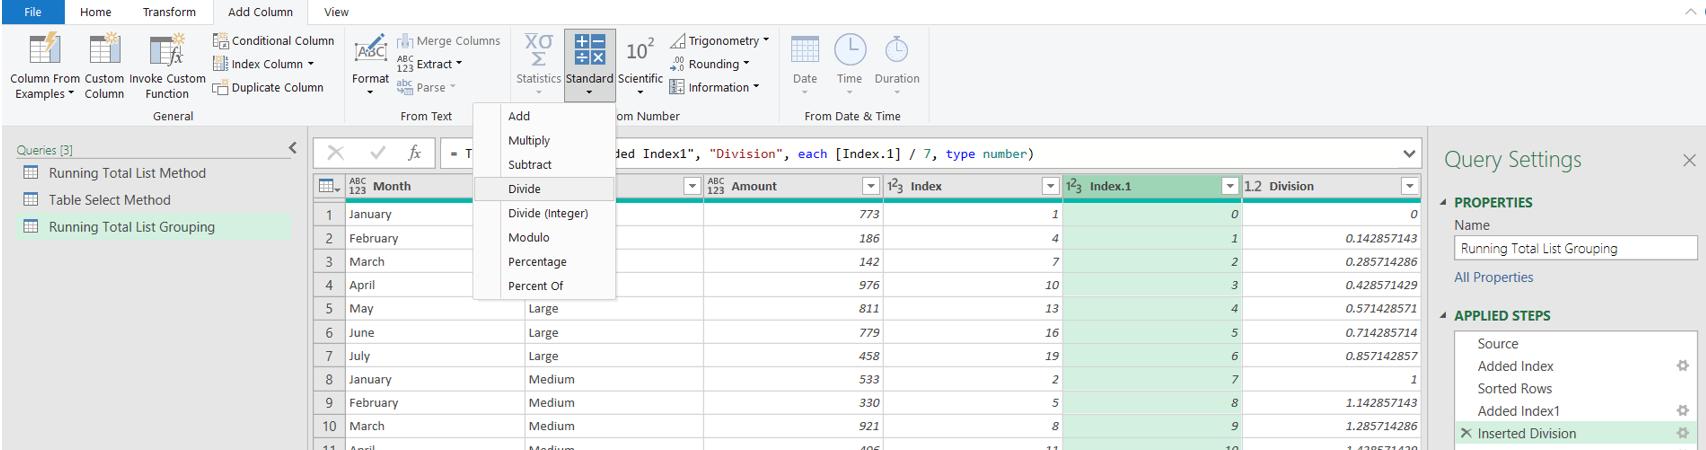
Next, I set up the column I will be using as the offset in my calculation. From the ‘Add Column’ tab, I insert a column which is Index.1 divided by seven [7].
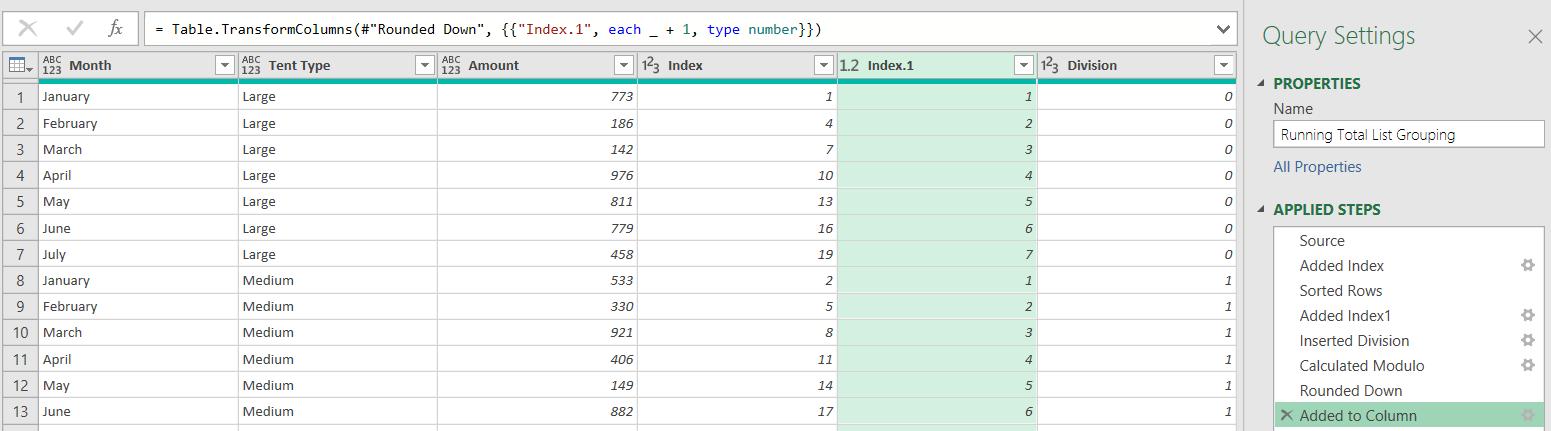
I just need to tidy up these columns now. Using the Transform tab, I apply modulo seven [7] to Index.1, and add one [1] to it. I also round down Division.
Now I am ready to apply the list functions to get my running totals.
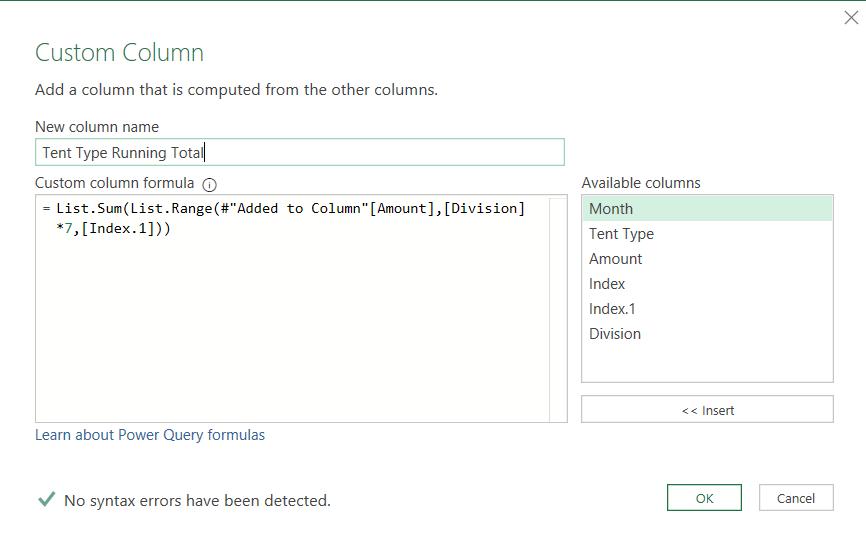
The M code I have used is:
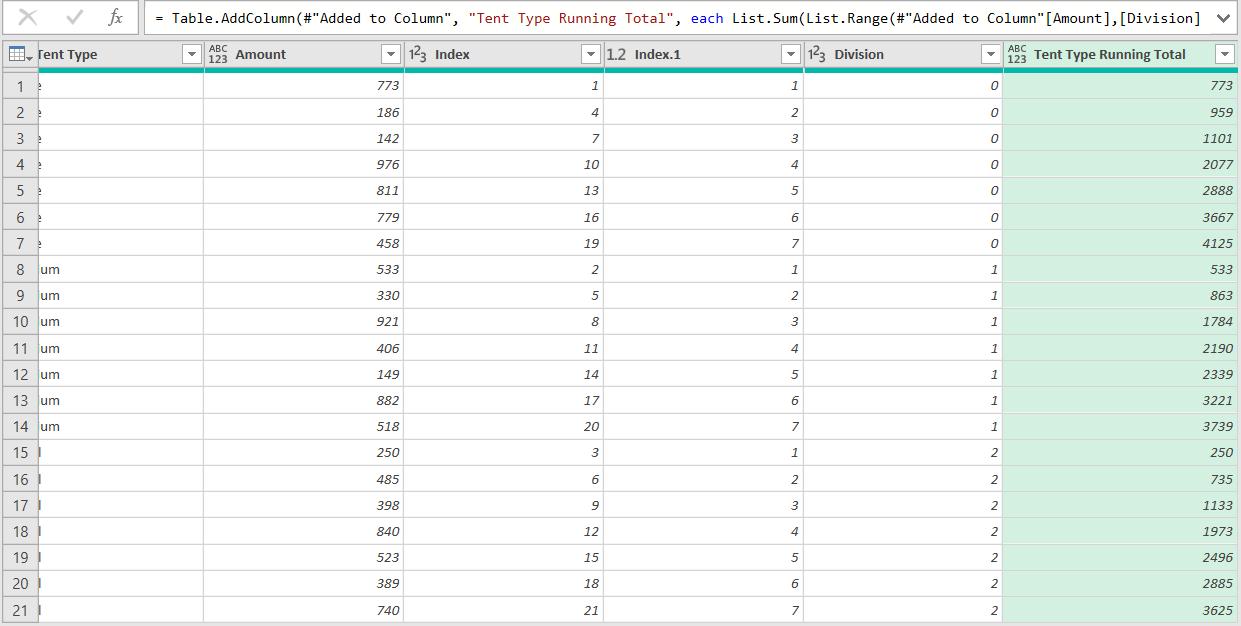
= List.Sum(List.Range(#"Added to Column"[Amount],[Division]*7,[Index.1]))
I am summing up the amounts for my data in groups of seven [7].
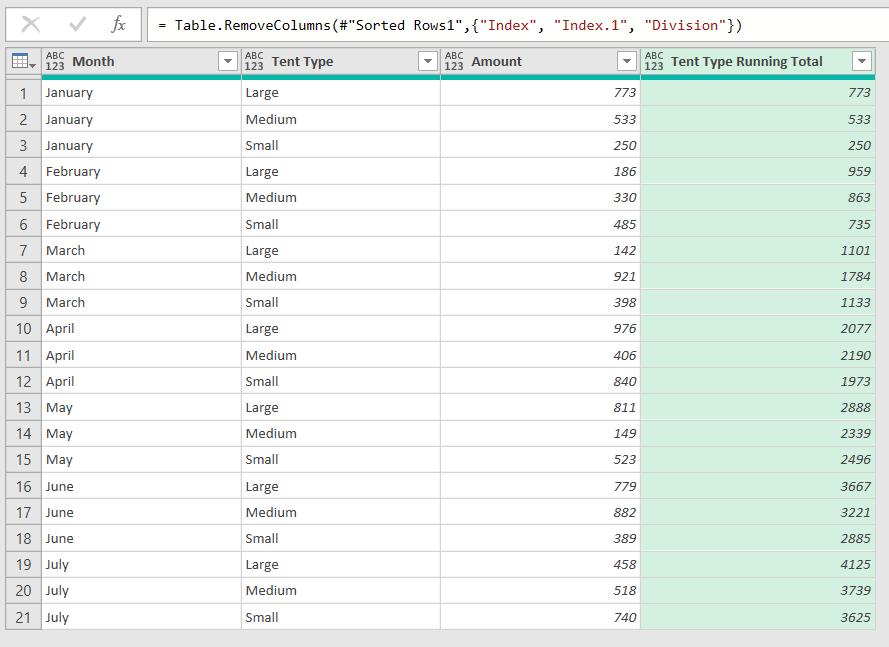
The amounts are correct. I can sort by the original Index to restore the order and remove the columns I used to work towards the result.
Next time I will look at another method, which doesn’t rely on the data being in groups of seven [7].
Come back next time for more ways to use Power Query!