
Power Query: Project Population – Part 4
10 May 2023
Welcome to our Power Query blog. This week, I continue to transform selected data from a public source (just for a change).
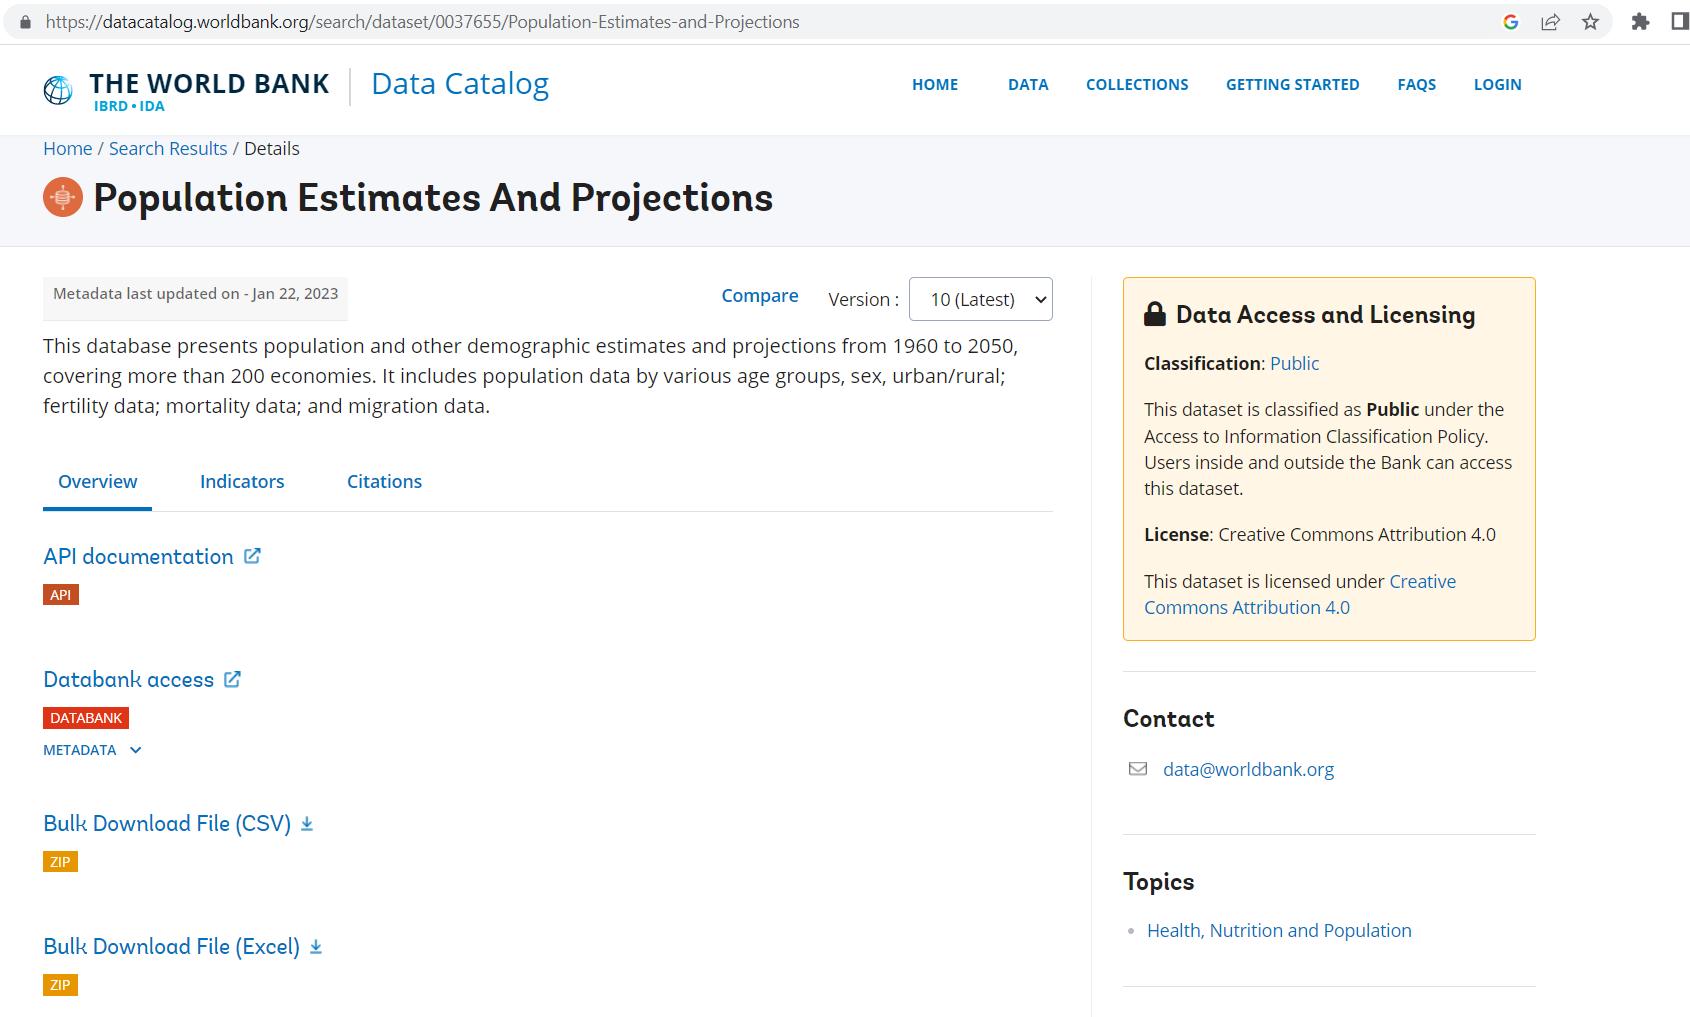
I have found some information on population growth provided by The World Bank, which I am using as an example of how to transform real-life data.
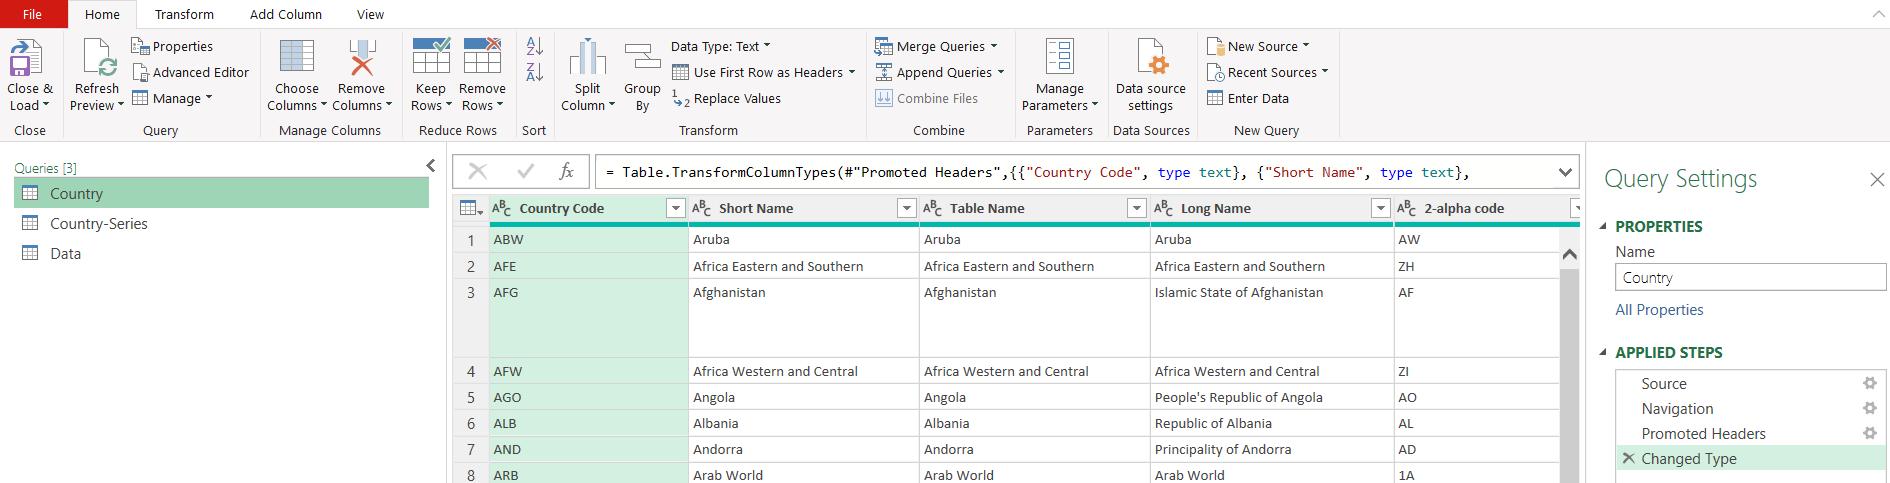
I have downloaded the Excel file, and in Part 1, I extracted the queries I needed:
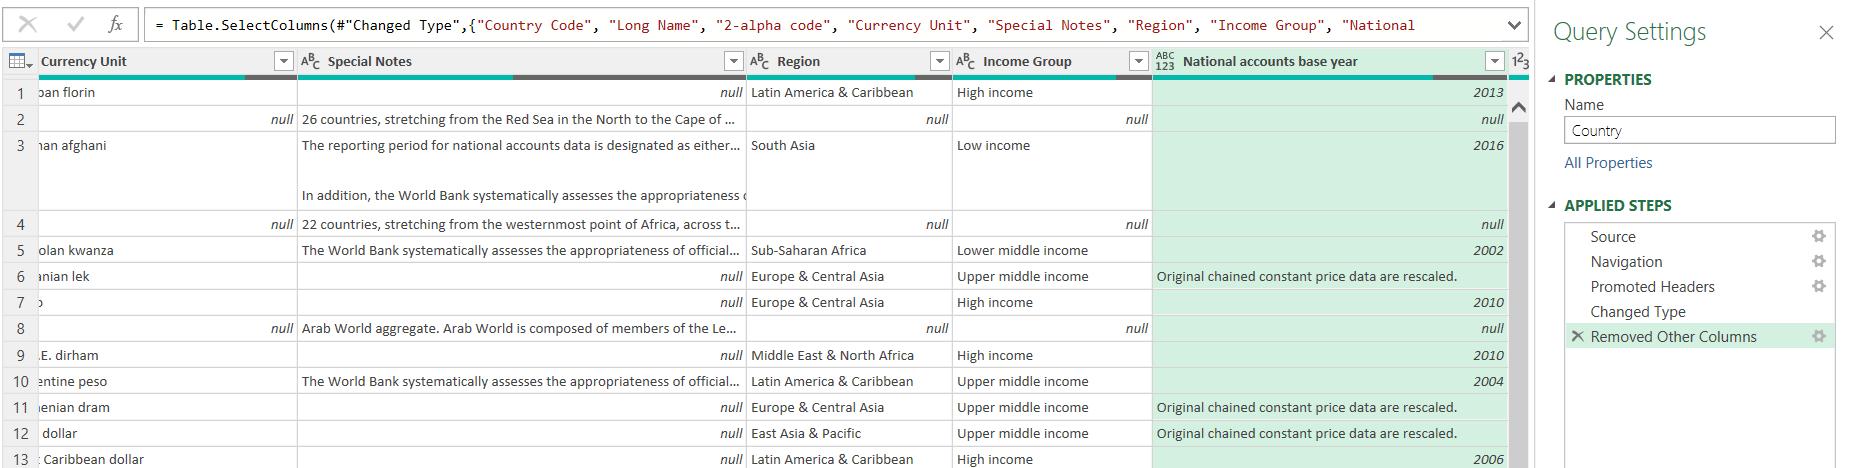
I reduced the data by selecting only the columns I wanted to keep:
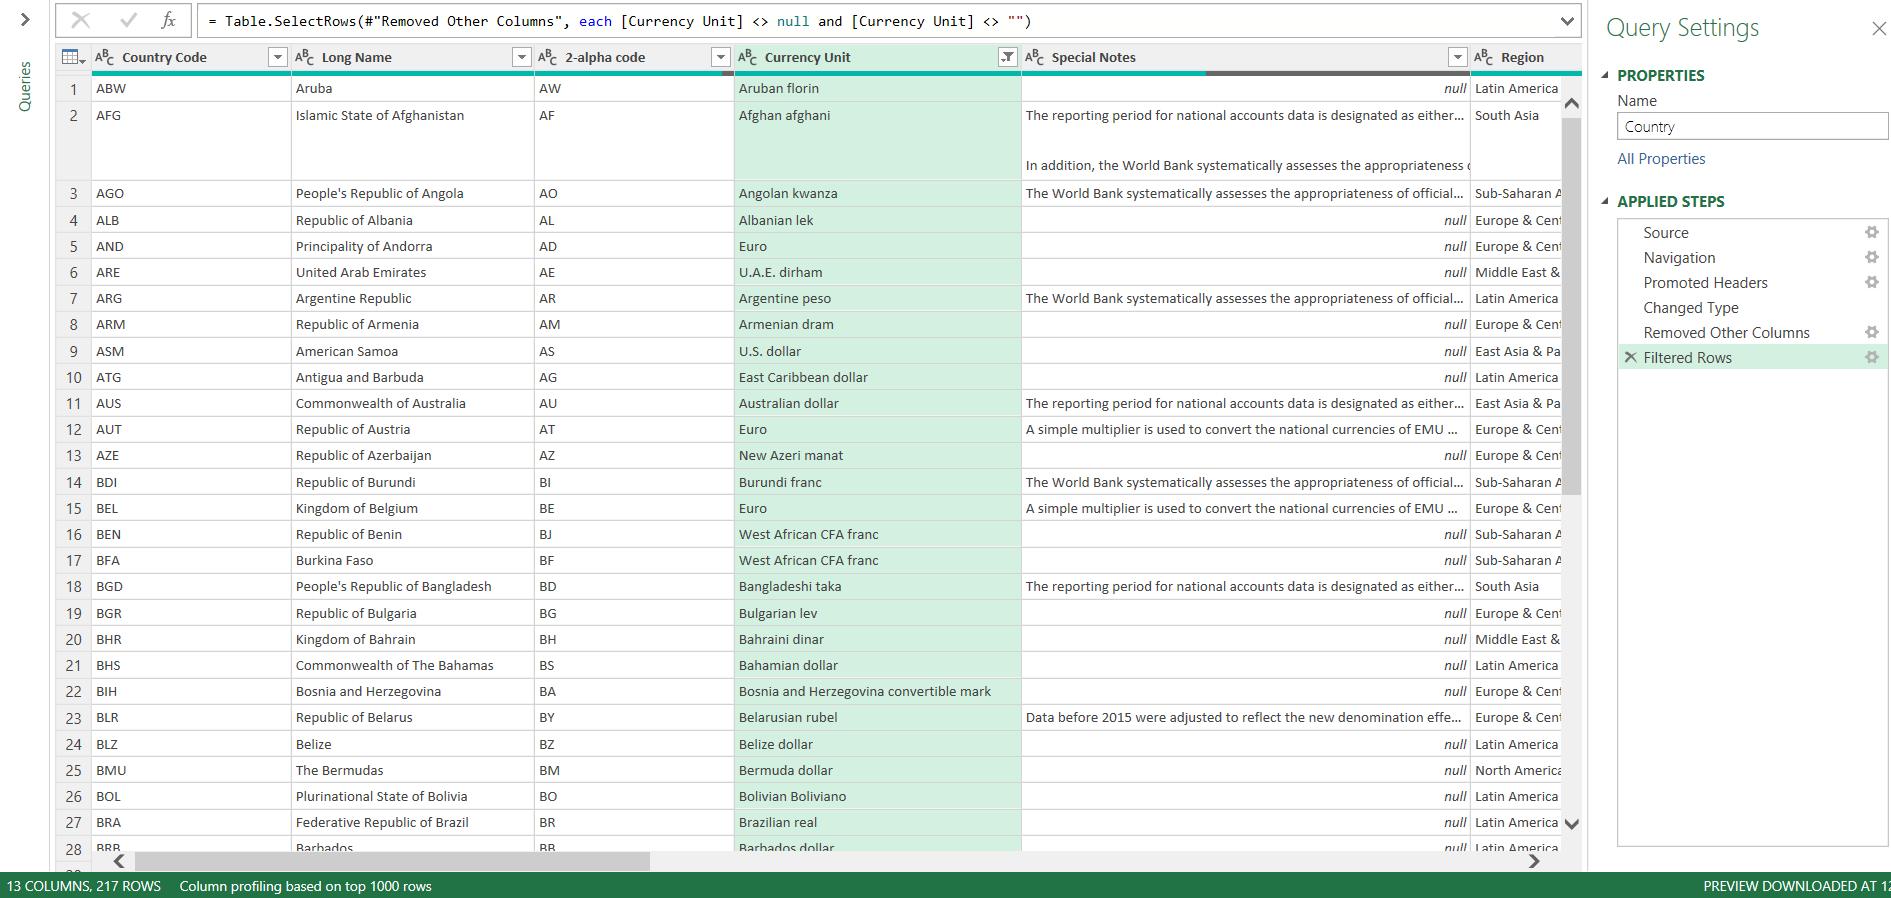
In Part 2, I identified and removed any unnecessary rows:
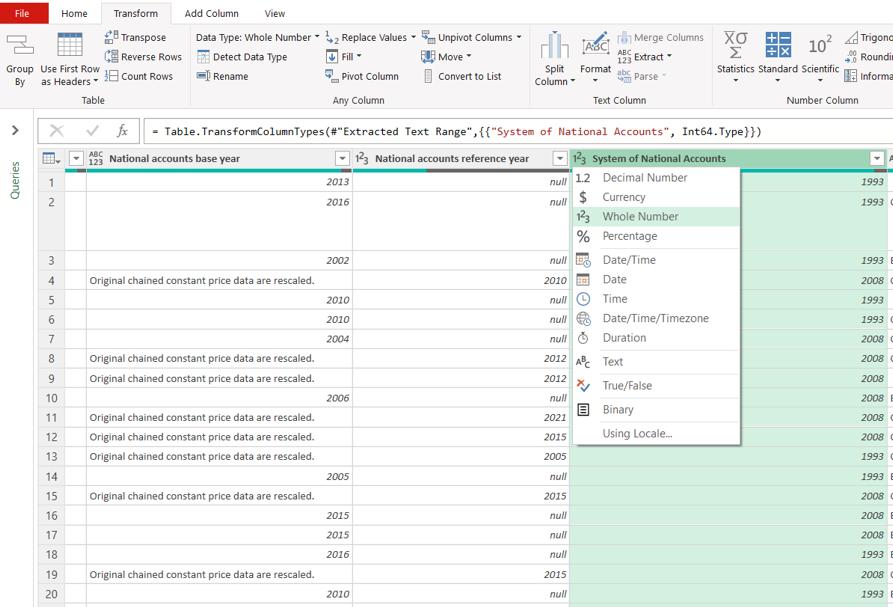
I also transformed the System of National Accounts column:
I renamed these steps to make it easier to follow the transformations:
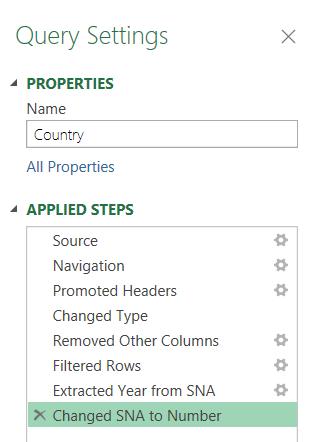
Last time, I transformed the column Latest population census into two [2] columns, Latest population census and Population census notes :
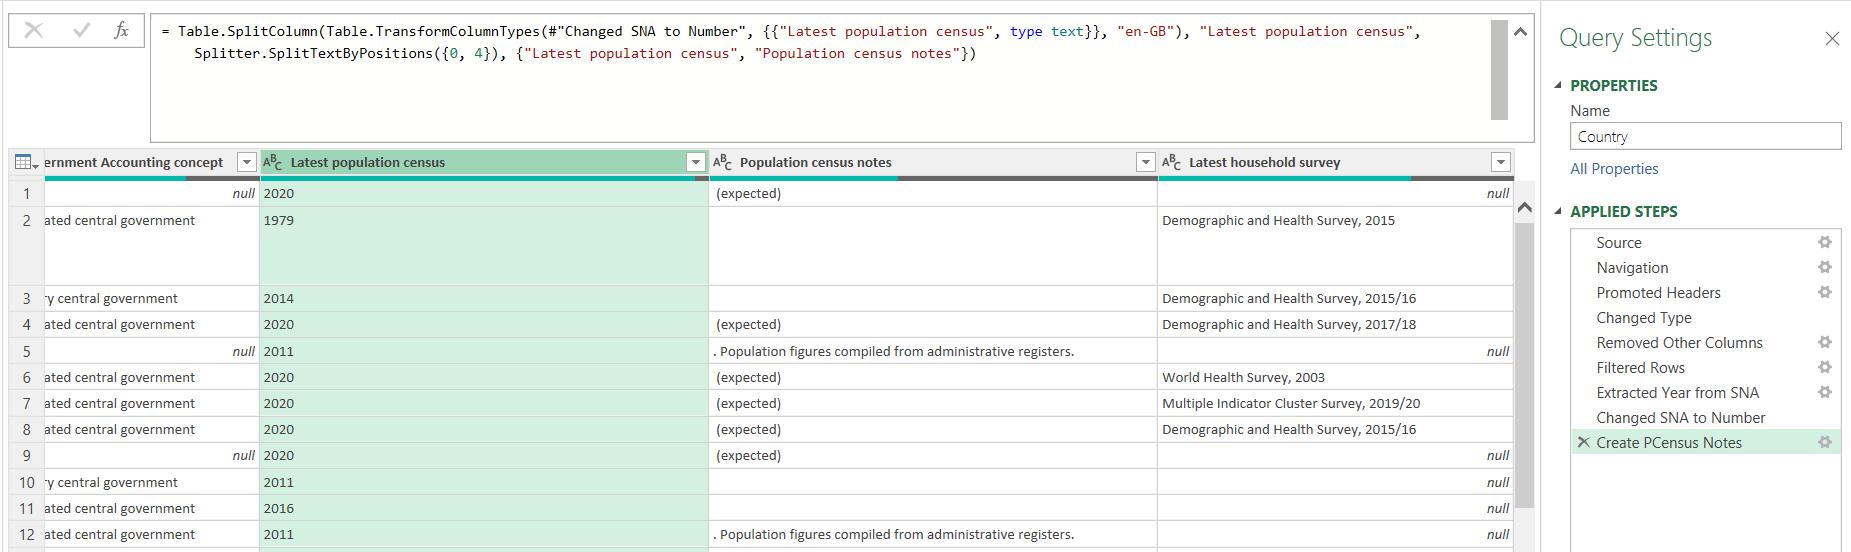
In the process, I noticed that when Power Query generated a ‘Changed Type1’ step, the data type assigned was ‘Text’ for Latest population census. This suggests that not all the data in this column corresponds to a year. I can use the filter dropdown to look at the values in this column:
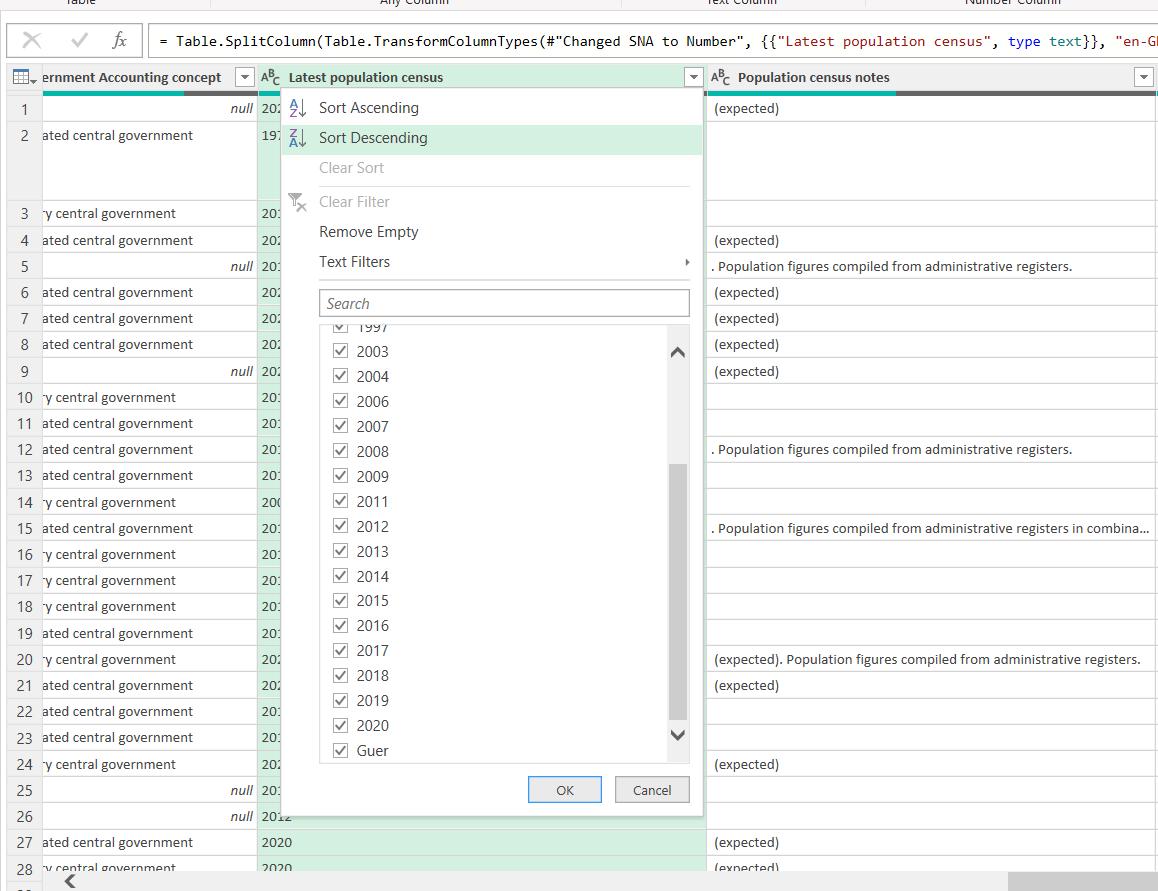
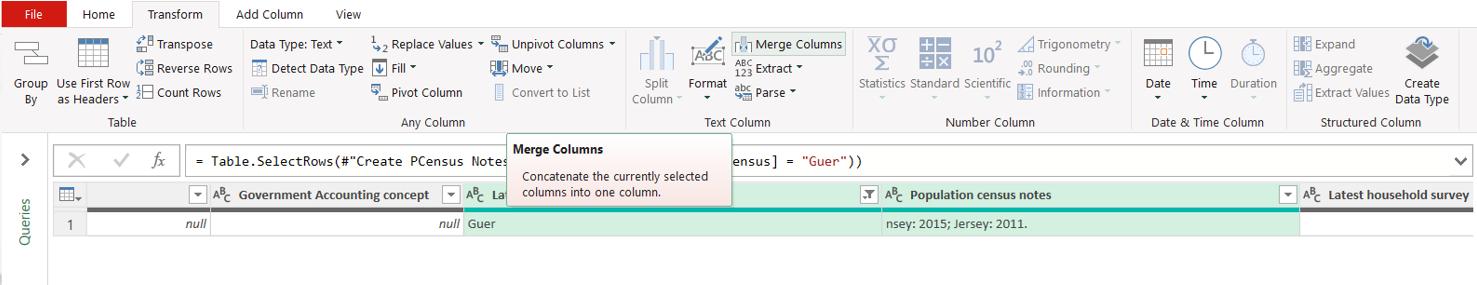
‘Guer’ is not a year! Not all the data has been split correctly. If I want to include this with the rest of my data, I need to transform it separately. I filter on ‘Guer’ to see the data.

This data has been provided per island, and not per country like the rest of the data. I would like Latest population census to be ‘2015’, and then for Population census notes to include everything that is currently split across the columns. I start by merging the columns, by selecting them and using ‘Merge Columns’ on the Transform tab:
I can recreate Population census notes:
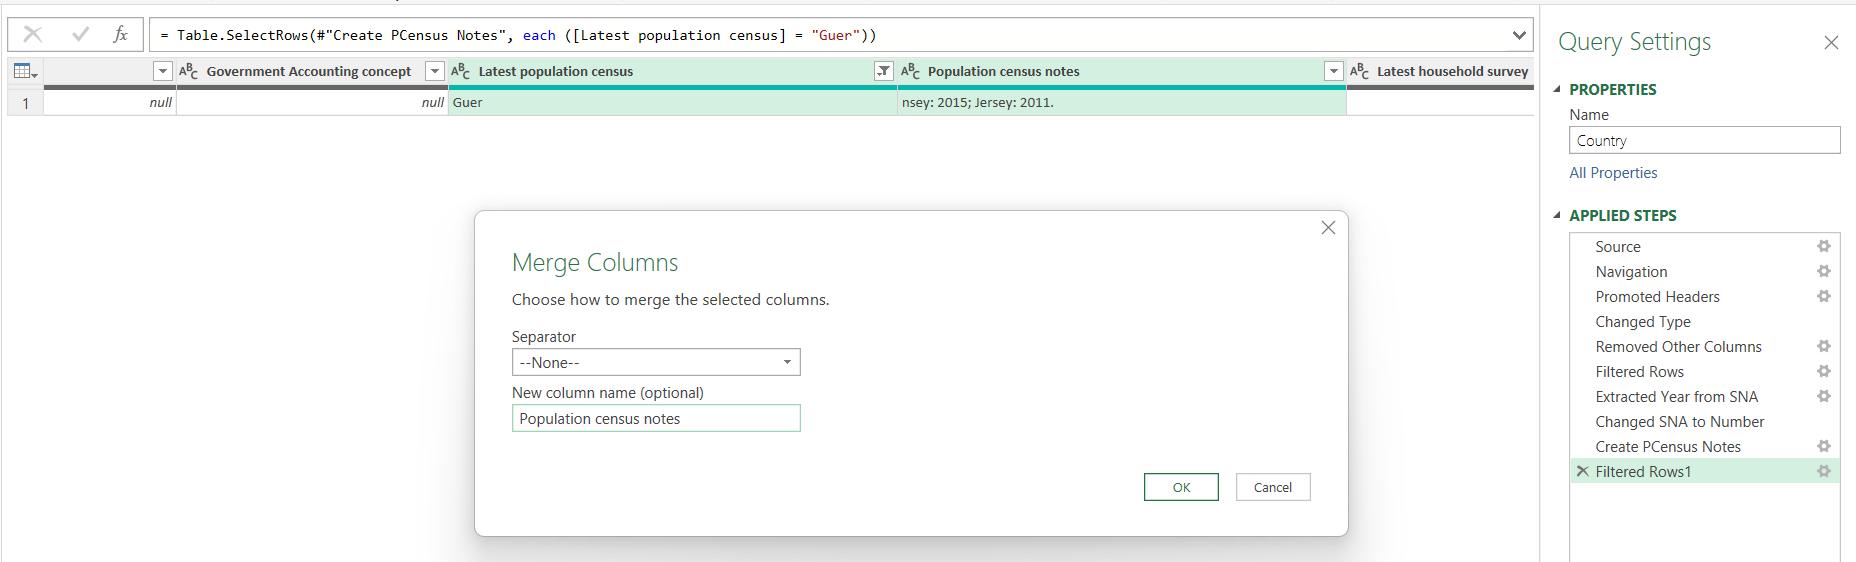
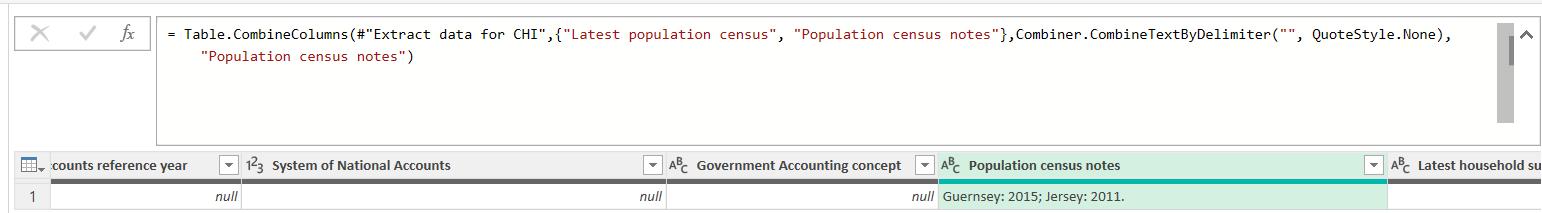
Annoyingly, Power Query renames my column, even though the previous version of Population census notes no longer exists!

I need to rename the column created by changing the M code from:
=
Table.CombineColumns(#"Extract data for CHI",{"Latest population
census", "Population census
notes"},Combiner.CombineTextByDelimiter("",
QuoteStyle.None),"Population census notes.1")
to:
= Table.CombineColumns(#"Extract
data for CHI",{"Latest population census", "Population
census notes"},Combiner.CombineTextByDelimiter("",
QuoteStyle.None),"Population census notes")
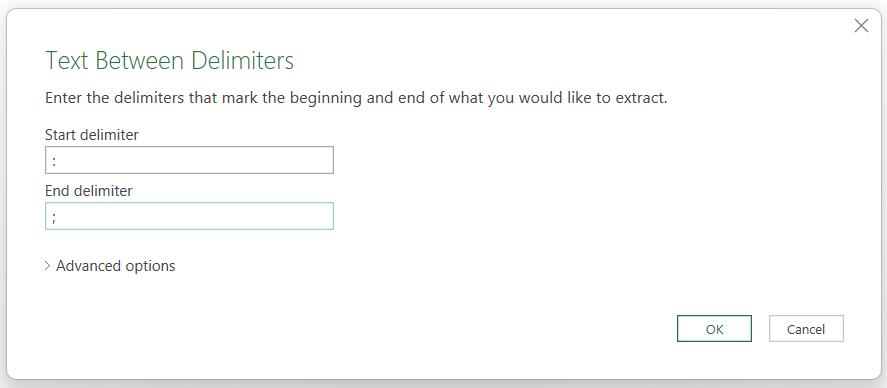
Now, I need to recreate Latest population census. I can do this from the ‘Add Column’ tab, where I can extract the data using ‘Text Between Delimiters’ on the ‘Extract’ dropdown:
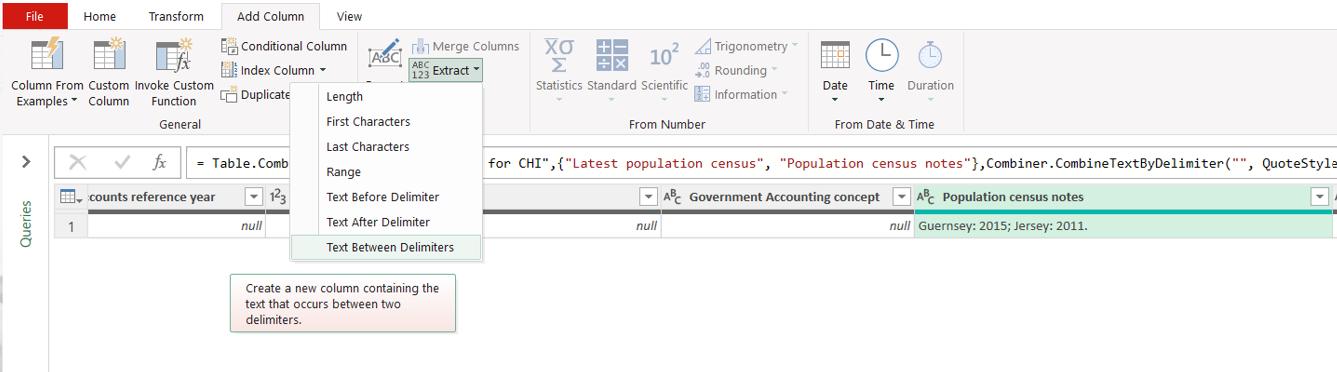
I enter delimiters ‘: ‘ (note the trailing space) and ‘;’:
This gives me the year:

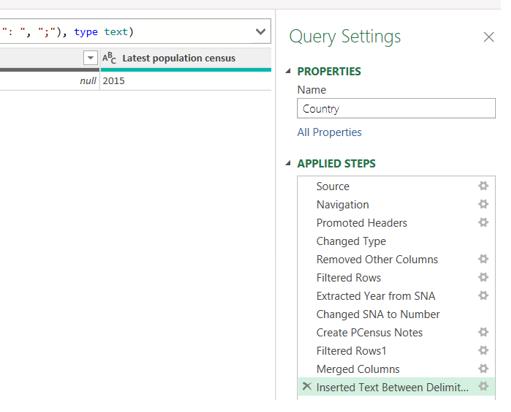
I had no option to define the column name, so I amend the step from:
= Table.AddColumn(#"Merged Columns", "Text Between
Delimiters", each Text.BetweenDelimiters([Population census notes],
": ", ";"), type text)
to:
= Table.AddColumn(#"Merged Columns", "Latest population
census", each Text.BetweenDelimiters([Population census notes], ":
", ";"), type text)
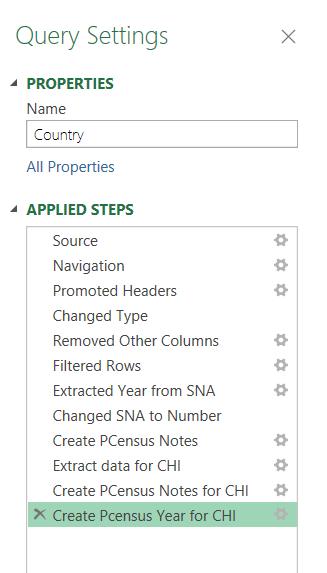
I need to rename the steps (simply right-click and ‘Rename’) to make them easier to follow:
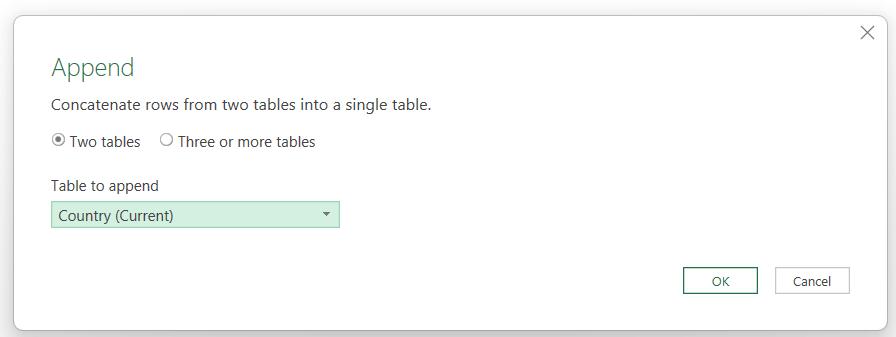
Now to add this to the rest of the data. I can use ‘Append Queries’ from the Home tab:
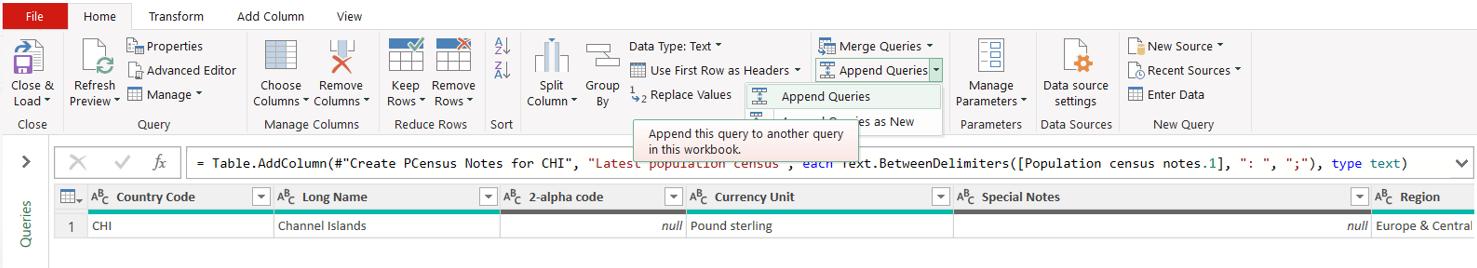
I choose to append the current query to itself: I will amend this step once I have the M code:
This gives me the ‘Append Query’ step:
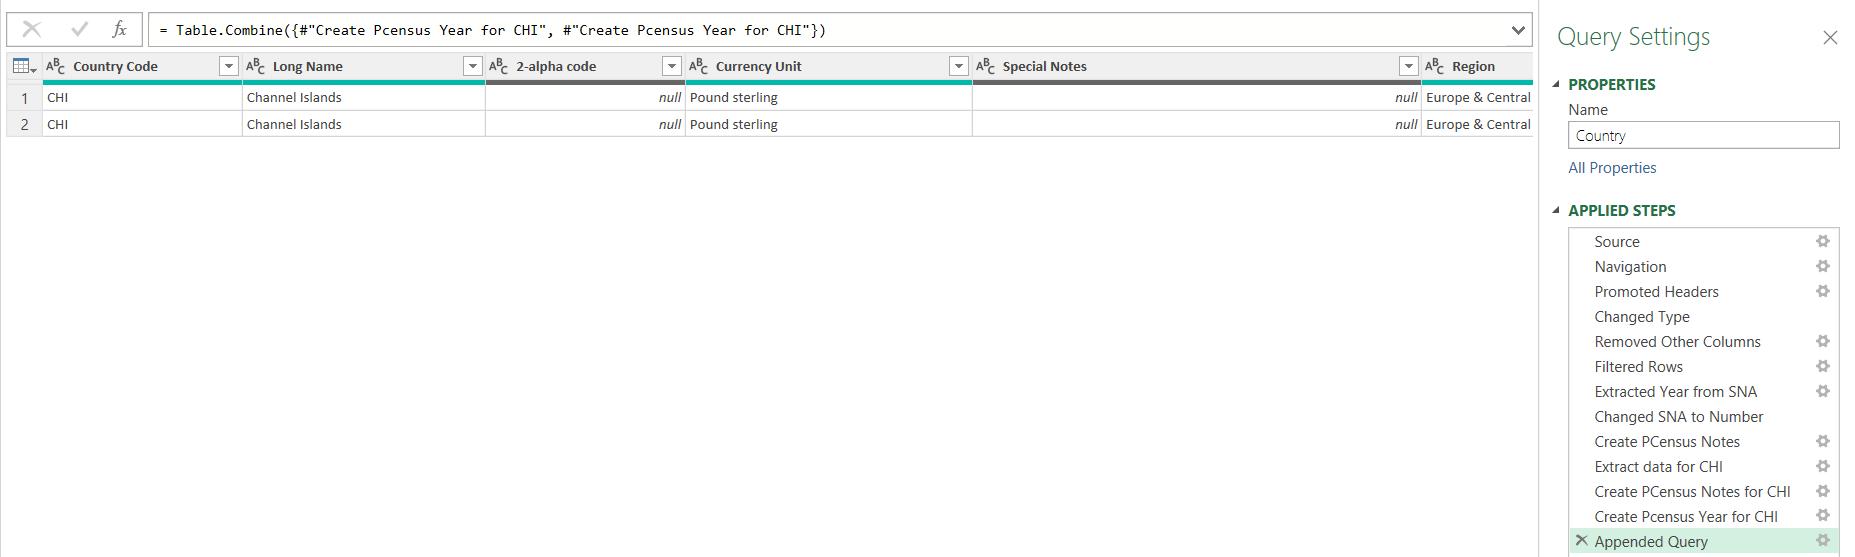
I change the M code from:
= Table.Combine({#"Create Pcensus Year for CHI",
#"Create Pcensus Year for CHI"})
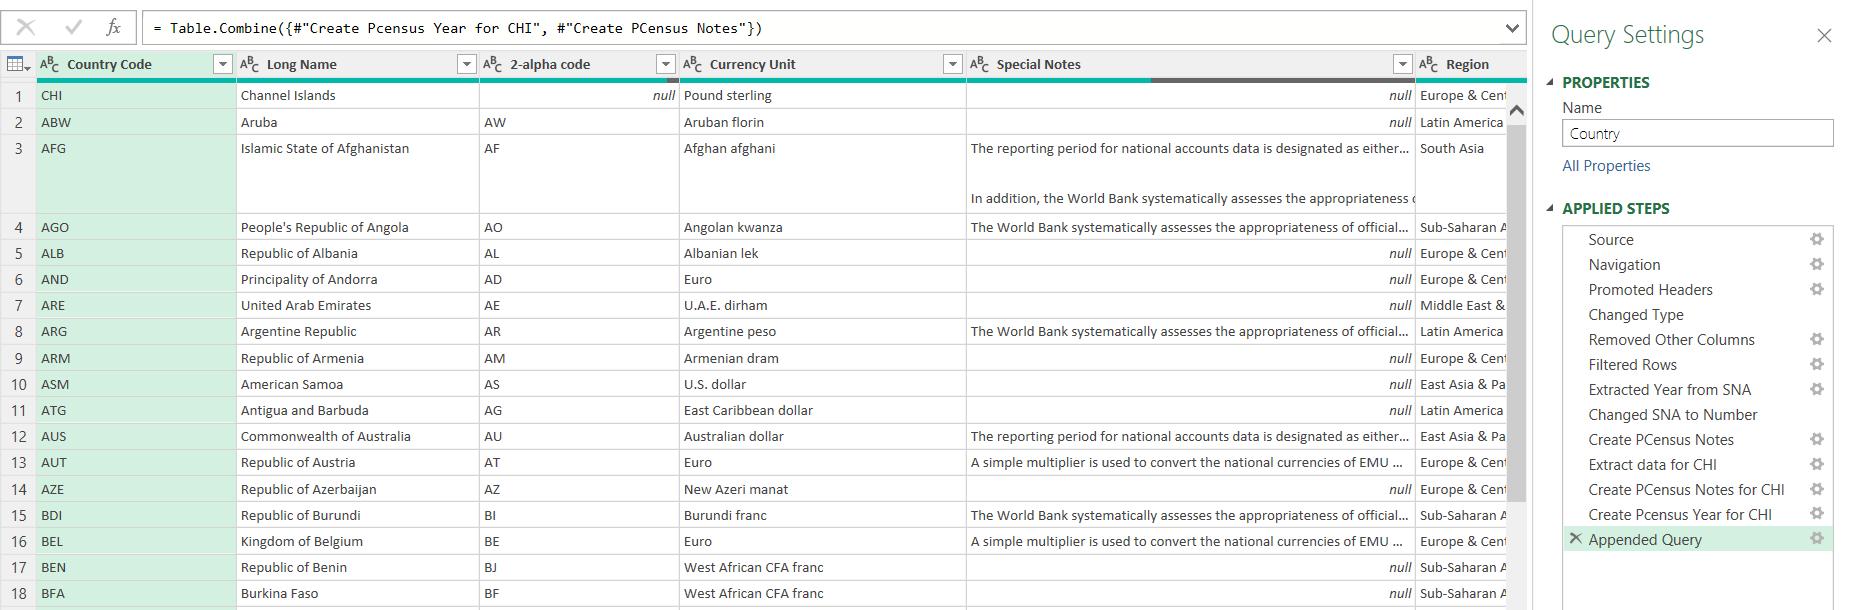
to:
= Table.Combine({#"Create Pcensus Year for CHI",
#"Create PCensus Notes"})
This appends this line of data to the rest of the country data which is in the ‘Create PCensus Notes’ step:
This means I have two [2] rows for Country Code ‘CHI’. There are several ways I could select the correct row. I choose to change the data type for column Latest population census to ‘Whole Number'.
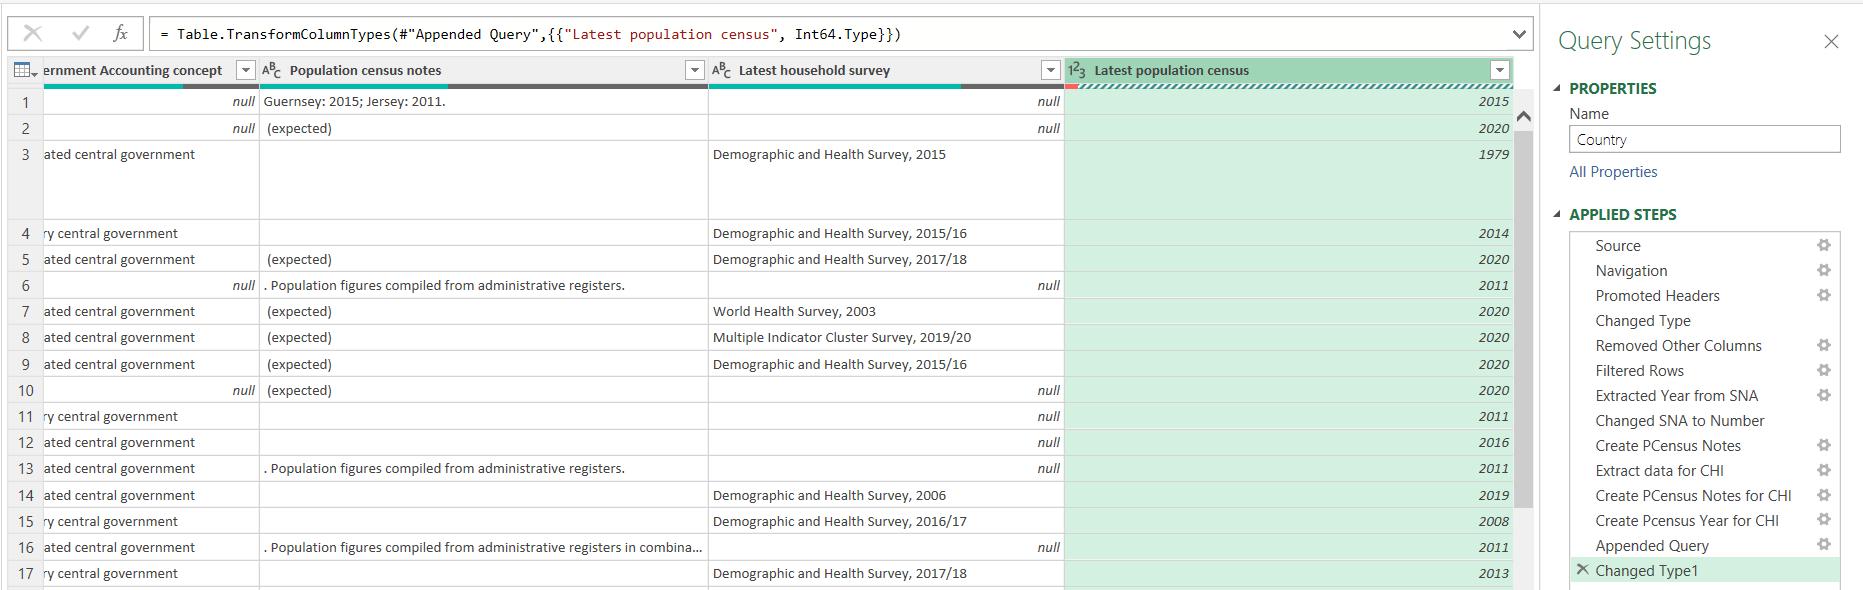
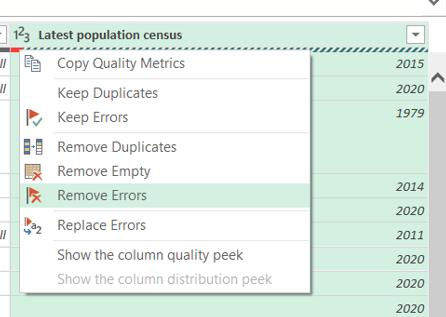
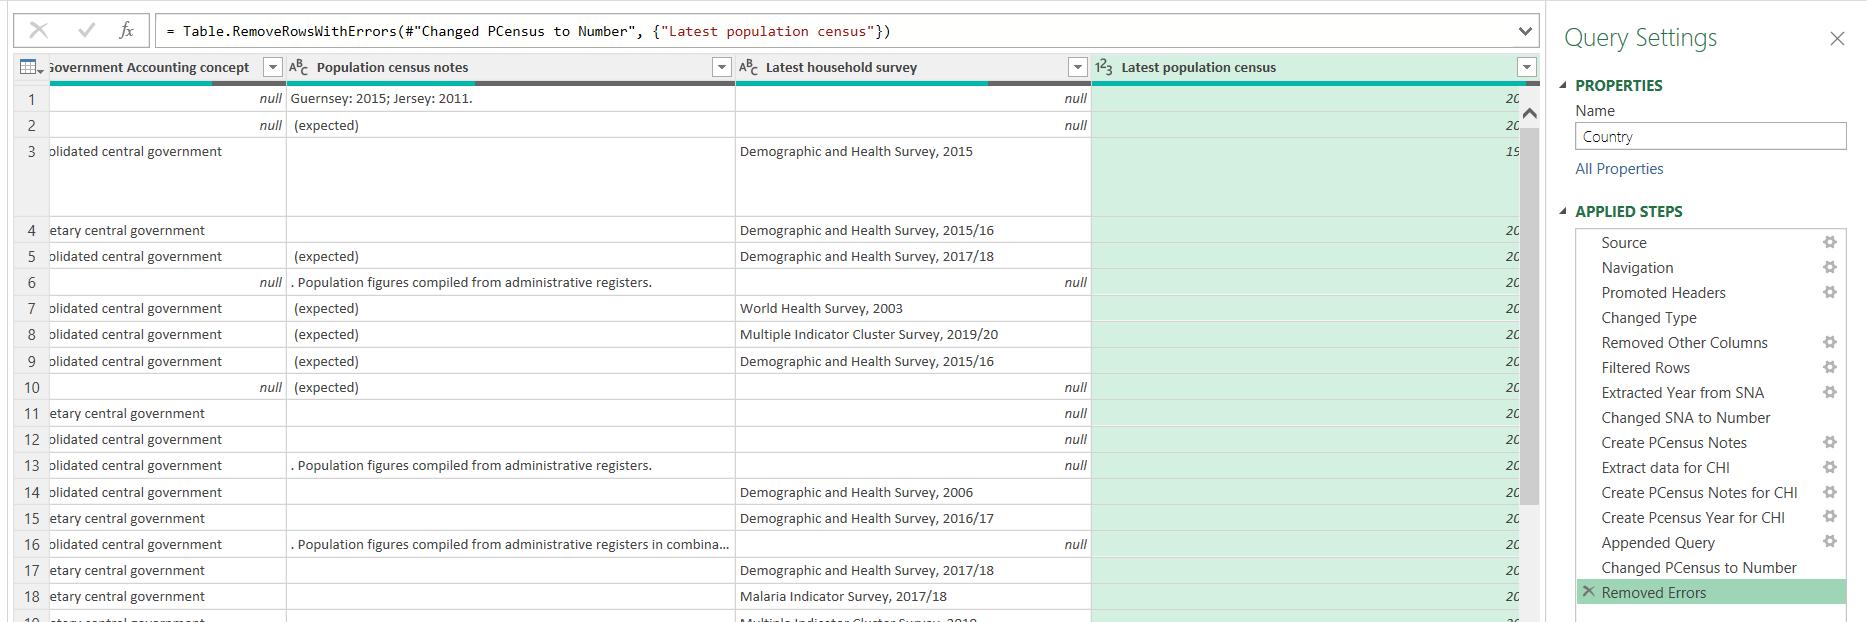
Note the red on the bar under Latest population census. This means I have an error, which is the original ‘CHI’ row. I can right-click on the ‘Column quality’ bar and choose to ‘Remove Errors’:
This gets rid of the extra row, and I rename the ‘Changed Type1’ step:
Next time, I’ll continue transforming the remaining columns.
Come back next time for more ways to use Power Query!