
Power Query: Revision Time – Part 2
17 April 2024
Welcome to our Power Query blog. Today, I continue to create a refreshable revision timetable by calculating the number of subjects to be studied.
As my salespeople take a well-earned break, many students here in the UK are preparing for exams in the summer. To help my own offspring get organised, I volunteered to create a refreshable printable revision timetable. This is the result:

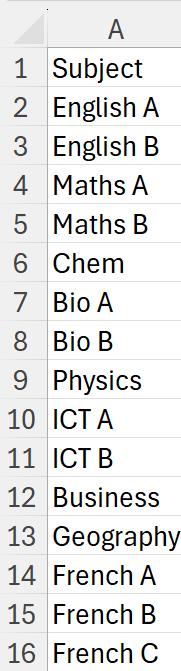
I needed a list of topics, and to begin with, I created extra entries for topics that required more timeslots:
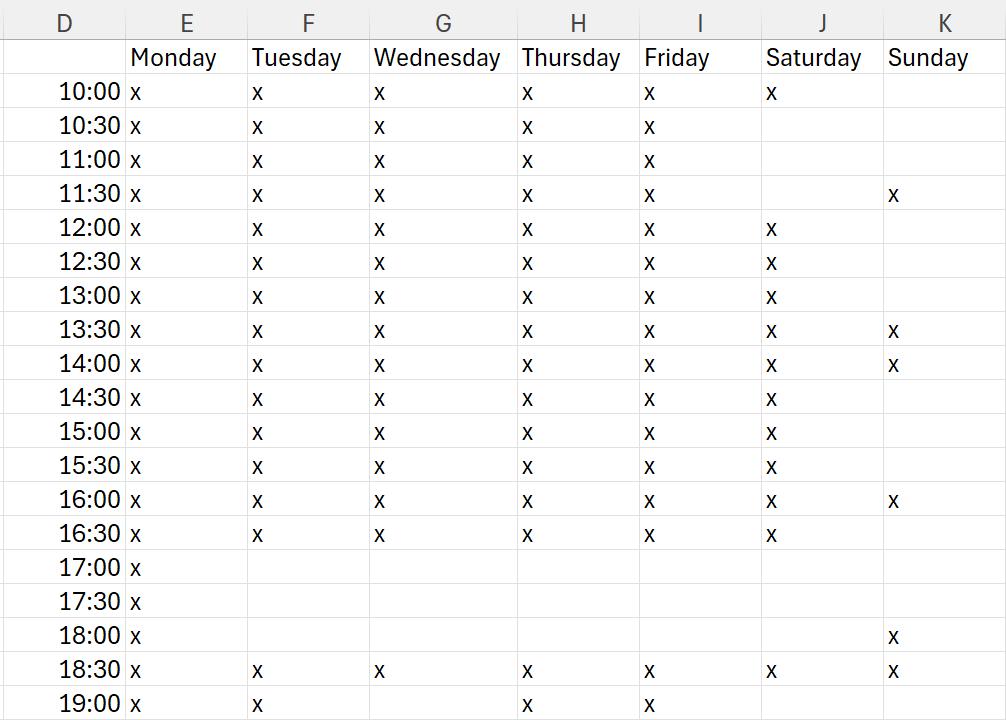
We agreed on half-hourly slots, and I created a grid so that my daughter could indicate the slots that she wouldn’t be able to revise.
When I first designed the solution, I included some Excel functions, but since this is a Power Query blog, I will ensure that I only use Power Query functions (apart from some formatting at the end!).
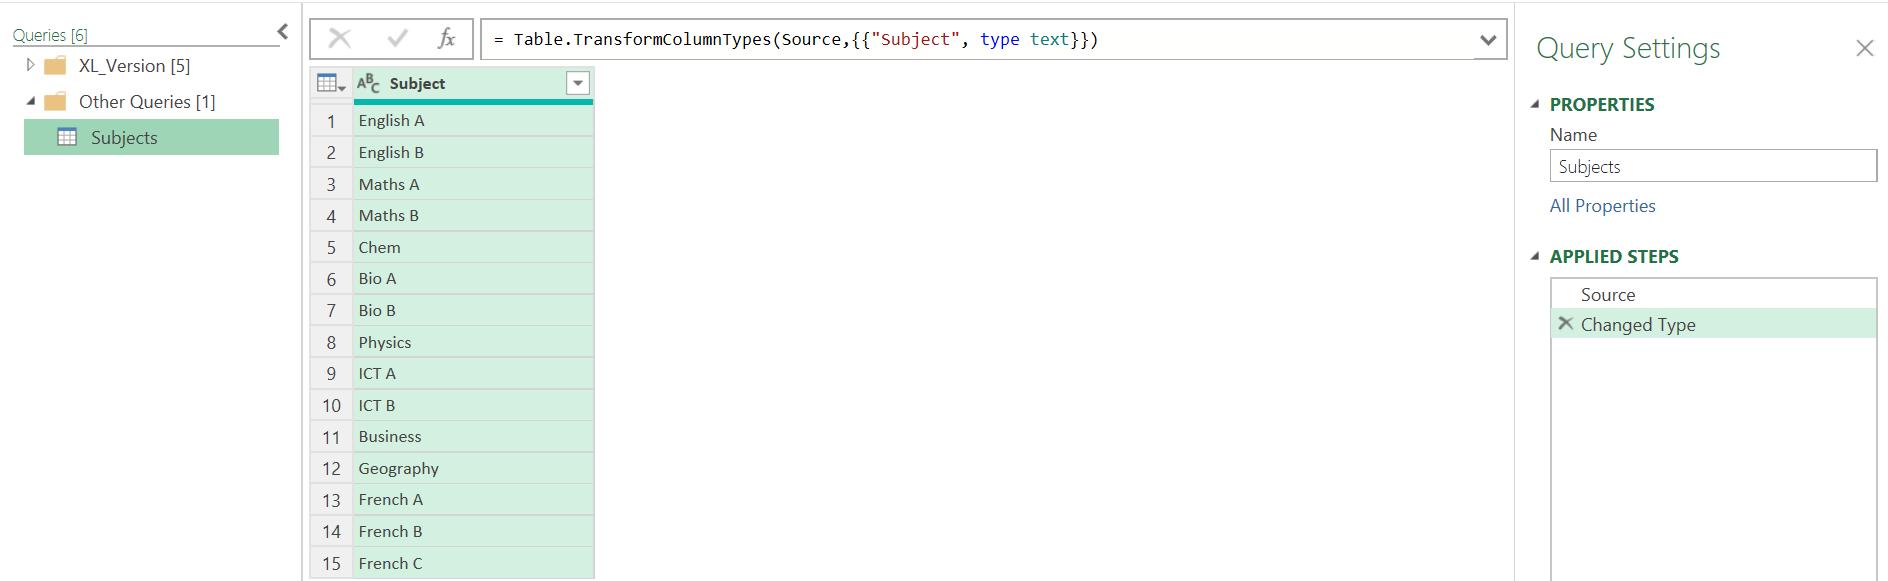
Last time, I converted my data into two [2] Tables: Subjects and Availability. I extracted Subjects to Power Query.
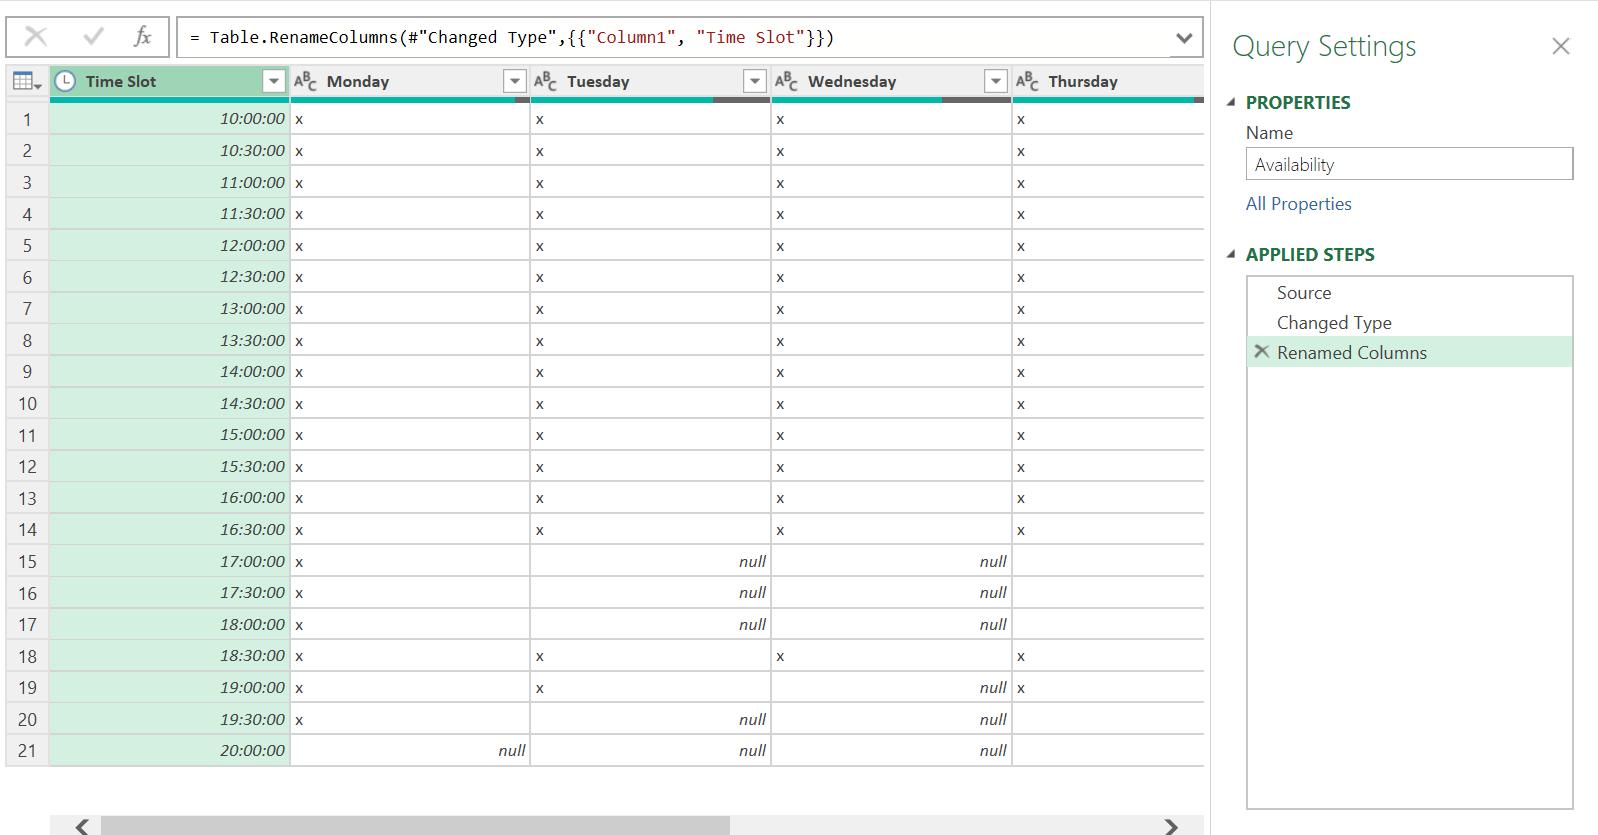
I created the Availability query by taking a copy of Subjects, and amending it:
Now I have the subject and slot information, I need to perform some basic calculations. I could have performed this in Excel, but as this is a Power Query blog, I will be using M here.
The first number I need is the number of subjects. An easy way to calculate this begins with taking a reference copy of the Subjects query:
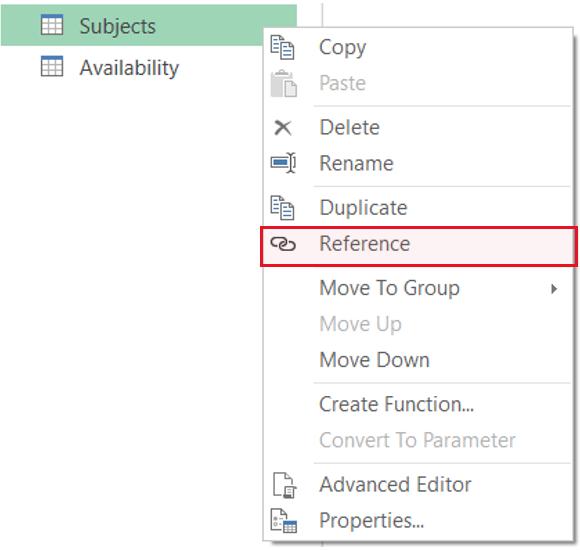
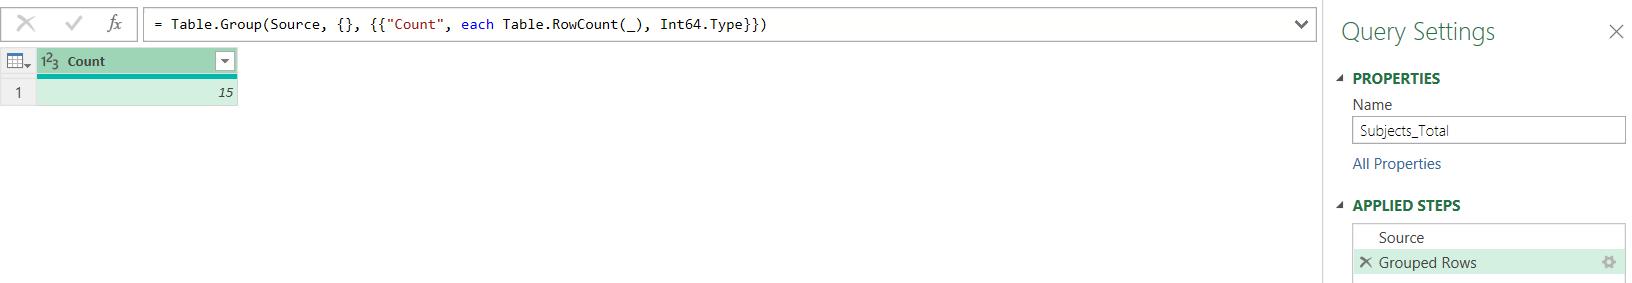
Using a reference copy means my new query will be updated if Subjects changes. I name my new query ‘Subjects_Total’ and select the ‘Group By’ functionality from the Home tab:
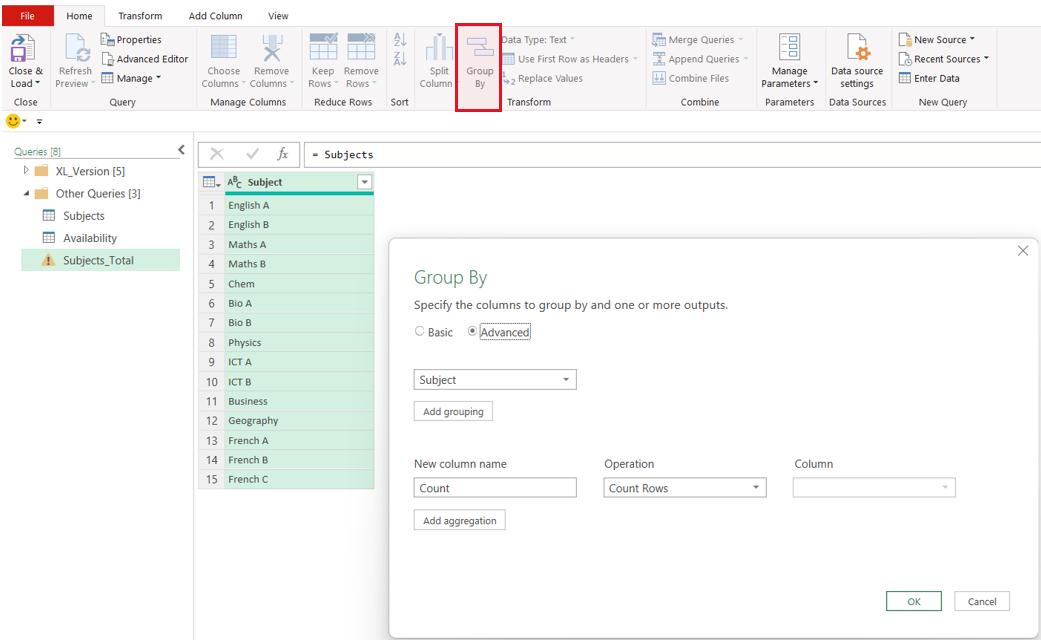
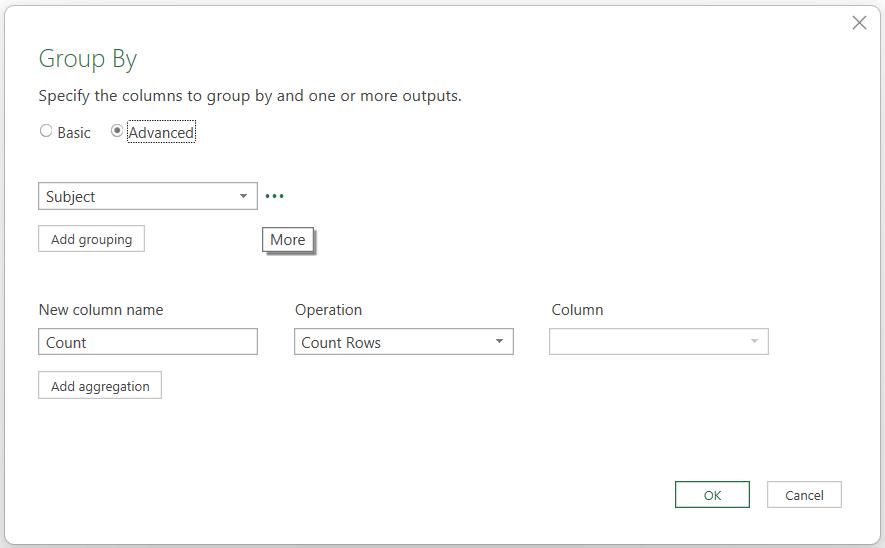
I have selected the Advanced options. Although the defaults in the aggregation section are correct in that I do wish to count rows, I do not want to group them by Subject. If I hover the cursor to the right of the grouping section, I have more options in Advanced mode:
In particular, I may delete the grouping:
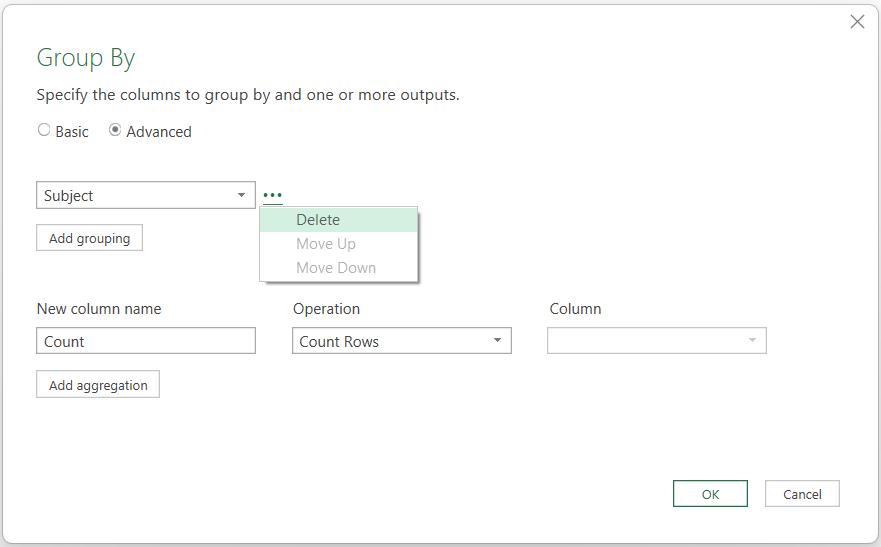
I choose to do this, and then click OK:
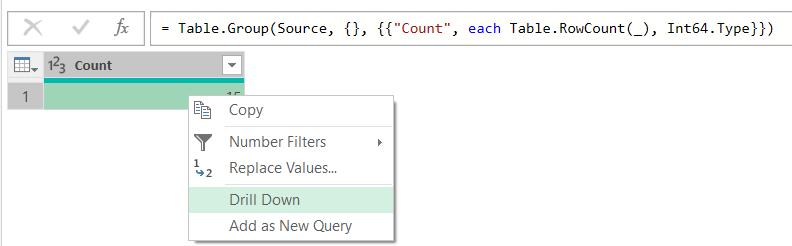
To access the number in the cell, I click in the cell and right-click to ‘Drill down’:
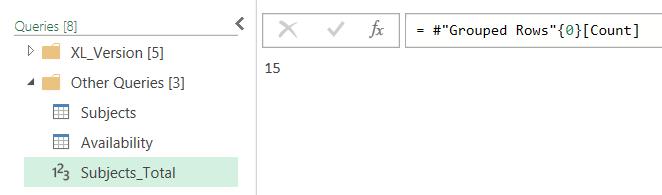
This gives me a query consisting of a number:
Calculating the number of slots on Availability will require a difference approach, since I need to consider the values in multiple columns:
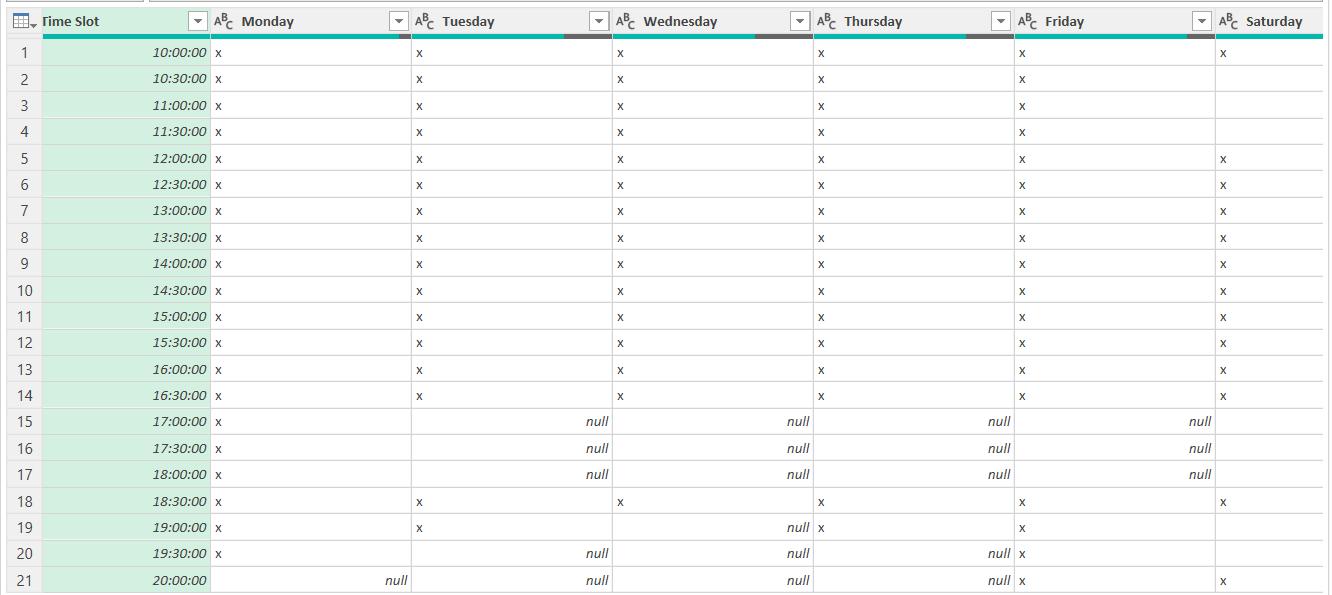
I will describe a method to achieve this next time.
Come back next time for more ways to use Power Query!