
Power Query: Web Grouping
8 February 2023
Welcome to our Power Query blog. This week, I investigate grouping queries in Excel for the Web.
The grouping functionality may be helpful when I have a large and diverse data set loaded to Power Query. Whilst I can group my queries in Excel offline, this week I’m going to take a look at what is available when I am working with Excel for the Web.
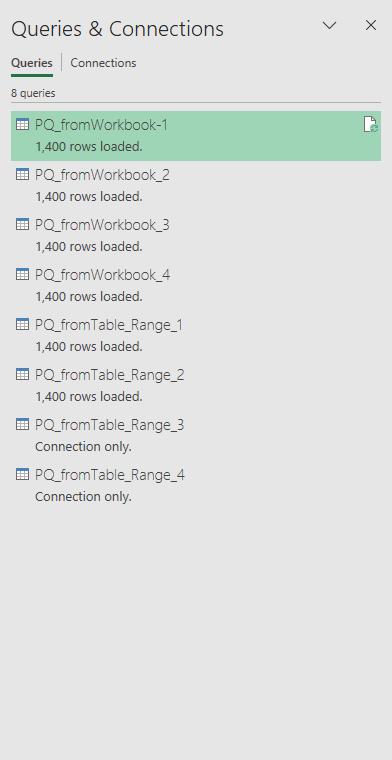
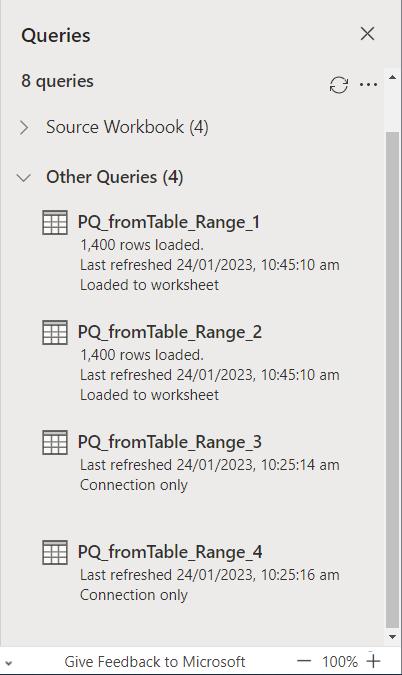
Since I can’t currently create queries in Excel for the Web, I will use an Excel file that I have created in Excel offline, which is packed with queries! I have the following eight [8] queries loaded, as I can see in Excel offline:
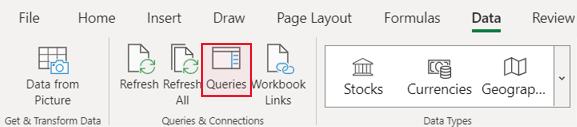
In Excel Online, I access the same file. On the Data tab, I choose ‘Queries & Connections’ and there I click the Queries button.
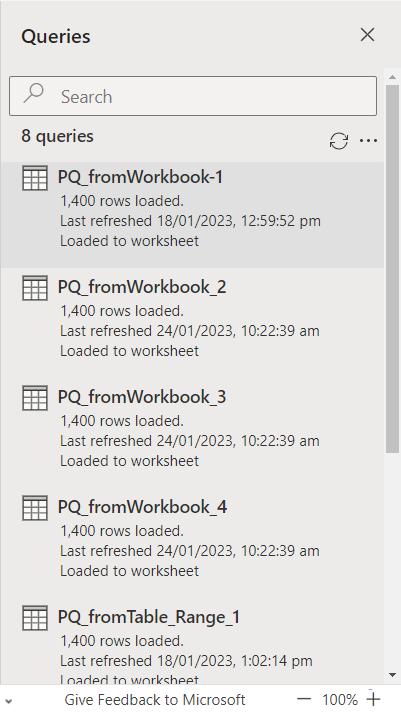
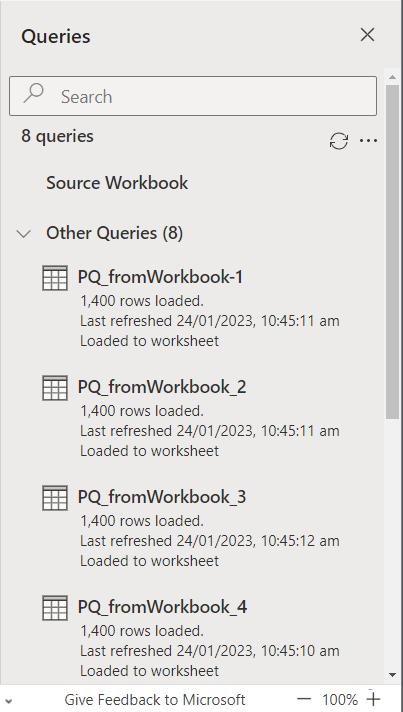
This opens the Queries pane, where I see all the queries:
I click the three [3] dots symbol […] to see the options available:
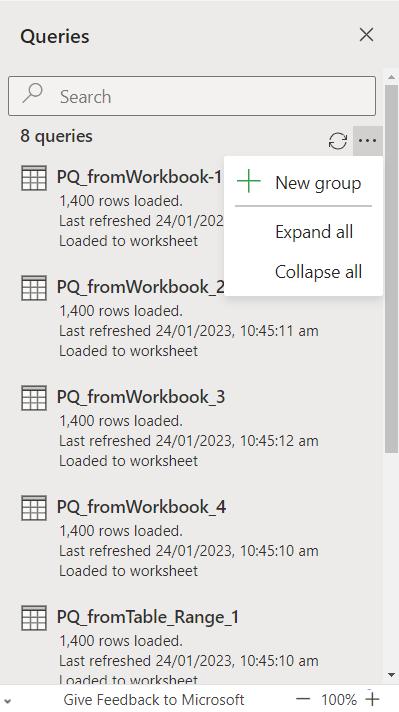
When I click on ‘New group’ the following dialog appears:
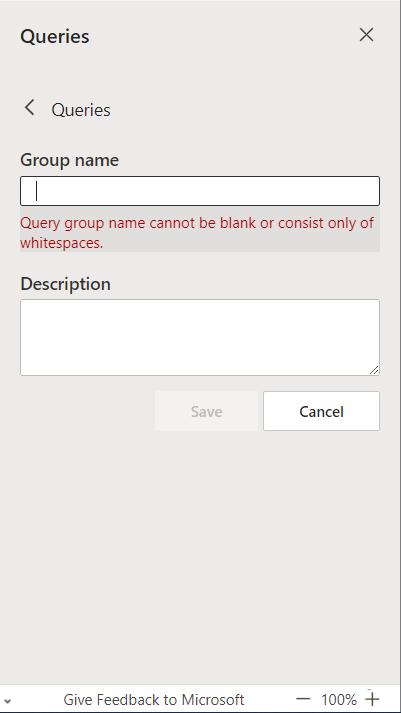
I can enter the name and the description of the group here:
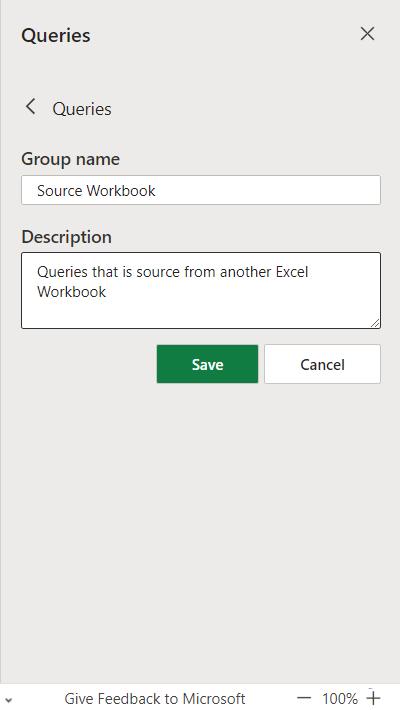
I click Save and my group is ready to use:
To see how to add a query to the new group, I hover my mouse over the query I want to add. If I hover over the ellipsis / three dots symbol, ‘More Options’ will appear next to my query:
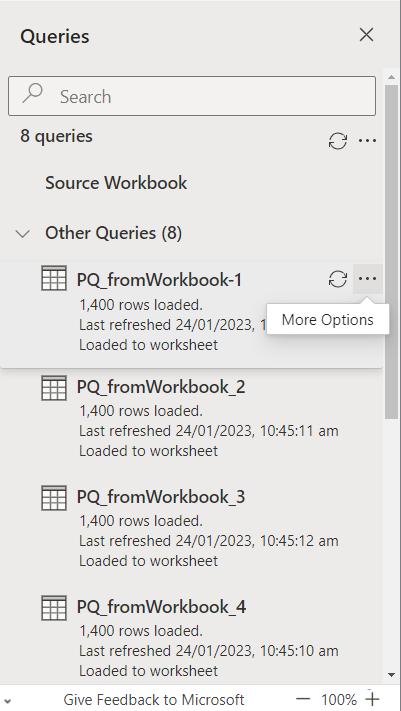
Then, I click on it and select ‘Move to group’, choosing the group I just created. This query is now in the Source Workbook group. I repeat the process for other three [3] similar queries:
I also create another group for the queries have been created from an Excel Table or range, and put the related queries in that group:
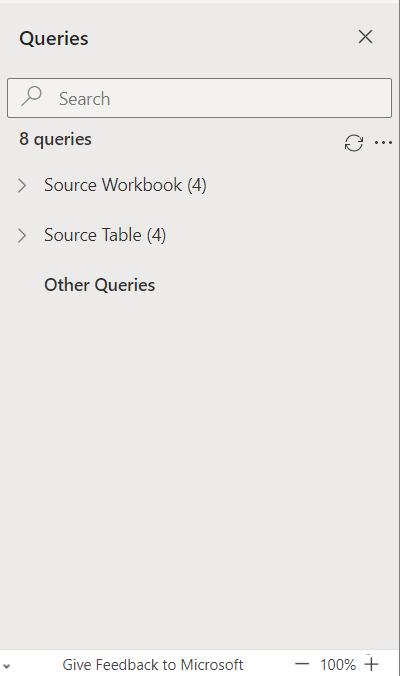
Similar to Power Query for Excel offline, the number of queries in the group appears next to the group name, and once I create one group, the ‘Other Queries’ group is created automatically. ‘Other Queries’ is where the ungrouped queries appear. Since I have grouped all my queries, no number appears next to the ‘Other Queries’ group title because it is empty.
Come back next time for more ways to use Power Query!