Please note javascript is required for full website functionality.

Charts And Dashboards Blogs

Charts And Dashboards Blogs

Charts and Dashboards: A Quick Look at Analysis

12 August 2022

Welcome back to our Charts and Dashboards blog series. This week, I look at the Quick Analysis tool.


Charts and Dashboards: Recommended Charts

5 August 2022

Welcome back to our Charts and Dashboards blog series. This week, we’ll look at Excel’s recommended charts.


Charts and Dashboards: Graphing Missing Data

22 July 2022

Welcome back to our Charts and Dashboards blog series. This week, we’ll consider approaches we can take when we are missing data.


Charts and Dashboards: Braving the Elements

15 July 2022

Welcome back to our Charts and Dashboards blog series. This week, I take a closer look at the elements of a chart.


Charts and Dashboards: Surface Charts

8 July 2022

Welcome back to our Charts and Dashboards blog series. This week, I look at surface charts.


Charts and Dashboards: Data Tables - Part 5

1 July 2022

Welcome back to our Charts and Dashboards blog series. This week, we’re going to cover how to create Data Tables on different sheets than the inputs that they’re referring to.


Charts and Dashboards: Data Tables - Part 4

17 June 2022

Welcome back to our Charts and Dashboards blog series. This week, we’re going to cover why Data Table inputs should always be hard coded.


Charts and Dashboards: Data Tables - Part 3

10 June 2022

Welcome back to our Charts and Dashboards blog series. This week, we’ll take a look at two-dimensional Data Tables.


Charts and Dashboards: Data Tables - Part 2

3 June 2022

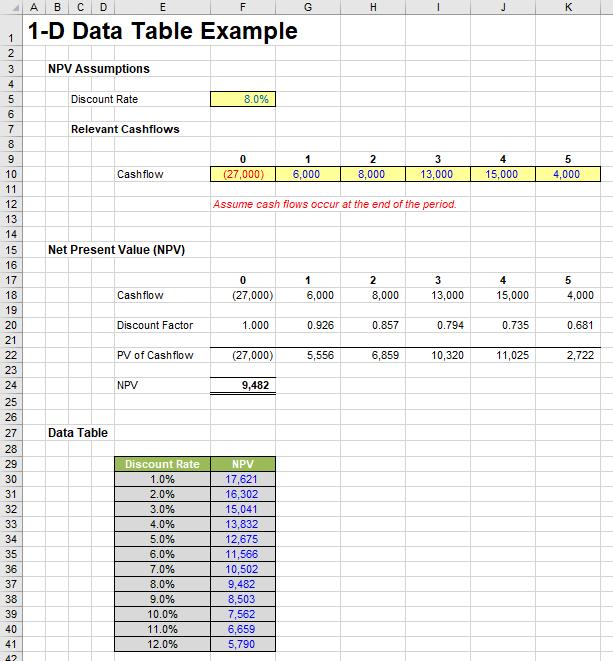
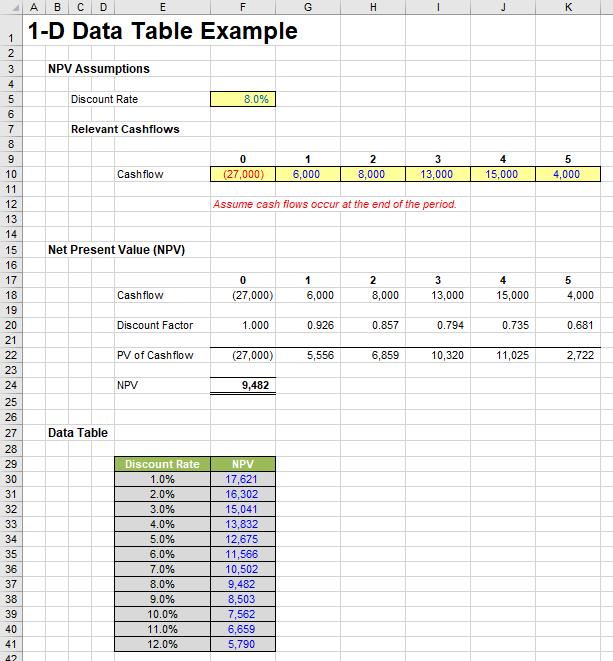
Welcome back to our Charts and Dashboards blog series. This week, we’ll go step-by-step through the process of constructing a one-dimensional Data Table.


Charts and Dashboards: Data Tables - Part 1

20 May 2022

Welcome back to our Charts and Dashboards blog series. This week, we’ll cover the uses and types of Data Tables.


Newsletter