Please note javascript is required for full website functionality.

Blog

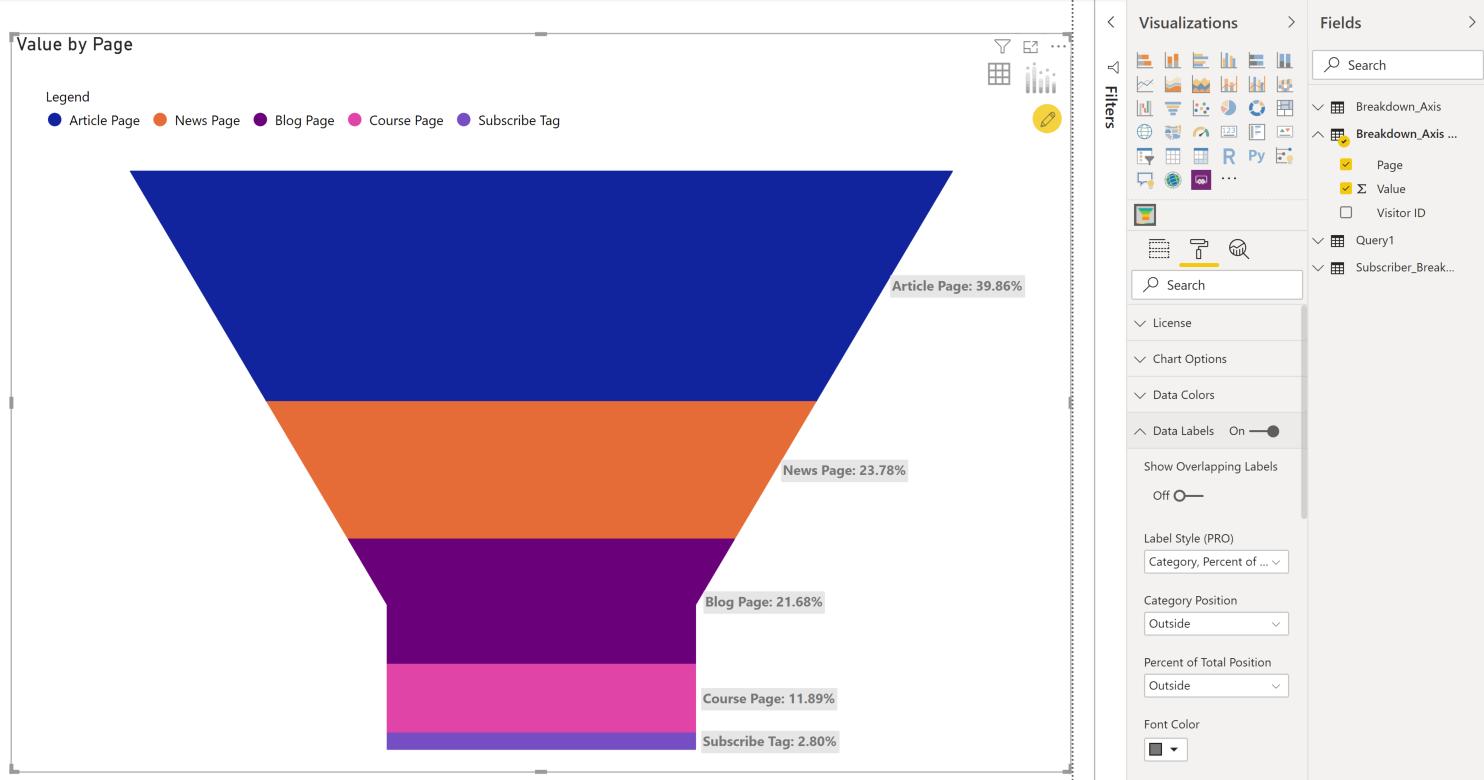
Power Query: Mind the Overlap

17 June 2020

Welcome to our Power Query blog. This week, I look at a method to spot overlapping periods.


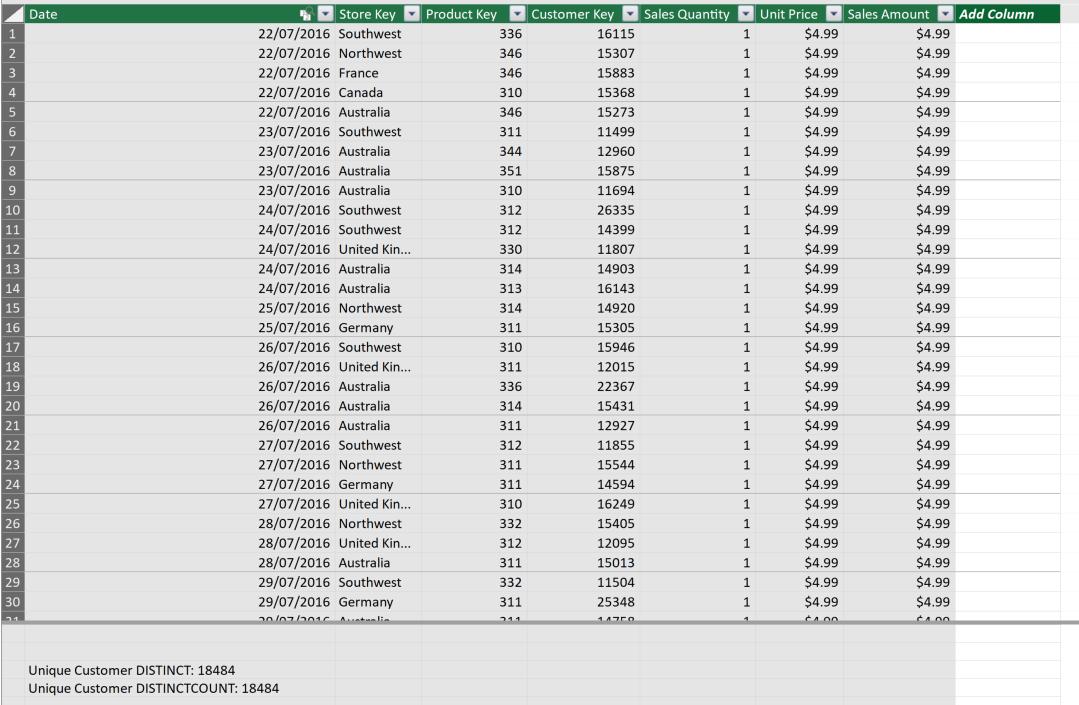
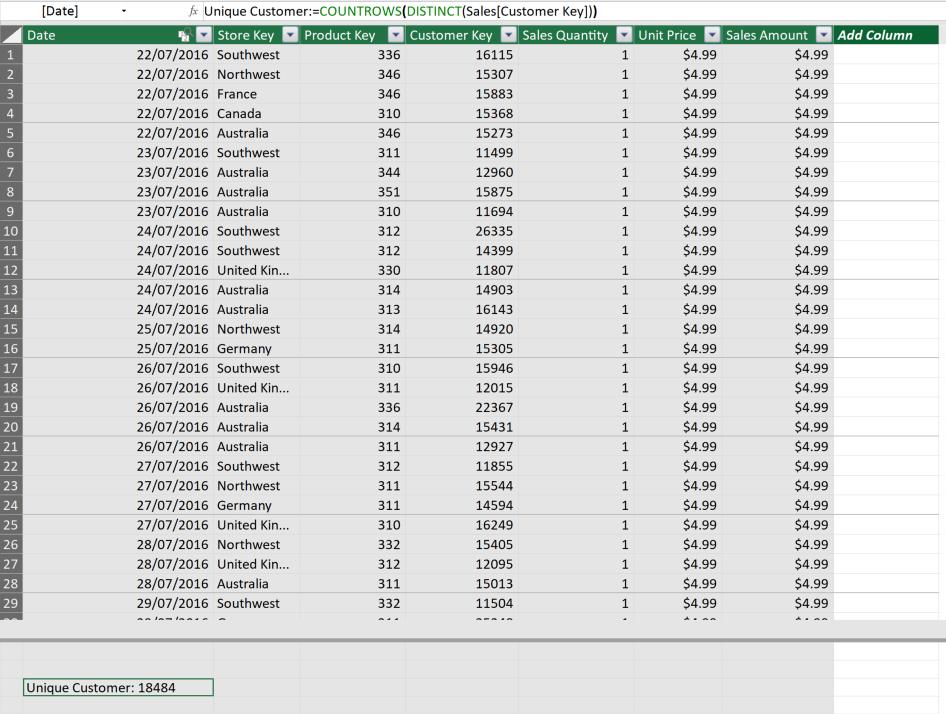
Power Pivot Principles: DISTINCT vs. DISTINCTCOUNT

16 June 2020

Welcome back to the Power Pivot Principles blog. This week, we will consider the differences between the DISTINCT and DISTINCTCOUNT functions in DAX.


A to Z of Excel Functions: The IMABS Function

15 June 2020

Welcome back to our regular A to Z of Excel Functions blog. Today we look at the IMABS function.


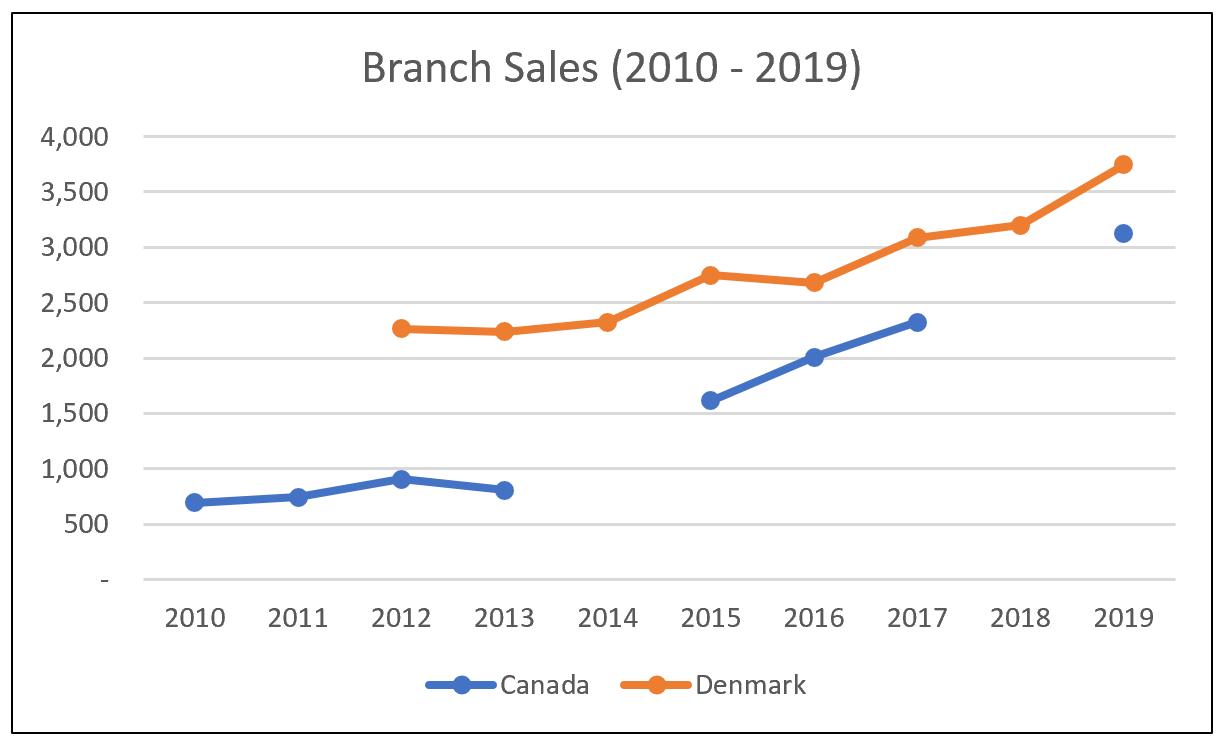
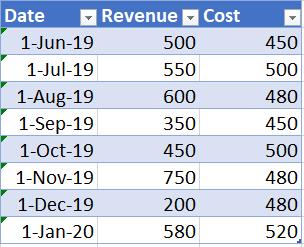
Charts and Dashboards: Hiding Data - Part 1

12 June 2020

Welcome back to this week’s Charts and Dashboards blog series. This week, let’s talk about how we can hide one or more data points in a chart.


Power BI Blog: Conditionally Formatting Negative Numbers

11 June 2020

Welcome back to this week’s edition of the Power BI blog series. This week, we take a look at how to apply conditional formatting to negative numbers.


Power Query: Missing in Transformation

10 June 2020

Welcome to our Power Query blog. This week, I look at a method to make column transformations more dynamic.


Power Pivot Principles: Introducing the DISTINCT function

9 June 2020

Welcome back to the Power Pivot Principles blog. This week, we will talk about the DISTINCT function in DAX.


A to Z of Excel Functions: The IFS Function

8 June 2020

Welcome back to our regular A to Z of Excel Functions blog. Today we look at the IFS function.


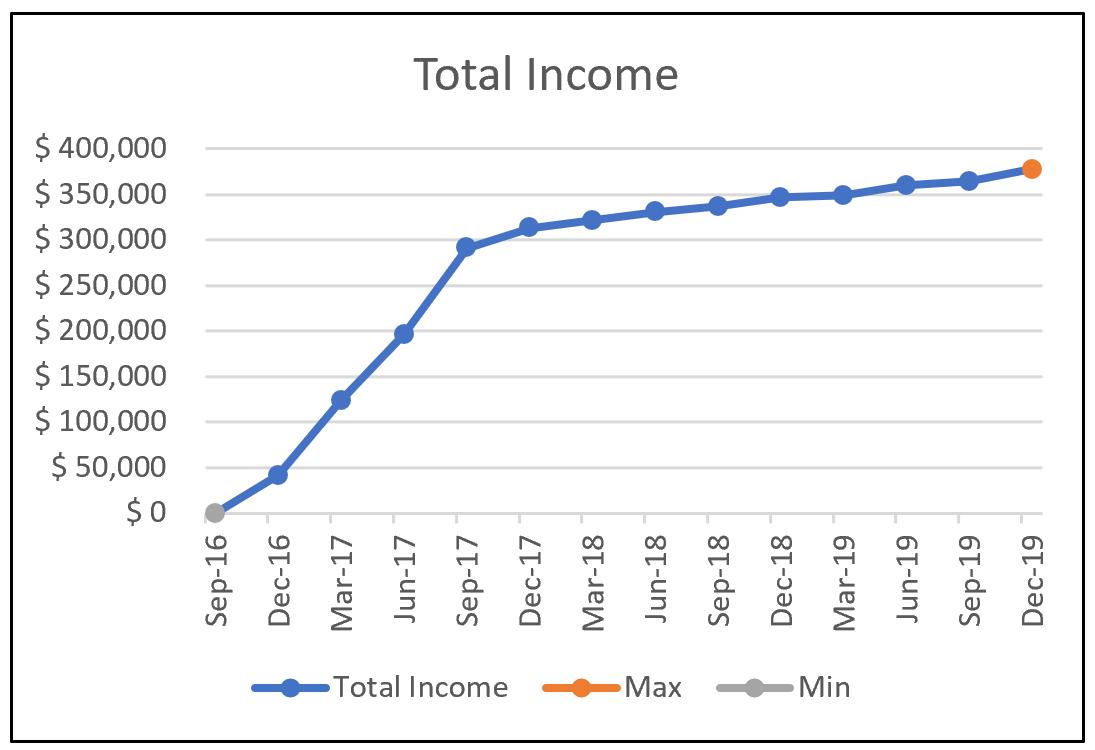
Charts and Dashboards: Highlighting Data

5 June 2020

Welcome back to this week’s Charts and Dashboards blog series. This week, let’s talk about how we can highlight one or more data points in a chart.


Power BI Blog: Custom Visualizations; Funnel/Pyramid Chart Formatting

4 June 2020

Welcome back to this week’s edition of the Power BI blog series. This week, we take a look at formatting a custom visualisation, namely the Funnel Chart by xViz


Newsletter