Please note javascript is required for full website functionality.

Blog

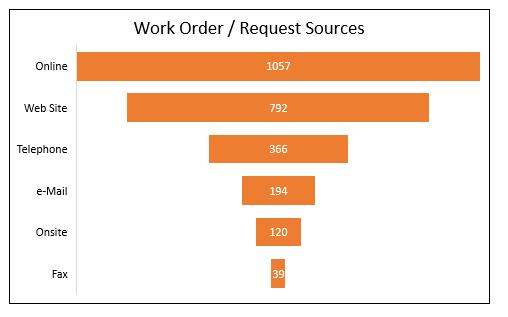
Charts and Dashboards: Funnel Charts

10 April 2020

Welcome back to this week’s Charts and Dashboards blog series. This week, let’s look at Funnel Charts.


Charts and Dashboards: Introducing the Camera Tool for Dashboards

9 April 2020

Welcome back to this week’s Charts and Dashboards blog series. This week, we will introduce a handy tool when creating dashboards – Excel’s Camera tool.


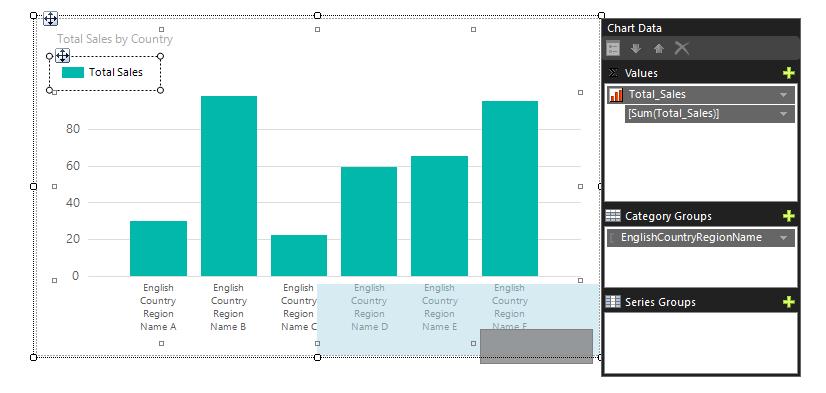
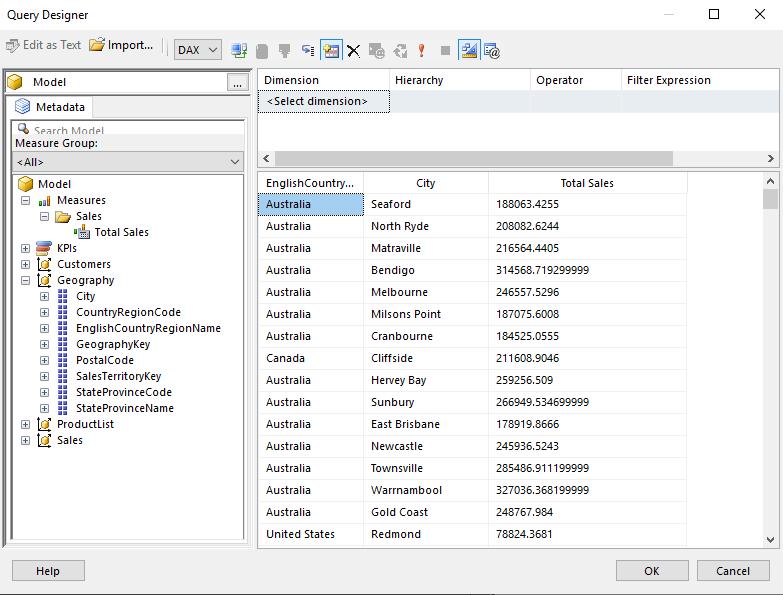
Power BI Blog: Power BI Report Builder – Part 5

9 April 2020

Welcome back to this week’s edition of the Power BI blog series. This week, we take a look at how to format built charts in the Power BI Report Builder.


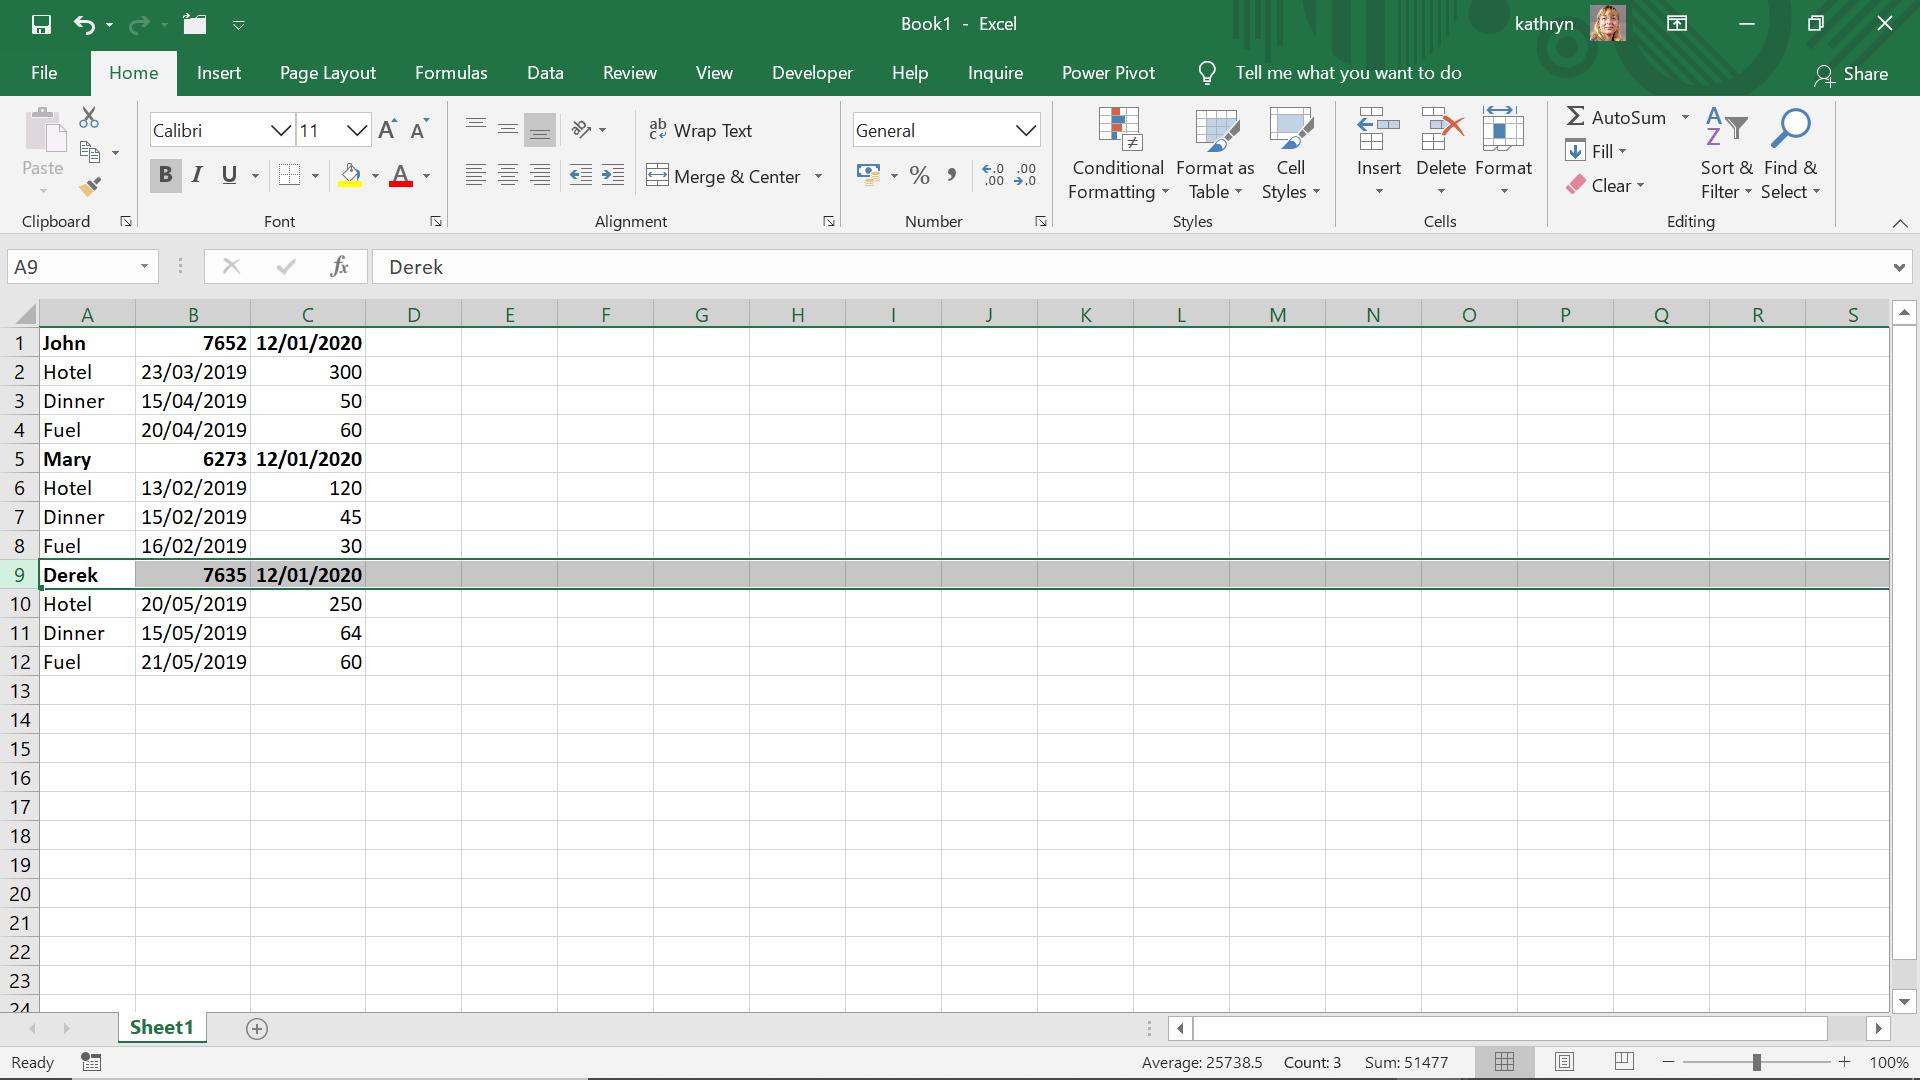
Power Query: Table of Tables

8 April 2020

Welcome to our Power Query blog. This week, I look at how to reformat a table of data which is made up of sub-tables.


Power Pivot Principles: Introducing the Function FIRSTNONBLANK

7 April 2020

Welcome back to the Power Pivot Principles blog. This week, we are going to learn a new DAX function, FIRSTNONBLANK.


A to Z of Excel Functions: The HEX2OCT Function

6 April 2020

Welcome back to our regular A to Z of Excel Functions blog. Today we look at the HEX2OCT function.


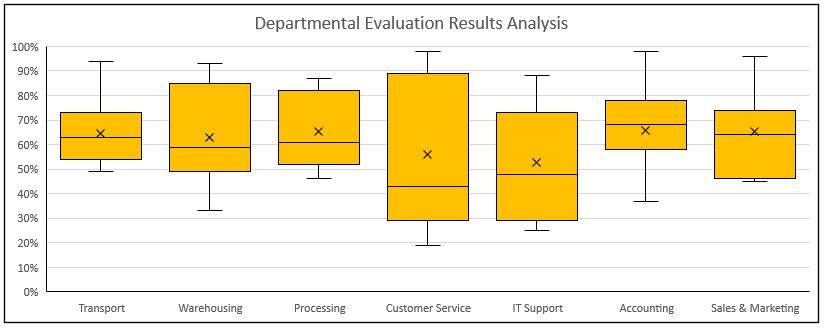
Charts and Dashboards: Box and Whisker Charts

3 April 2020

Welcome back to this week’s Charts and Dashboards blog series. This week, let’s look at Box and Whisker Chart.


Power BI Blog: Power BI Report Builder – Part 4 (Creating Charts)

2 April 2020

Welcome back to this week’s edition of the Power BI blog series. This week, we look at how to create charts in the Power BI Report Builder.


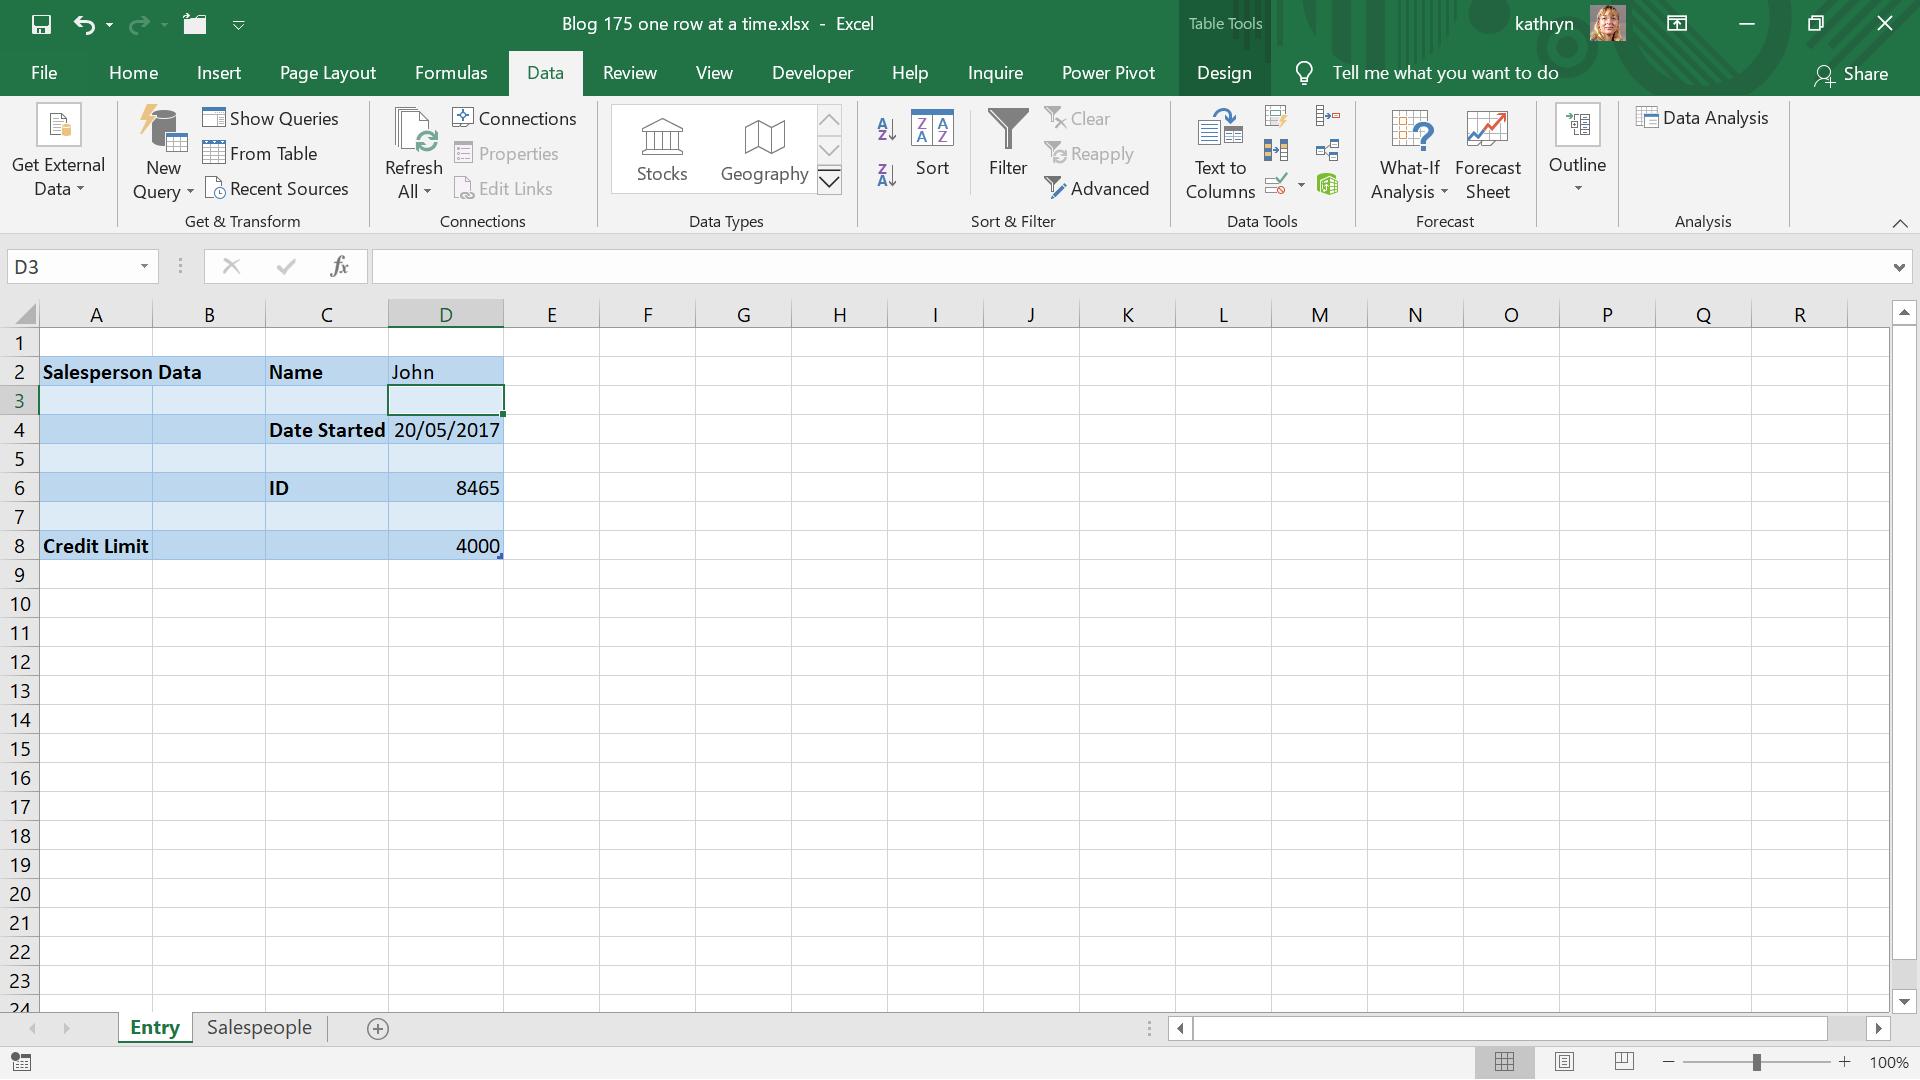
Power Query: Row by Row

1 April 2020

Welcome to our Power Query blog. This week, I look at how to add a table of data to an existing query.


Power Pivot Principles: Using USERELATIONSHIP to Activate an Inactive Relationship

31 March 2020

Welcome back to the Power Pivot Principles blog. This week, we are going to learn a method of creating a virtual relationship in Power Pivot.


Newsletter