
Power Bi Blog
Power BI Blog: Custom Visuals – the Hierarchy Tree
13 February 2020
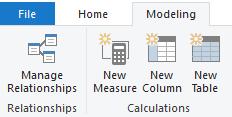
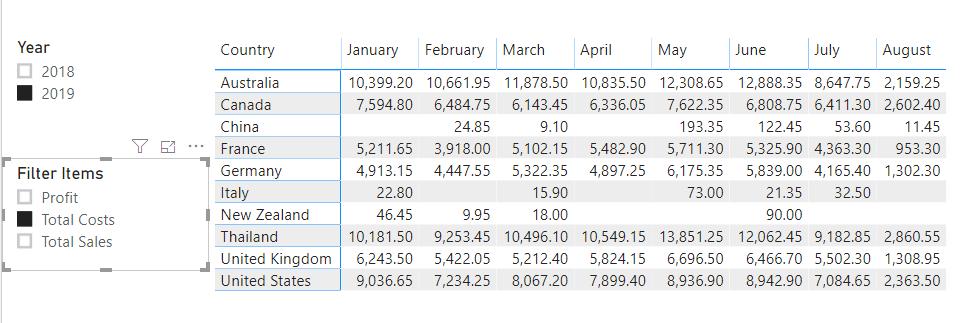
Power BI Blog: Creating Summary Tables in Power BI
30 January 2020
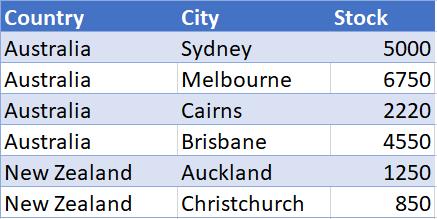
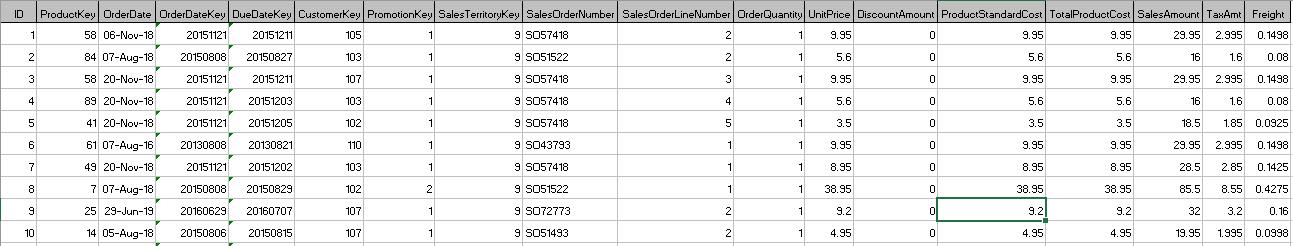
Power BI Blog: Creating Tables in Power BI
23 January 2020
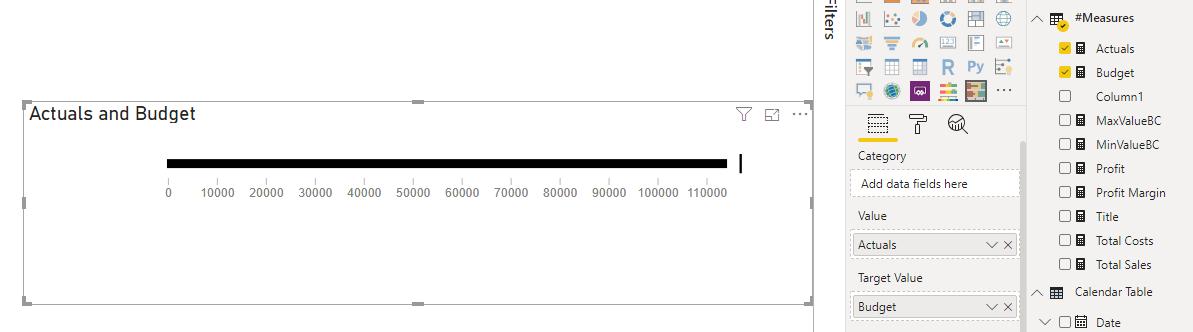
Power BI Blog: Bullet Charts
16 January 2020
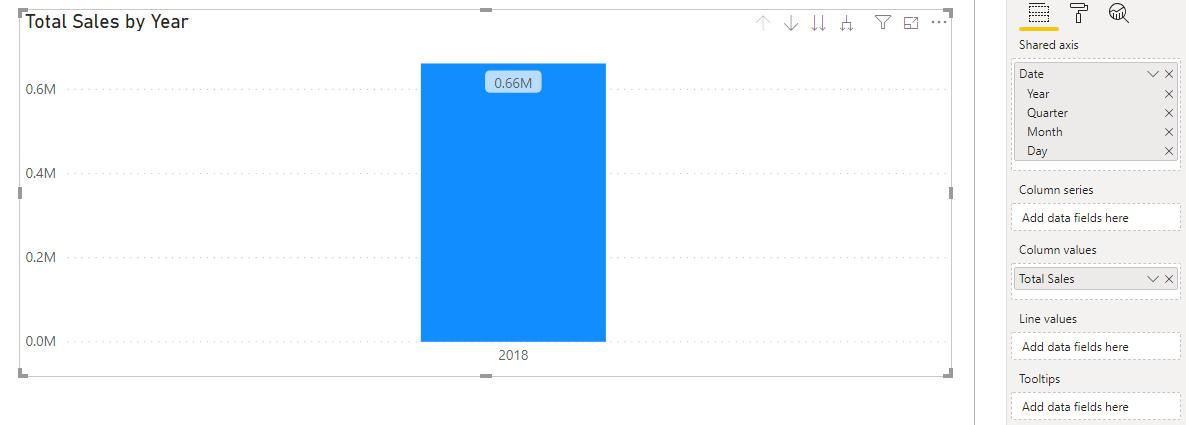
Power BI Blog: Combo Charts
9 January 2020
Power BI Blog: Dynamic Visualisation Titles
2 January 2020
Power BI Blog: Presenting Several Measures on a Single Visualisation
26 December 2019

Power BI Blog: Creating a Dynamic Calendar Table
19 December 2019
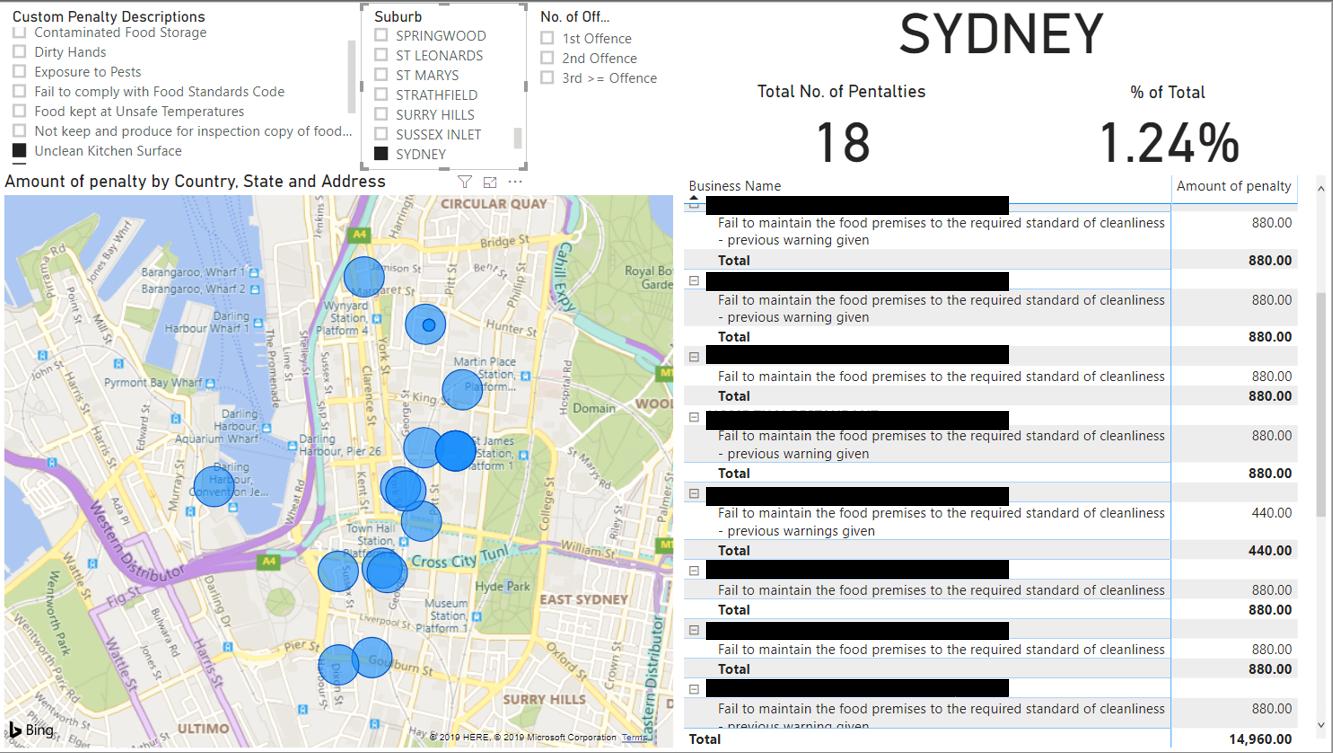
Power BI Blog: Sydney’s Register of Food Penalty Notices – Part 6
12 December 2019
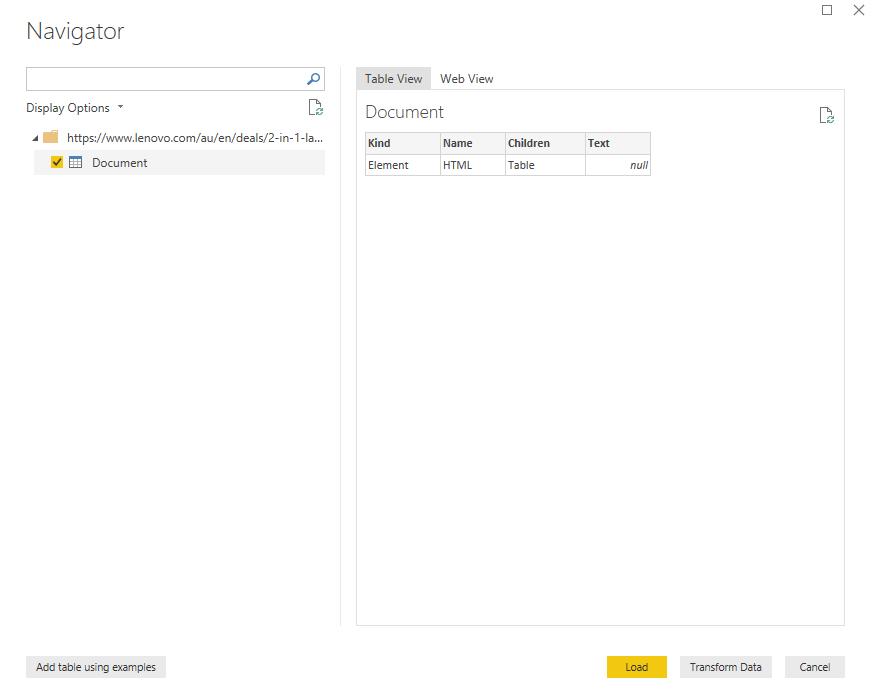
Power BI Blog: New Web Table Inference (Black Friday Special)
5 December 2019