
Blog
Power BI Blog: New Year, New Icons
7 January 2021
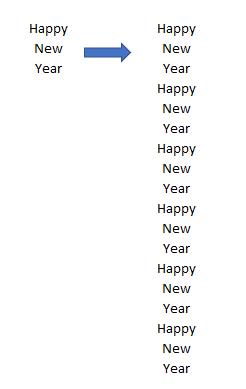
Power Query: New Year Function
6 January 2021
Power Pivot Principles: SWITCH the Slicer
5 January 2021

A to Z of Excel Functions: The IMSQRT Function
4 January 2021
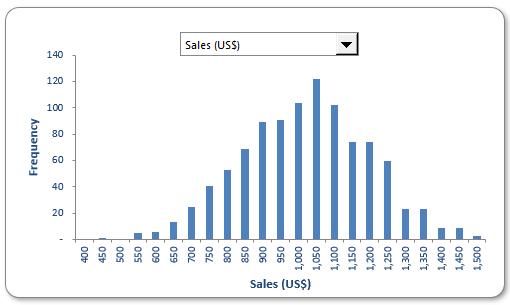
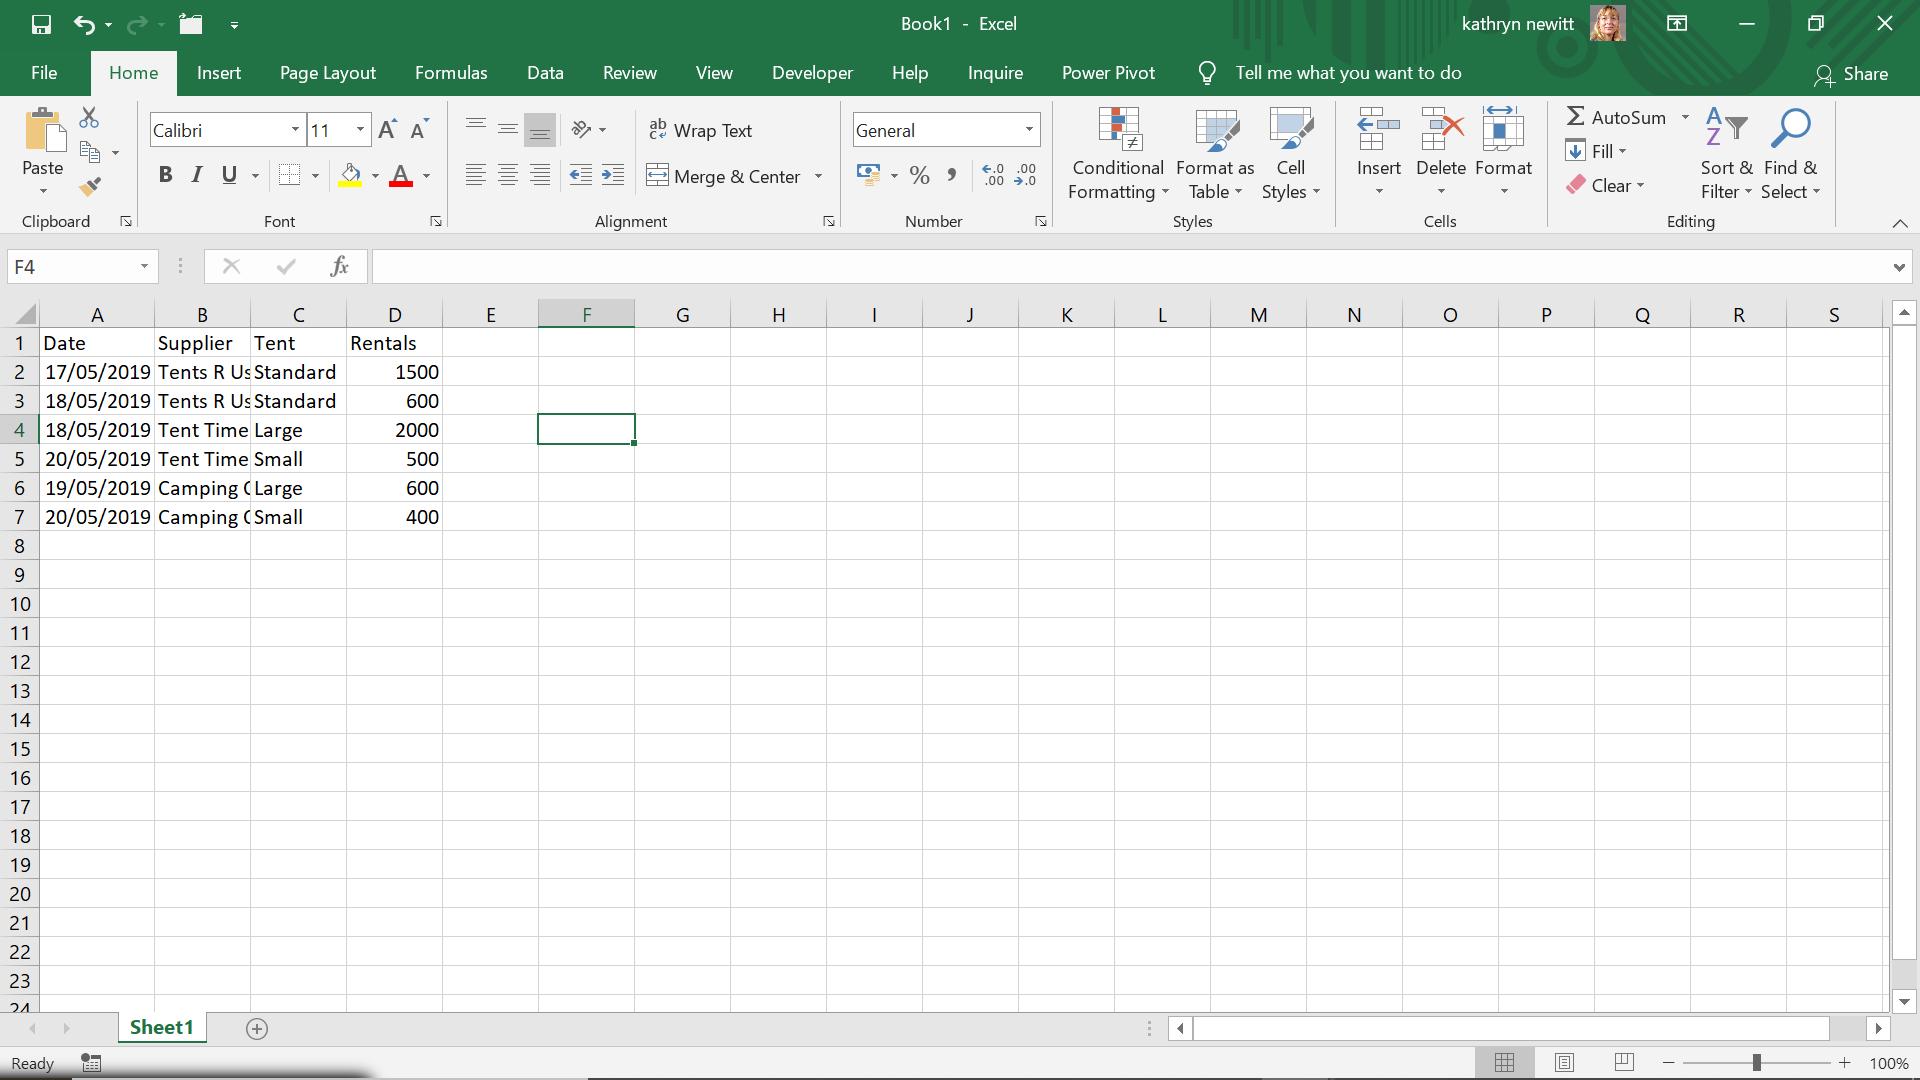
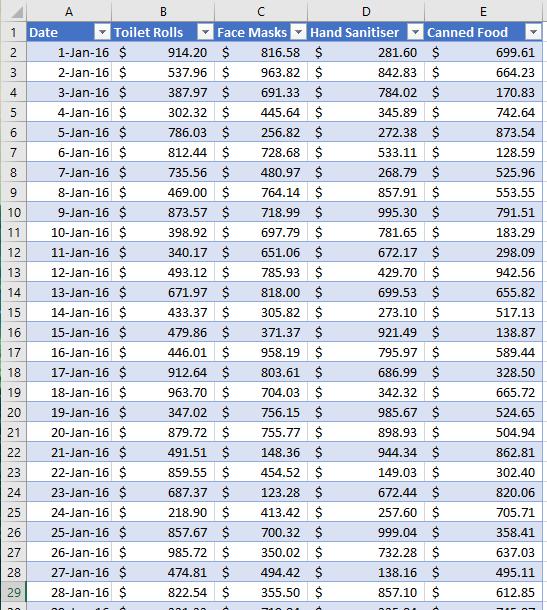
Charts and Dashboards: Dynamic Simulation Charts
1 January 2021
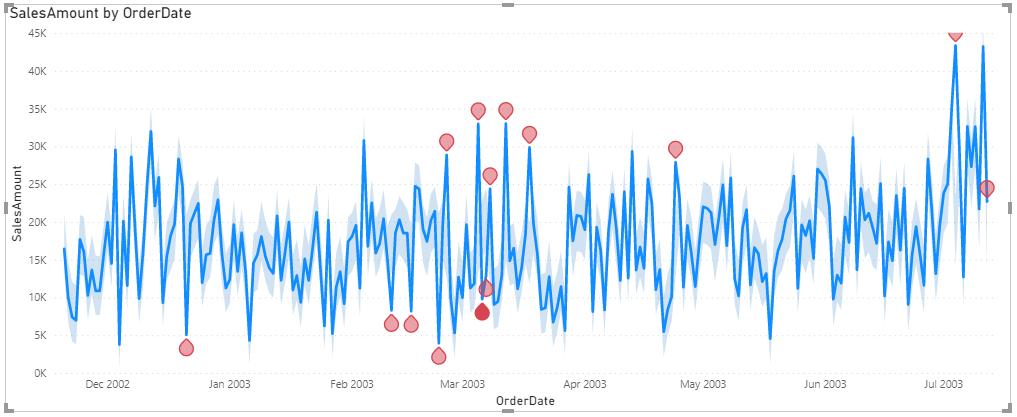
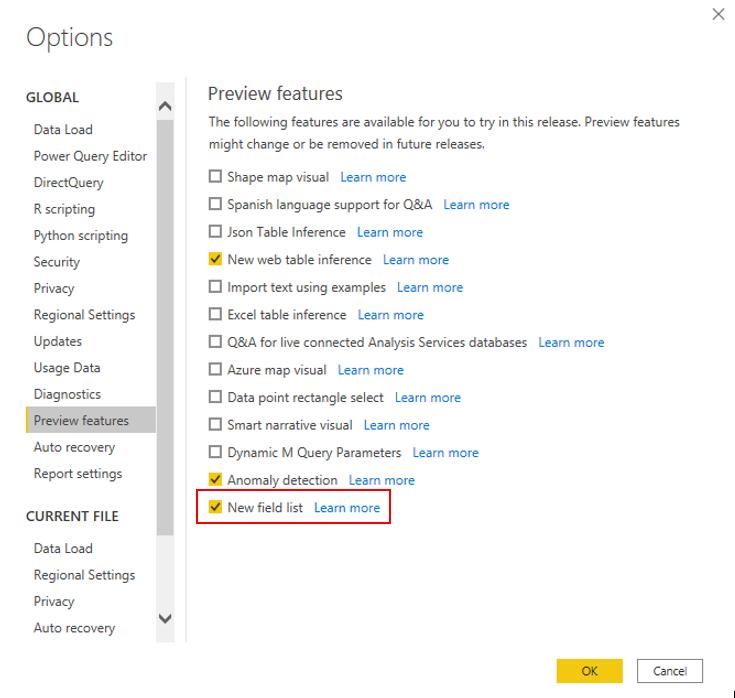
Power BI Blog: Anomaly Detection
31 December 2020
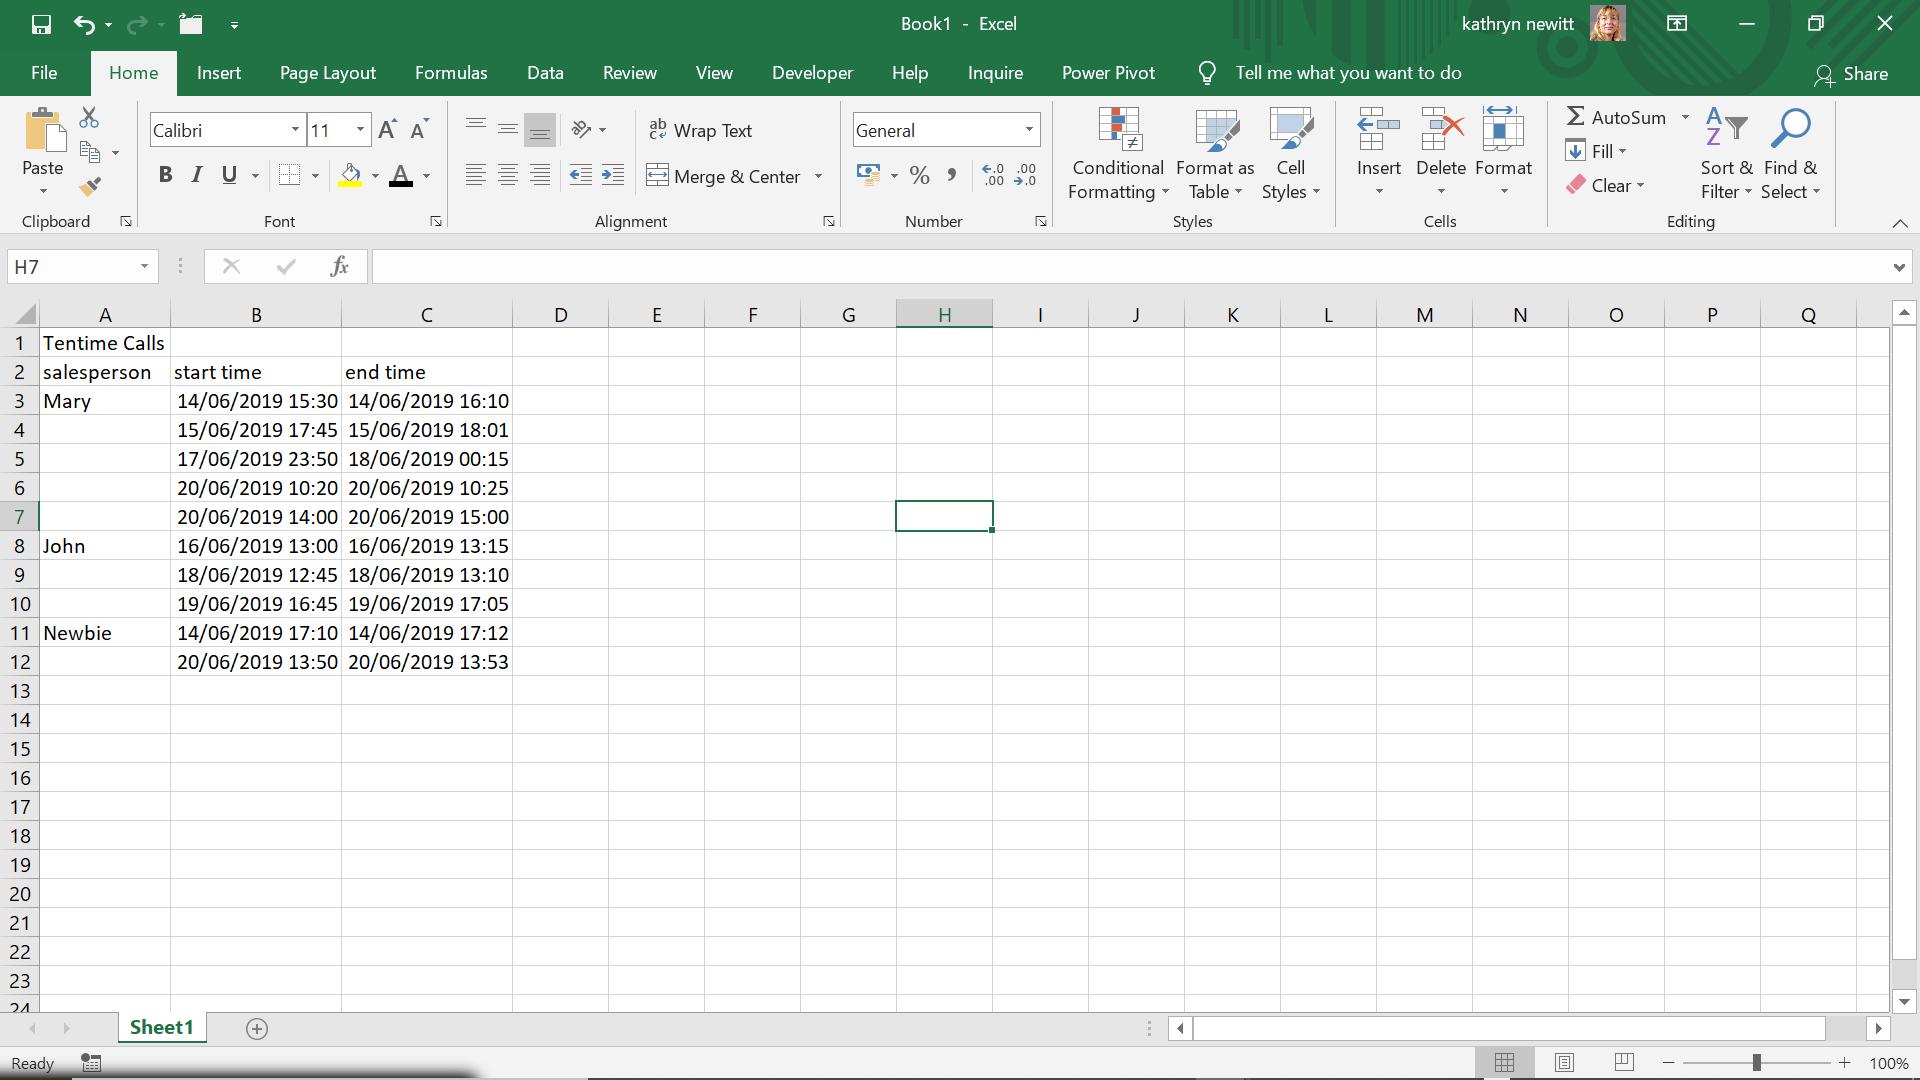
Power Query: Timings
30 December 2020
Monday Morning Mulling: December 2020 Challenge
28 December 2020

Final Friday Fix: December 2020 Challenge
25 December 2020